About
Science
Projects & Data
Future
Outreach
News
Events
Community
- Science Collaborations
- Beacon-JWST
-
GOALS
Great Observatories All-sky LIRG Survey
-
PASSAGE
Parallel Application of Slitless Spectroscopy to Analyze Galaxy Evolution
-
RAPID PIT
Roman Alerts Promptly from Image Differencing
-
Roman GRS PIT
Roman Galaxy Redshift Survey Project Infrastructure Team
-
Roman HLIS Cosmology PIT
Roman Project Infrastructure Team: Cosmology with the Roman High Latitude Imaging Survey
- More
- Legacy
-
2MASS
Two Micron All Sky Survey
-
Herschel
NASA Herschel Science Center
-
IRAS
Infrared Astronomical Satellite
-
ISO
Infrared Space Observatory
-
LTB
Lunar Trailblazer
-
NEOWISE
Near-Earth Object Wide-field Infrared Survey Explorer
-
Planck
U.S. Planck Data Center
-
SOFIA
Stratospheric Observatory for Infrared Astronomy
-
Spitzer
Spitzer Science Center
-
TMT
Thirty Meter Telescope
-
WISE
Wide-field Infrared Survey Explorer
About
- Our Mission
- History
- Organization
- Committees
- Staff Directory
- Meet the Staff
- Job Opportunities
- Contact Us
Science
- Overview
- Science Staff
- Meet the Scientists
- Talks
- Fellowships
- Publications
- Science Collaborations
- Students
Projects & Data
Future
Outreach
- Overview
- Education
- Animation/Video Production
- Science Visualization & Illustration
- Virtual Reality
- Outreach & Communications
- Website Development
- Education & Outreach
News
Events
Community
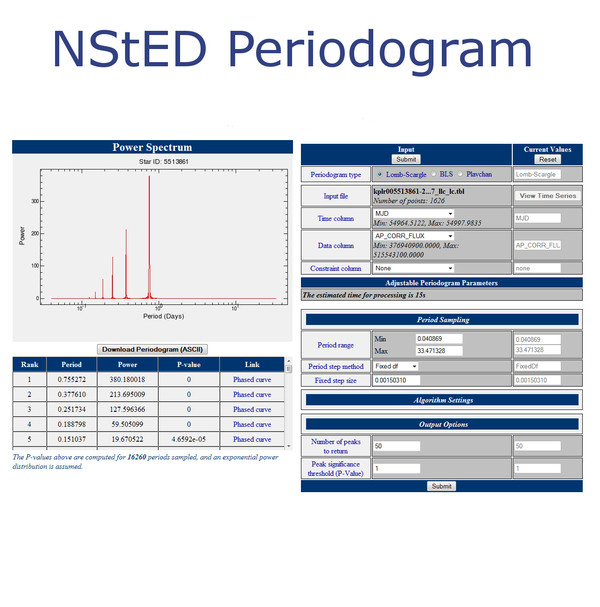
Overview: A periodogram measures the variation of spectral frequency in a time series data set, and is one of the most powerful tools in extracting periodic signals from time-varying data sets.
- Periodogram Homepage
Links
A periodogram measures the variation of spectral frequency in a time series data set, and is one of the most powerful tools in extracting periodic signals from time-varying data sets. The periodogram tool developed at NStED returns three main products: the periodogram itself; a table of the peaks in the periodogram, with the associated probabilities that these peaks arise by chance; and light curves phased to these periods.


Policies
Get in Touch