Science Visualization & Illustration
A key tool in the communication of complex scientific concepts to any audience, from students to researchers, is the effective visualization of data and science concepts. Whether the data or concept is a raster image map, a spectrum, time series, or other tabular result, finding effective visual representations can greatly increase engagement with and understanding of the result.
IPAC has a long tradition of cutting-edge data visualizations, having produced our first all-sky representations of the infrared universe, a complete infrared view of the Milky Way plane from Spitzer, the various components of the sky derived from Planck observations, press release imagery for Spitzer, the Astropix repository of public release astronomy imagery, and more.
Recently, an increased focus on public communications for both the science media and general public has resulted in a dedicated team that works to turn science datasets into compelling photographic representations, to render spectra and data plots comprehensible through visual contextualization, and to generate artwork and animations to help visualize key science results. IPAC’s science visualization work frequently appearance in the science media, documentaries, television, and major motion pictures.
IPAC expertise includes:
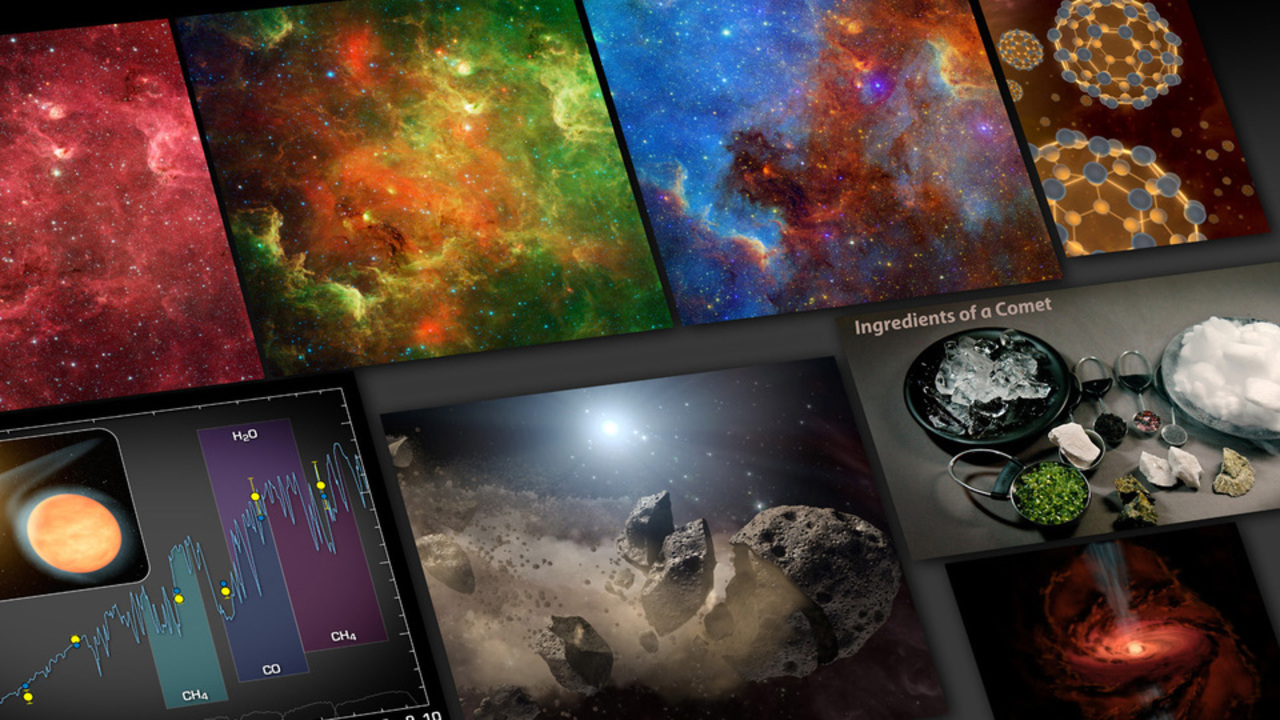
- Data visualization
- Spectra and charts
- Illustrations
- Animations
- Graphic design (including logos)
- Posters, Brochures
- Banners
- Mugs/Pins/Bags/Temporary tattoos, etc.
IPAC is the host for the first-of-its-kind archive of astronomical data visualizations and artwork whose primary audience is the general public (which of course includes astronomers as well).
AstroPix offers access to the public image galleries of many of the leading astronomical observatories under a single unified interface. Assets include a full range of astronomical observations, artwork, and charts spanning the field of astronomy.
On this site are thousands of images collected from many telescopes around the world and and in space. AstroPix adds new imagery as it becomes available every night. Content is supplied from a growing list of observatories.
Science Engagement Lab at Caltech / IPAC Galleries (hosted at AstroPix)