 |
|---|
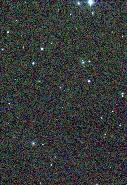
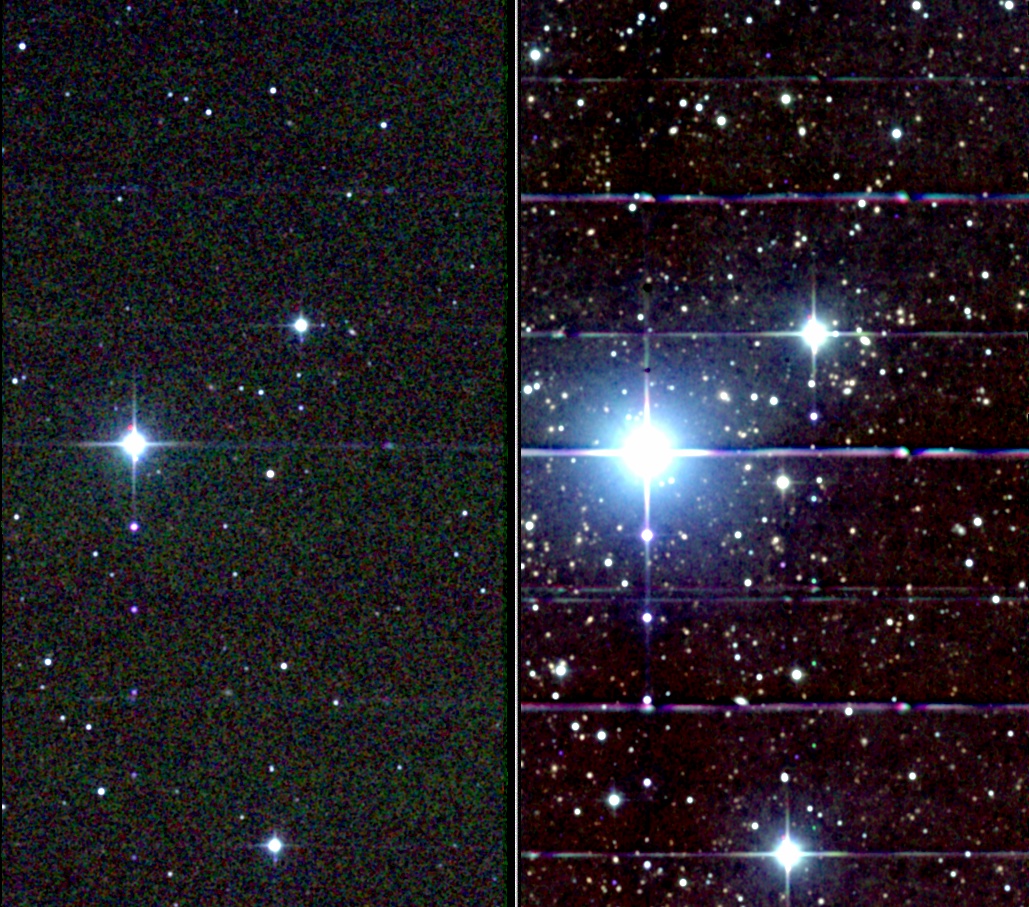
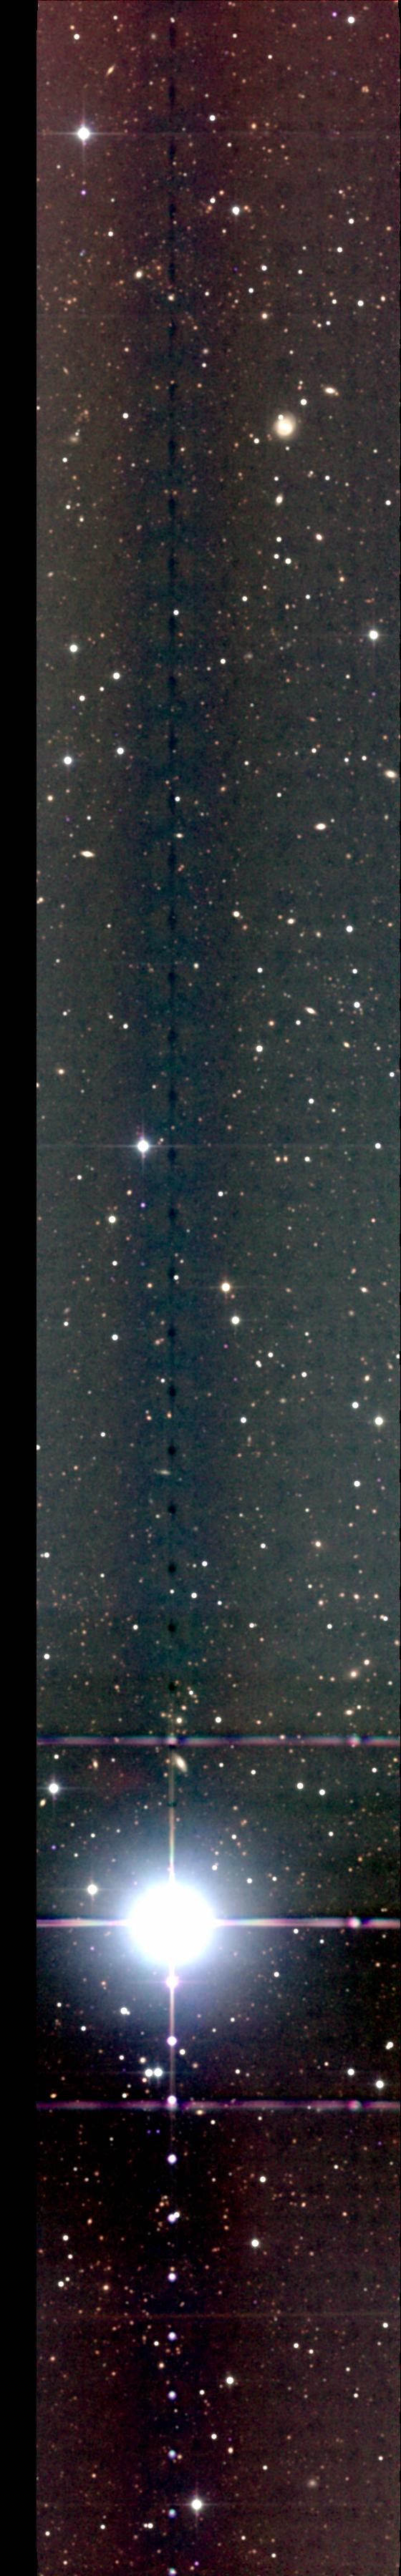
| Figure 1 - Comparison of a single epoch and 1400 combined-epoch images of a section of the 90004 2MASS calibration field. |
The 2MASS Calibration Field scans are distinguished among the 2MASS data sets in that they consist of highly redundant observations of selected small regions of the sky. Whereas the main survey and 6x observations scanned most of the sky once, each 8.5'x1° calibration field was observed hundreds to thousands of times. In addition to providing a unique multi-epoch data set for time-dependent studies (A4.1.a), the redundant and highly uniform calibration scans are well suited for image combination to achieve the deepest measurements enabled by 2MASS.
The Combined 2MASS Calibration Scan Images and Source Lists were produced by averaging together the best images of each calibration field and performing conservative source detection on the resulting images. The total exposure times accumulated for the calibration fields range from one to eight hours, so the combined calibration scan images reach 3.5 to 4.5 magnitudes deeper than single scans in the absence of confusion. Moreover, because the saturation level in the combined images remains the same as in single scans, photometry extracted from the images can be easily compared with source photometry from the survey and single calibration scan.
The Combined 2MASS Calibration Scan Images were generated by combining the images from each calibration scan produced during 2MASS pipeline data reduction. The individual scan images were spatially registered, normalized to a common photometric zero point, and combined using an inverse-noise-weighted averaging algorithm. The detailed image combination procedure is described in A7.2. Figure 1 contains an interactive comparison between the images from a single-scan of the 90004 calibration field and those produced by combining approximately 1400 scans of the field (half of the available data). This comparison illustrates how the nearly 4 magnitudes of additional sensitivity result in a dramatic increase in the number of detected sources, and in the detectability of extended emission from faint galaxies. The images also show how artifacts such as latent images, electronic and optical ghosts and flat-fielding residuals that were well below the noise limit in the single scans become clearly visible in the combined images.
Each 2MASS calibration observation consisted of six independent scans of a calibration field made in alternating north and south directions, with a 5" easterly RA displacement between scans. Images from the north-going and south-going scans were first combined separately for each field to facilitate the identification and elimination of detections of spurious artifacts (A7.3.c). Then all north- and south-going scan images were combined for maximal depth. Because of the RA displacements during the calibration observations, and because of small, random telescope pointing errors, the depth-of-coverage of each field was not uniform. The effective sensitivity rolls off towards the edges of the combined images, with a corresponding increase in the background noise. Versions of the combined each images were also produced that have pixels covered by less than 30% of the available scans in each field masked off to facilitate noise-thresholded source detection. In all, there are 21 FITS images provided for each calibration field. In each of the 3 survey bands, J, H and Ks, the images are:
Access to the deep Combined 2MASS Calibration Scan Images is provided via an on-line ftp interface in A7.4. The general properties of the deep images are described in A7.5.
|
|---|
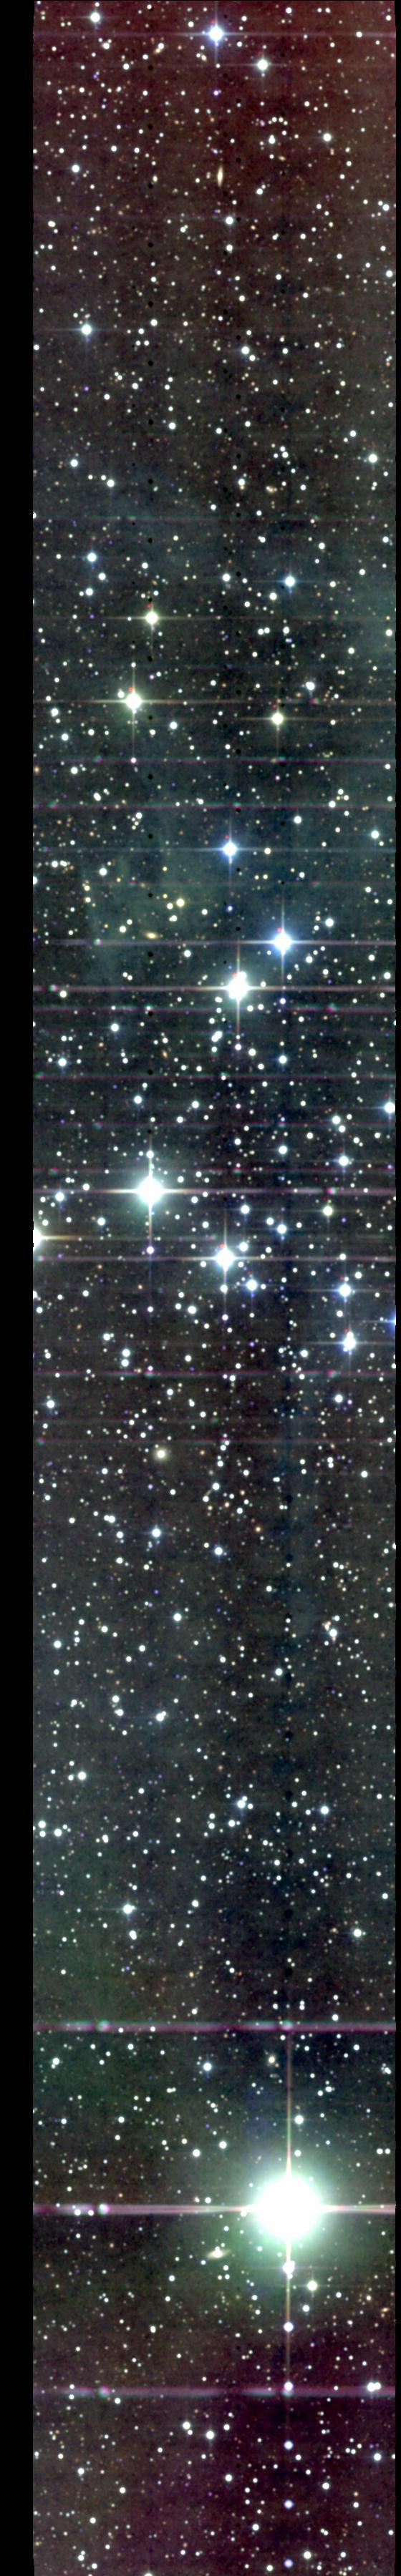
| Figure 1 - Comparison of a single epoch and 1400 combined-epoch images of a section of the 90004 2MASS calibration field. |
The deep images are the primary products of the calibration scan data combination. Because these images reach depths that can be confusion limited in even the highest galactic latitude fields, it is anticipated that users will wish to perform their own source extraction and profile-fitting and custom aperture photometry on the objects detected in the images. A set of preliminary Source Lists from the combined calibration images is provided as part of the 2MASS Extended Mission data products. These source lists are not intended to be best possible characterizations of objects in the images. Rather they provide users with a quick, albeit conservative access point for detected source data in the fields. More importantly, the source extraction process illustrates critical factors that should be taken into account when you perform your own extractions, such as artifact identification and photometric calibration.
The source detection process, aperture photometry and astrometric and photometric calibration for the Combined Calibration Scan Source Lists are described in A7.3. Source detection was performed separately on the combined north-going and south-going images from each field that were masked down to the >30% coverage areas. Extractions were required to be detected on both north- and south-going images to filter out many of the spurious detections of image artifacts such as latent images, diffractions spikes and bright source ghosts. exclude Simple circular aperture photometry was performed on each confirming source, and the resulting J, H and Ks magnitudes were bootstrapped to the main 2MASS survey photometric system by normalizing to the measurements of the primary and secondary 2MASS standard stars in each field. The final Source Lists contain positions and 3-band photometry of sources detected down to a limit of approximately five times the effective noise level in each of the images. Also given for each extracted source are flags indicating whether the source was found to be associated with an image artifact not removed by the north-south confirmation requirement, and the identification numbers of entries in the All-Sky PSC or XSC (cntr_psc, cntr_xsc) that are positionally associated with the combined calibration scan source.
Figure 2 shows near infrared color-magnitude and color-color diagrams generated using the Source Lists from the 90272, 90301 and 90330 high galactic latitude 2MASS calibration fields. These fields have depths ranging between 3.5 and 4.0 magnitudes deeper than single 2MASS scans. The improved sensitivity provides both a deeper sampling of the stellar main sequence as well as the detection of the faint, red galaxy population with Ks> 15 mag and J-Ks>1 mag that is just barely detected at the depth of the main 2MASS survey. As illustrated in Figure 3, extragalactic sources begin to dominate near infrared counts at high latitudes at Ks>15.5 mag. The deepest combined calibration scan images reach limiting magnitudes of Ks~19, and thus have the sensitivity to probe L* galaxies out to z~0.8-1.0.
The format of the Combined Calibration Scan Source List
tables is described in A7.3.d.
Access to the extracted source lists from each field is
provided in A7.4, and their general properties
are described in A7.5.
 |
 |
Figure 2 - Color-magnitude (top) and color-color diagrams extracted from the combined 90272, 90301 and 90330 high galactic latitude calibration field images. The primary 2MASS survey was complete to Ks<14.3 mag. | Figure 3 - Cumulative Ks source counts from the 90272 combined calibration field extracted source list (crosses) compared with the high latitude counts from the 2MASS All-Sky PSC and XSC (points). Dashed lines show power law fits to the main survey point and extended source counts. |
Thirty-five calibration fields were observed during the main survey, and five additional fields were observed from late 2000 to early 2001 to support the long exposure "6x" observations of the Large and Small Magellanic Clouds. The location on the sky of the survey and LMC/SMC calibration fields is shown in Figure 4, and Table 1 contains a listing of the calibration fields, their mean centers in equatorial and galactic coordinates, and the total number of scans taken of each in photometric conditions. Click the "Tile" number in the first column of Table 1 to view a preview 3-color JPEG image of the combined north-going images for each field.
|
|---|
| Figure 4 - Equatorial sky map showing locations of the 2MASS survey (filled squares) and LMC/SMC (open squares) calibration fields. |
Under the "Final Image Stack" columns of Table 1 are the number of north-going and south-going scans that were incorporated into the final combined calibration scan images for each band. As discussed in A7.2.b, calibration scans whose images contained anomalies such as residual meteor trails, severe airglow emission, extremely poor seeing and even ladybug trails were excluded from the final combined image "stacks." Hence the sum of number of scans used in the north- and south-going combined images is less than the total number of scans available for each field. The improvement in sensitivity relative to single scans realized for high galactic latitude fields is very close to the square root of the number of scans combined. At lower latitudes where confusion becomes increasingly important, the sensitivity improvement can be less than the sqrt(N).
The final column of Table 1 contains a link to a page summarizing the general properties of the images and extracted source lists for each field. A description of the contents of these summary pages, and a discussion of the overall properties of the combined calibration fields is given in A7.5.
| Field Summary | Final Image Stack | Properties | |||||||
|---|---|---|---|---|---|---|---|---|---|
| Tile | ra(J2000) | dec(J2000) | glon | glat | Nscn | NJ(N/S) | NH(N/S) | NK(N/S) | |
| 90021 | 6.10619 | -1.97294 | 107.36651 | -64.02523 | 2025 | 875/873 | 873/872 | 907/906 | P |
| 90294 | 8.31622 | -39.40154 | 318.91629 | -77.15726 | 2621 | 1208/1208 | 1208/1207 | 1207/1207 | P |
| 90299* | 11.25260 | -70.58353 | 303.70812 | -46.53497 | 468 | 217/217 | 217/217 | 217/217 | P |
| 90004 | 28.66074 | +0.71693 | 154.11677 | -58.27527 | 2977 | 1393/1391 | 1404/1405 | 1411/1412 | P |
| 90301 | 51.72678 | -39.84268 | 244.63466 | -55.50638 | 3430 | 1627/1628 | 1627/1628 | 1627/1628 | P |
| 90247 | 53.01617 | +37.34386 | 155.04346 | -15.31752 | 1962 | 885/900 | 885/899 | 888/904 | P |
| 90533 | 55.26392 | +6.93647 | 179.51313 | -36.67609 | 1839 | 851/847 | 851/847 | 860/855 | P |
| 90191 | 66.58918 | +3.62342 | 190.90892 | -29.77810 | 2086 | 979/973 | 979/973 | 979/974 | P |
| 90400* | 74.90247 | -65.73341 | 276.28631 | -35.95631 | 378 | 166/166 | 166/166 | 166/166 | P |
| 90401* | 78.62001 | -71.00065 | 282.10956 | -33.37346 | 432 | 75/75 | 75/75 | 75/75 | P |
| 90013 | 89.28447 | +0.01890 | 206.63167 | -12.04885 | 3515 | 1631/1626 | 1632/1624 | 1631/1624 | P |
| 90402* | 93.56589 | -69.66665 | 279.95935 | -28.52288 | 156 | 196/197 | 196/197 | 196/197 | P |
| 90121 | 97.37444 | -59.65713 | 268.95105 | -25.88052 | 562 | 267/266 | 266/267 | 266/267 | P |
| 90161 | 105.22232 | +48.48935 | 168.28907 | +21.45529 | 2593 | 1170/1171 | 1169/1171 | 1205/1209 | P |
| 90312 | 126.40319 | -39.09847 | 257.57412 | -0.66895 | 3501 | 1655/1651 | 1654/1650 | 1654/1649 | P |
| 92026 | 128.12790 | -1.57084 | 226.54812 | +21.54656 | 2158 | 1019/1019 | 1018/1018 | 1017/1017 | P |
| 90067 | 132.81203 | +11.84773 | 215.63879 | +31.90474 | 3692 | 1698/1706 | 1695/1705 | 1695/1705 | P |
| 90091 | 145.75214 | +59.06160 | 154.88828 | +44.63064 | 789 | 369/369 | 369/369 | 369/369 | P |
| 92397 | 170.45775 | -13.22047 | 271.78770 | +44.16553 | 2585 | 1195/1199 | 1193/1197 | 1193/1197 | P |
| 90217 | 180.44070 | -50.05148 | 294.81518 | +12.03580 | 1687 | 796/795 | 796/794 | 796/795 | P |
| 90266 | 183.61047 | +35.59855 | 163.59937 | +78.43114 | 2776 | 1299/1299 | 1299/1299 | 1305/1305 | P |
| 90860 | 185.41757 | -0.12034 | 287.00945 | +61.82763 | 2452 | 1087/1078 | 1075/1068 | 1075/1066 | P |
| 90867 | 220.24529 | -0.45767 | 351.08190 | +51.86698 | 949 | 453/447 | 453/446 | 453/446 | P |
| 90273 | 224.21932 | -44.81900 | 325.15505 | +12.57220 | 1780 | 832/841 | 832/840 | 832/841 | P |
| 90272 | 224.64303 | +37.14173 | 61.47581 | +61.44777 | 1973 | 898/901 | 898/901 | 923/926 | P |
| 90868 | 225.11368 | -0.65787 | 356.36663 | +48.36291 | 2186 | 1029/1027 | 1029/1027 | 1029/1027 | P |
| 90565 | 246.68168 | +5.87185 | 20.52082 | +34.69775 | 3396 | 1545/1551 | 1545/1550 | 1588/1593 | P |
| 90009 | 246.80780 | -24.68901 | 352.96954 | +16.58465 | 1582 | 749/752 | 749/752 | 748/752 | P |
| 90330 | 247.89420 | +30.14552 | 50.25044 | +42.07085 | 1192 | 564/564 | 564/564 | 564/564 | P |
| 90279 | 267.09736 | -45.42783 | 346.06515 | -8.92593 | 977 | 461/464 | 462/464 | 461/464 | P |
| 90182 | 279.89627 | +49.09363 | 78.07393 | +22.00907 | 1703 | 728/728 | 727/729 | 755/755 | P |
| 90547 | 282.82780 | -4.27488 | 29.11141 | -1.91959 | 671 | 270/278 | 270/277 | 279/286 | P |
| 90808 | 285.48438 | -4.48794 | 30.12525 | -4.37662 | 1876 | 848/850 | 847/850 | 850/853 | P |
| 90234 | 307.83812 | -49.64775 | 349.60727 | -36.21631 | 2076 | 981/981 | 981/981 | 981/981 | P |
| 90813 | 310.27504 | -5.06339 | 41.33281 | -26.64299 | 1570 | 699/708 | 699/707 | 719/721 | P |
| 92409 | 330.11998 | +20.84962 | 77.72803 | -26.65088 | 1439 | 654/650 | 654/650 | 666/662 | P |
| 92202 | 331.40247 | -11.07477 | 47.13268 | -47.91669 | 2802 | 1318/1318 | 1318/1318 | 1318/1318 | P |
| 90893 | 349.54575 | +0.54857 | 80.12434 | -54.38199 | 2619 | 1200/1199 | 1200/1199 | 1225/1223 | P |
| 90290 | 352.64369 | +38.31591 | 105.94466 | -21.87369 | 1141 | 564/565 | 564/565 | 567/568 | P |
| 90298* | 356.63061 | -74.50079 | 308.68978 | -41.89381 | 108 | 52/52 | 52/52 | 52/52 | P |
Because the Combined Calibration Field Products are generated from the 2MASS Calibration Scan Atlas Images, they exhibit most of the same characteristics and limitations as the data from the individual scans. Users are therefore encouraged to familiarize themselves with the Cautionary Notes to the Calibration Scan Working Databases and Atlas Images before using the Combined Calibration Images and Source Lists.
The sections below describe features and caveats that are unique to
the Combined Calibration Scan data products and repeat a few of the
important features that are characteristic of the calibration scan
data in general.
The Combined Calibration Scan Images and Source Lists should be used with caution because they have not received the same level of scrutiny and validation as the All-Sky Release Atlas Images and Catalogs. The primary products from the Combined Calibration Scans are the combined images. Please refer to these images frequently to check for the presence of artifacts and to assess the reliability of detected sources either from the source lists provided, or from custom source extractions performed by the user.
The reconstructed astrometry of the Combined Calibration Images and Source lists have systematic offsets of up to ~0.5" with respect to the 2MASS All-Sky Atlas Images, PSC and XSC.
Position reconstruction for the calibration scan data (A4.4.b) used USNO-A2.0 as the primary astrometric reference catalog, rather than the Tycho-2 Catalog that was used as the reference for the main survey. Because of small systematic astrometric differences between USNO-A2.0 and Tycho-2, the resulting calibration scan astrometry has systematic biases with respect to the main survey (and 6x) data.
The mean position offset between the calibration scan and survey Atlas images was corrected during the image combination process by determining the average offsets between sources extracted from the individual calibration scans and their counterparts in the All-Sky PSC, and then applying those offsets to each calibration scan image before final combination. However, this procedure did not remove right ascension or declination offset structure within each scan. The residual astrometric offsets with respect to the main survey can bee seen in Figure 9-14 in the detailed field property descriptions that are accessed in A7.5.
The largest overall astrometric residuals occur in the combined calibration image and source lists the 90004 field. The individual calibration scans in this field have "raw" astrometric offsets with respect to the All-Sky PSC large enough that many of the positional correlations between the individual scan extractions and the PSC were missed. This resulted in an undercorrection of the mean astrometric offsets in the combined image for the field.
Combination of the calibration scan images reduces the background photon noise by factors of 25-60. As a result, image artifacts produced by bright stars are accenuated, and faint artifacts that were well below the detection limit in the single scan images become visible, as illustrated in Figure 5.
These artifacts will trigger false source detections by most source detection algorithms, so care must be exercised when interpreting extracted source lists. Users are strongly recommended to examine the position of sources extracted from the combined calibration scan images to assess reliability. Artifacts such as diffraction spikes and optical and electronic ghosts are easy to recognize on the images. However, latent images "downstream" of bright stars and dichroic glints often appear point-like and may be confused with compact sources on the sky. Do not mistake these for images of real objects. Latent images can usually be identified by comparing the combined images from the north-going and south-going scans because the artifacts extended in opposite directions from their parent bright star in the two (e.g. A7.3.c). Dichroic glints have a specific relationship to the position of their "parent" star that is described in IV.7.
Most of the deep, combined calibration scan images exhibit
irregular background structure due to the residual presence of bright
stars in the sky offset correction images.
Designed to remove the dark-sky illumination pattern on the detectors,
the sky offset frames were generated by creating
 -trimmed averages of all 42
dark-subtracted, flat-fielded frames in each calibration scan.
Very bright stars in the images were not perfectly removed by
the trimmed averaging, and their residual images left negative imprints
in the sky frames when the sky offsets were subtracted. These
residuals are normally well below the detection limit in the individual
scan images, and did not adversely effect photometry in the main
survey and calibration scans. However, they are prominent
in many of the deep, combined images (e.g. see
90021) because of
the suppression of the sky photon noise. These residual
negative spots are one of the dominant background noise sources
in the deep images, and ultimately
limit the accuracy of photometry particularly for extended objects.
-trimmed averages of all 42
dark-subtracted, flat-fielded frames in each calibration scan.
Very bright stars in the images were not perfectly removed by
the trimmed averaging, and their residual images left negative imprints
in the sky frames when the sky offsets were subtracted. These
residuals are normally well below the detection limit in the individual
scan images, and did not adversely effect photometry in the main
survey and calibration scans. However, they are prominent
in many of the deep, combined images (e.g. see
90021) because of
the suppression of the sky photon noise. These residual
negative spots are one of the dominant background noise sources
in the deep images, and ultimately
limit the accuracy of photometry particularly for extended objects.
 |
| Figure 5 - J, H, Ks three-color images showing the central region of the 92397 calibration field. (left) from a single scan, (right) from the combination of all north-going scans). |
Residual Airglow
Very low frequency background structure is present in some of the combined calibration scan images due to the residual effects of variable atmospheric airlgow emission in the individual scans. Combining the hundreds to thousands of individual images in which randomly distributed diffuse airglow structure suppresses the structure considerably, but does not remove it completely. The residual emission is usually seen as a background gradient varying with declination within the images.
Diffuse Astronomical Emission
Some calibration fields exhibit diffuse background emission that is real and not due to airglow. The most obvious example is seen in the images of the 90009 field which is located near the core of the rho Ophiuchus molecular cloud. A more subtle example is the narrow bands of diffuse emission visible in the northern half of the combined images of the 90247 field. This emission is correlated with far infrared emission from dust in the diffuse interstellar medium that is visible in the IRAS Sky Survey Atlas images, as shown in Figures 5 and 6.
 |
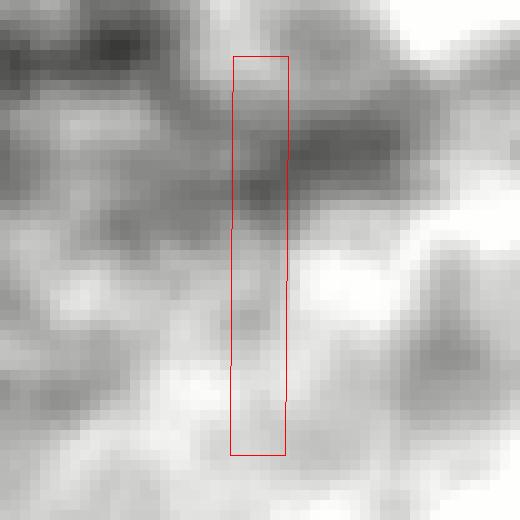 |
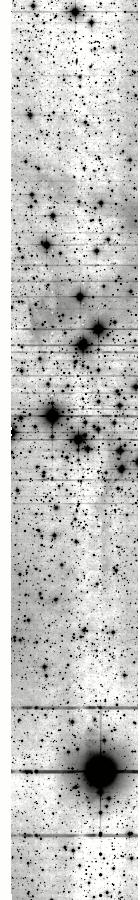
| Figure 6 - J-band image of the combined north-going scans of the 90247 calibration field. | Figure 7 - IRAS Sky Survey Atlas 100 micron image showing 1.25°x1.25° region centered on the 2MASS 90247 calibration field. The area covered by the image showin in Figure X is outlined in red. |
The depth-of-coverage in the combined calibration images is not uniform. It drops off towards the east-west and north-south edges of the calibration fields because of the RA cross-stepping during calibration observations and small telescope pointing variations. As a result, the relative sensitivity drops and background photon noise level rises towards the field edges.
Coverage
maps are provided for all of the J, H and Ks north-going and
south-going combined images for each field. We recommend using the
version of the combined calibration images that are
masked
to an area covered by at least 30% of the available when performing
source detection using noise-based thresholds.
Photometry of bright stars should be recovered from the All-Sky PSC and XSC, or Calibration PSWDB and XSWDB and not measured directly on the combined calibration scan images. No correction for saturation was made during calibration scan Atlas Image construction. Therefore, images of sources that saturate the 1.3 s READ2-READ1 exposures will be saturated in the combined calibration scan images. Saturation occurs for stars brighter than approximately J<9, H<8.5 and Ks<8.0 mag.
Flux measurement of sources detected in the combined calibration scan images was performed using simple aperture photometry. A 4" radius measurement aperture was used, with a sky reference annulus with inner and outer radii of 24" and 3-", respectively, the same parameters used for photometry in the main survey, 6x and calibration scan data processing.
The resulting flux measurement for an object may be overestimated if one or more other sources fall within their measurement aperture. Similarly, the flux measurement may be underestimated if emission from nearby sources contaminates too much of the sky reference annulus. In general, noise due to the confusion of nearby sources contributes significantly to the overall measurement uncertainty from the combined calibration scan images in all by the highest galactic latitude fields.
The flux of sources with an extent larger than the 4" radius measurement
aperture will be systematically underestimated.
No attempt to distinguish point-like and not-point-like
objects were made during the source measurement and characterization process.
It should be possible to achieve more precise flux measurements of
extended sources using custom profile-fit and elliptical
aperture photometry.
Flux upper limits are not provided for bands in which sources
were not detected in the combined calibration scans.
Non-detections in a band are denoted with
null values in the magnitude and uncertainty columns
([jhk]_m and
[jhk]_msig) in the
extracted source lists.
Upper limits to the flux in non-detected bands can be estimated
by performing aperture photometry on the combined image at
the location of the source detected in other band(s).
The source lists extracted from the combined calibration scan images contain a number of spurious detections of image artifacts and low SNR noise excursions.
Many of the unreliable sources in the extracted source lists are flagged as artifacts by their non-zero value of the confusion and contamination flag, cc_flg=[G,P,D,A]'. This flag was set as part of the artifact identification process described in A7.3.c. Do not interpret these entries as measurements of real astrophysical sources. They are left in the source lists to help users identify potential spurious artifact detections in their own source extractions (Figure 8).
The combined calibration scan source lists are also known to contain a number of unreliable extractions that are not flagged as artifacts. These extractions are typically of faint noise excursions, and often have low SNR measurements in one band only. There is usually no identifiable source at the position of these unreliable sources in the deep images.
Users are strongly recommended to examine the position of sources on both the north- and south-going combined calibration scan images scan images to assess reliability.
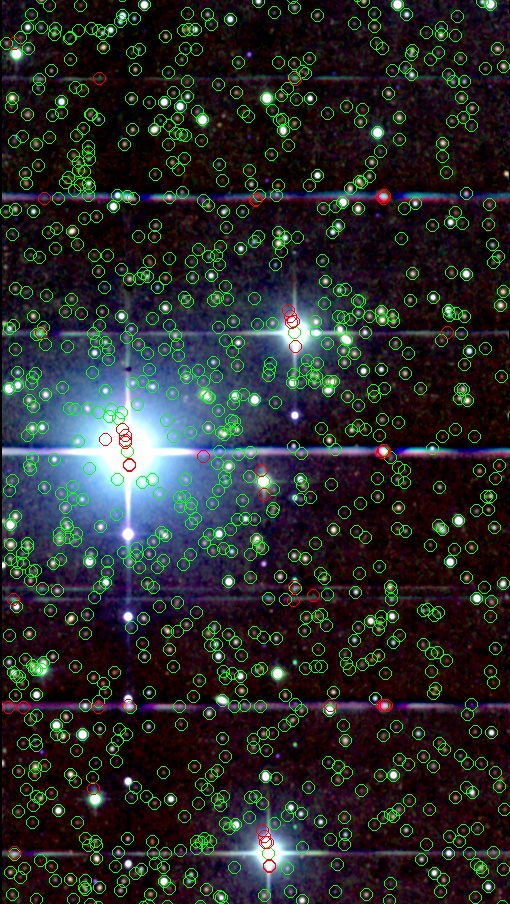 |
| Figure 8 - J, H, Ks 3-color image of the same section of the combined north-going image of the 92397 calibration field shown in in Figure 7. 8" diameter circles denote the location of sources in the extracted source list for this field. Red circles indicate source entries with cc_flg values identified with artifact detections. |
[Last Updated: 2006 October 30; by R. Cutri]