Appendix 7. Combined Calibration Scan Images and Source Lists
5. General Properties of the Combined Calibration Field Data
Table 1 contains a summary of the basic 2MASS calibration field and
combined calibration field image properties. The column titles "Properties"
contains a link to web pages that summarize the detailed properties
of the observations, images and extracted sources from each field.
The contents of the field summaries are described below along with some
of the key features found in the data. Each field summary page also
contains a link to the
Combined Calibration scan Data Access Page.
Table 1 - 2MASS Combined Calibration Field Summaries
| Field Summary | Final Image Stack | Properties |
|---|
| Tile | ra(J2000) | dec(J2000) | glon | glat | Nscn | NJ(N/S) | NH(N/S) | NK(N/S) |
|---|
| 90021 | 6.10619 | -1.97294 | 107.36651 | -64.02523 | 2025 | 875/873 | 873/872 | 907/906 | P |
| 90294 | 8.31622 | -39.40154 | 318.91629 | -77.15726 | 2621 | 1208/1208 | 1208/1207 | 1207/1207 | P |
| 90299* | 11.25260 | -70.58353 | 303.70812 | -46.53497 | 468 | 217/217 | 217/217 | 217/217 | P |
| 90004 | 28.66074 | +0.71693 | 154.11677 | -58.27527 | 2977 | 1393/1391 | 1404/1405 | 1411/1412 | P |
| 90301 | 51.72678 | -39.84268 | 244.63466 | -55.50638 | 3430 | 1627/1628 | 1627/1628 | 1627/1628 | P |
| 90247 | 53.01617 | +37.34386 | 155.04346 | -15.31752 | 1962 | 885/900 | 885/899 | 888/904 | P |
| 90533 | 55.26392 | +6.93647 | 179.51313 | -36.67609 | 1839 | 851/847 | 851/847 | 860/855 | P |
| 90191 | 66.58918 | +3.62342 | 190.90892 | -29.77810 | 2086 | 979/973 | 979/973 | 979/974 | P |
| 90400* | 74.90247 | -65.73341 | 276.28631 | -35.95631 | 378 | 166/166 | 166/166 | 166/166 | P |
| 90401* | 78.62001 | -71.00065 | 282.10956 | -33.37346 | 432 | 75/75 | 75/75 | 75/75 | P |
| 90013 | 89.28447 | +0.01890 | 206.63167 | -12.04885 | 3515 | 1631/1626 | 1632/1624 | 1631/1624 | P |
| 90402* | 93.56589 | -69.66665 | 279.95935 | -28.52288 | 156 | 196/197 | 196/197 | 196/197 | P |
| 90121 | 97.37444 | -59.65713 | 268.95105 | -25.88052 | 562 | 267/266 | 266/267 | 266/267 | P |
| 90161 | 105.22232 | +48.48935 | 168.28907 | +21.45529 | 2593 | 1170/1171 | 1169/1171 | 1205/1209 | P |
| 90312 | 126.40319 | -39.09847 | 257.57412 | -0.66895 | 3501 | 1655/1651 | 1654/1650 | 1654/1649 | P |
| 92026 | 128.12790 | -1.57084 | 226.54812 | +21.54656 | 2158 | 1019/1019 | 1018/1018 | 1017/1017 | P |
| 90067 | 132.81203 | +11.84773 | 215.63879 | +31.90474 | 3692 | 1698/1706 | 1695/1705 | 1695/1705 | P |
| 90091 | 145.75214 | +59.06160 | 154.88828 | +44.63064 | 789 | 369/369 | 369/369 | 369/369 | P |
| 92397 | 170.45775 | -13.22047 | 271.78770 | +44.16553 | 2585 | 1195/1199 | 1193/1197 | 1193/1197 | P |
| 90217 | 180.44070 | -50.05148 | 294.81518 | +12.03580 | 1687 | 796/795 | 796/794 | 796/795 | P |
| 90266 | 183.61047 | +35.59855 | 163.59937 | +78.43114 | 2776 | 1299/1299 | 1299/1299 | 1305/1305 | P |
| 90860 | 185.41757 | -0.12034 | 287.00945 | +61.82763 | 2452 | 1087/1078 | 1075/1068 | 1075/1066 | P |
| 90867 | 220.24529 | -0.45767 | 351.08190 | +51.86698 | 949 | 453/447 | 453/446 | 453/446 | P |
| 90273 | 224.21932 | -44.81900 | 325.15505 | +12.57220 | 1780 | 832/841 | 832/840 | 832/841 | P |
| 90272 | 224.64303 | +37.14173 | 61.47581 | +61.44777 | 1973 | 898/901 | 898/901 | 923/926 | P |
| 90868 | 225.11368 | -0.65787 | 356.36663 | +48.36291 | 2186 | 1029/1027 | 1029/1027 | 1029/1027 | P |
| 90565 | 246.68168 | +5.87185 | 20.52082 | +34.69775 | 3396 | 1545/1551 | 1545/1550 | 1588/1593 | P |
| 90009 | 246.80780 | -24.68901 | 352.96954 | +16.58465 | 1582 | 749/752 | 749/752 | 748/752 | P |
| 90330 | 247.89420 | +30.14552 | 50.25044 | +42.07085 | 1192 | 564/564 | 564/564 | 564/564 | P |
| 90279 | 267.09736 | -45.42783 | 346.06515 | -8.92593 | 977 | 461/464 | 462/464 | 461/464 | P |
| 90182 | 279.89627 | +49.09363 | 78.07393 | +22.00907 | 1703 | 728/728 | 727/729 | 755/755 | P |
| 90547 | 282.82780 | -4.27488 | 29.11141 | -1.91959 | 671 | 270/278 | 270/277 | 279/286 | P |
| 90808 | 285.48438 | -4.48794 | 30.12525 | -4.37662 | 1876 | 848/850 | 847/850 | 850/853 | P |
| 90234 | 307.83812 | -49.64775 | 349.60727 | -36.21631 | 2076 | 981/981 | 981/981 | 981/981 | P |
| 90813 | 310.27504 | -5.06339 | 41.33281 | -26.64299 | 1570 | 699/708 | 699/707 | 719/721 | P |
| 92409 | 330.11998 | +20.84962 | 77.72803 | -26.65088 | 1439 | 654/650 | 654/650 | 666/662 | P |
| 92202 | 331.40247 | -11.07477 | 47.13268 | -47.91669 | 2802 | 1318/1318 | 1318/1318 | 1318/1318 | P |
| 90893 | 349.54575 | +0.54857 | 80.12434 | -54.38199 | 2619 | 1200/1199 | 1200/1199 | 1225/1223 | P |
| 90290 | 352.64369 | +38.31591 | 105.94466 | -21.87369 | 1141 | 564/565 | 564/565 | 567/568 | P |
| 90298* | 356.63061 | -74.50079 | 308.68978 | -41.89381 | 108 | 52/52 | 52/52 | 52/52 | P |
Notes to Table 1
- Tile - Calibration Field number. An asterisk denotes
special LMC/SMC calibration tiles.
Clicking on the Tile number will link to a 3-color preview
JPEG image formed from the masked, north-going image stacks.
- ra(J2000) - Average center right ascension of all scans of this Tile (decimal degrees)
- dec(J2000) - Average center declination of all scans of this Tile (decimal degrees)
- glon - Average center galactic longitude of all scans of this Tile (decimal degrees)
- glat - Average center galactic latitude of all scans of this Tile (decimal degrees)
- Nscan - The total number of photometric scans available for stacking
- Image Stack/NJ,NH,NK(N/S) - Number of north-going (N) and
south-going(S) scans used in the final, filtered scan stacks for this Tile,
for each band. The number of scans can differ between bands because of noise
and anomaly filtering differences (see
A7.2.e).
- Properties - Link to a page summarizing properties of
the extracted sources in this field (A7.5).
A brief description of the tabular and graphical contents of the
combined calibration field
summary pages is given in the list below. A more detailed discussion
of the field information and how it demonstrates the performance
achieved by the 6x observations is given in the sections that follow.
Click on the Table or Figure number in the list to go to the
corresponding details in the text.
Combined Calibration Field Summary Page Contents
| Table 1 | Calibration field
centers, boundaries of source extraction area, number of scans combined,
number of sources extracted |
|---|
| Figure 1 | J, H and Ks
extracted source counts from combined calibration images |
|---|
| Figure 2 | Extracted source
photometric uncertainties as a function of magnitude |
|---|
| Figure 3 | Extracted source
1-sigma noise distributions |
|---|
| Figure 4 | Extracted source
color-magnitude diagram |
|---|
| Figure 5 | Extracted source
color-color diagram |
|---|
| Figure 6-8 | Extracted source
J, H and Ks photometric residuals with respect to the
All-Sky PSC |
|---|
| Figure 9-11 | Extracted source
declination residuals with respect to the All-Sky PSC |
|---|
| Figure 12-14 | Extracted source
right ascension residuals with respect to the All-Sky PSC |
|---|
a. General Field Properties
The table at the top of each summary page gives the basic properties
of each calibration field and the combined images:
- Central position of field in equatorial (J2000) and galactic
coordinates.
- Equatorial coordinates of the corners of the region from which
sources were extracted for each field. These correspond to the area
that is covered by at least 30% of all available scans of the field.
- Number of scans that were combined to form the
north- and south-going
combined images. Not all available scans of each field were
used in the final combined images, so the sum of the north- and south-going
scans used in each band is generally less than the total number of
scans, Nscn, shown in Table 1 above. Scans with images
that contained anomalies such as high noise levels or particularly
bad seeing conditions were identified
and omitted from the final image combination.
- Total number of entries in the extracted
source tables for each field. This number includes extractions that are
flagged as possible artifacts.
Flagged artifacts comprise on average 2-3% of the
extractions in each field.
b. Image Characteristics
Clicking on the tile number in Table 1 above or in the field summary pages
will display a 3-color image formed from the J, H and Ks
images of the combined north-going scans of each field that
are masked to the 30% coverage area.
The combined J-band images are mapped into blue, H-band into green and
Ks-band into red to make the 3-color images.
- Relative depth - The relative depth achieved
in the different fields is a function primarily of the number of scans
combined, which is tabulated in Table 1. The achieved sensitivity
is tempered by confusion,
which can be significant in the fields located near the Galactic Plane
such as
90312,
90279,
90547, and
90808.
As discussed in A7.2.f, the effective
depth also varies within the individual combined images because of
the RA cross-stepping performed during calibration observation, and
because of small telescope
pointing differences. Depth-of-coverage maps are provided for each
of the images to help account for this non-uniformity.
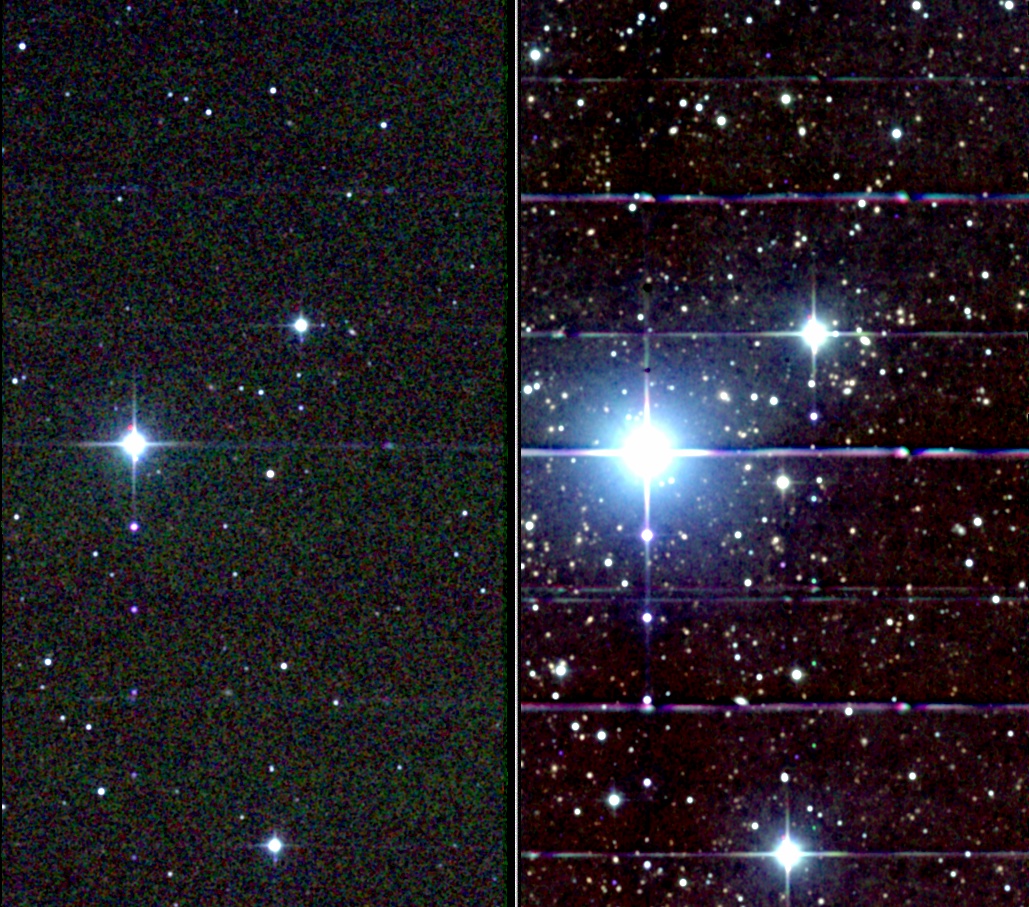
- Artifacts -
Artifacts
due to bright stars are prominent in all of the combined images.
The image combination process reduces sky background photon noise
by factors of 25-60 relative to the level in single scan images.
As a result, latent images, optical and electronic ghosts,
and residuals in instrumental calibration frames (i.e.
sky offset corrections) are
accentuated in the combined
images, and faint artifacts that were well below the detection
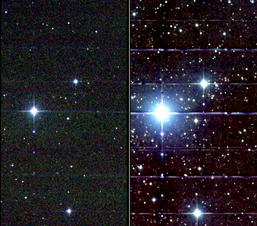
limit in the single scan images become visible. This is illustrated
in Figure 1 in which a single scan and the combined north-going image
of the same section of the 92397 calibration field are
compared.
- Residual Bacgkround Structure
Most of the deep, combined images exhibit a low spatial frequency
gradient in the background levels that is due to residual
atmospheric OH airglow emission. The airglow emission
can be very prominent in the individual scan images, particularly
in the H-band, and varies both spatially and temporally
on all scales. Combining hundreds to thousands of
individual scan images suppresses the emission level, but does not
completely eliminate it.
The images of fields that contain bright stars also show
background structure due the residual presence of the stars
in the sky offset corrections
in the individual scan images. These illumination corrections
were formed by creating  -trimmed averages
of all 42 dark-subtracted, flat-fielded frames in each calibration scan.
Very bright stars in the images were not perfectly removed by
the trimmed averaging, and their residual images left negative imprints
in the sky frames when the offsets were subtracted. These
residuals are normally well below the detection limit in the individual
scan images, and did not adversely effect photometry in the main
survey and calibration scans. However, they are prominent
in many of the deep, combined images (e.g. see
90021) because of
the suppression of the sky photon noise.
-trimmed averages
of all 42 dark-subtracted, flat-fielded frames in each calibration scan.
Very bright stars in the images were not perfectly removed by
the trimmed averaging, and their residual images left negative imprints
in the sky frames when the offsets were subtracted. These
residuals are normally well below the detection limit in the individual
scan images, and did not adversely effect photometry in the main
survey and calibration scans. However, they are prominent
in many of the deep, combined images (e.g. see
90021) because of
the suppression of the sky photon noise.
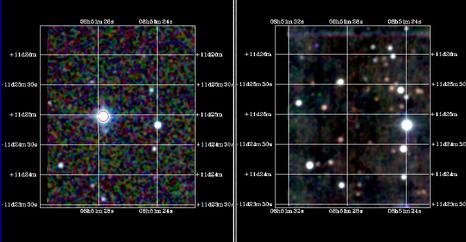
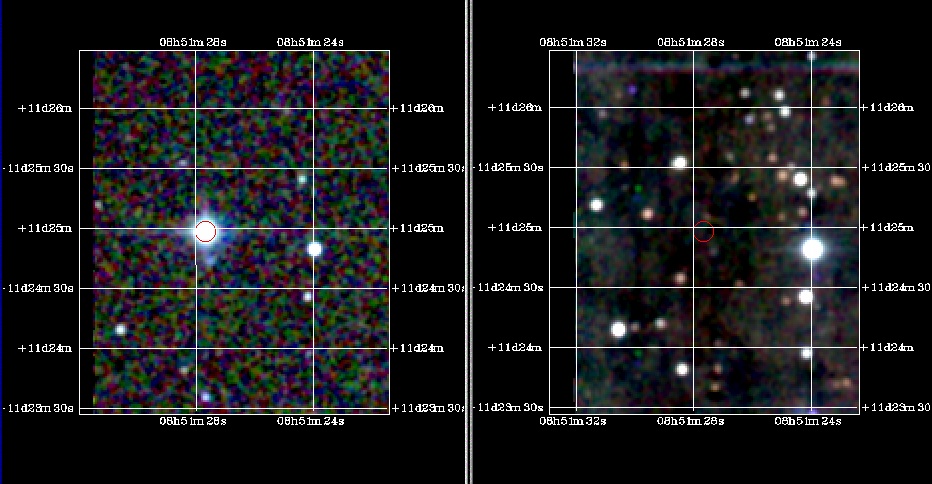
- Transients - Transient events, such as cosmic
ray strikes, meteor trails and fast moving sources such as asteroids
are effectively suppressed by the image filtering and combination
process, as described in A7.2.
Examples of the process used to identify and filter anomalies
in individual scans are described in
A7.2.e. Figure 2 below
illustrates how averaging together hundreds to thousands
of images eliminates bright moving sources such as the
asteroid (7) Iris which appears in six of the 3692 scans
of the 90067 calibration field.
 |
 |
| Figure 1 - J, H, Ks three-color images of
the central region of the 92397
calibration field. (left)
from a single scan, (right) from the combination of
all north-going scans). |
Figure 2 - (left) J, H Ks 3-color image of
a section from a single scan of the 90067 calibration field taken
on 04/30/2000 UT, showing the bright asteroid (7) Iris.
(right) Image of the same region in the combined north-going
scans of the 90067 field showing the absence of any signature of
the asteroid. |
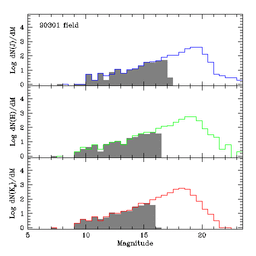
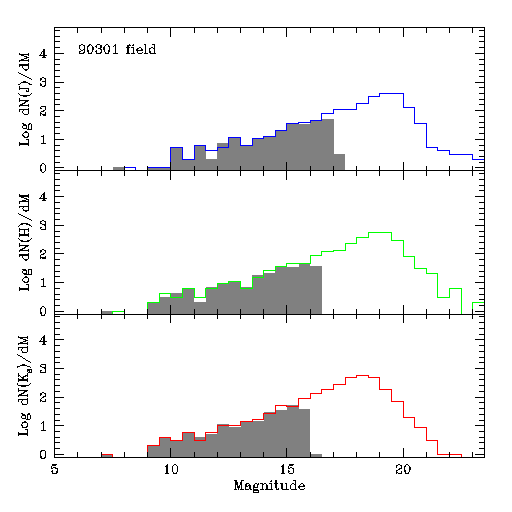
c. Source Counts and Achieved Sensitivity
Figures 1, 2 and 3 in each of the combined calibration field
detailed property pages present the J, H and Ks distributions
of differential source counts, photometric uncertainties in magnitudes
and histograms of source uncertainties in flux units
as a function of source brightness. Examples of these
diagrams for the 90301 (b=-55.5°) and 90312
(b=-0.7°) calibration fields are shown in Figure 3 through 8
below. Similar numbers of scans were combined for these two
fields (1627 and 1655, respectively). However, they
represent two extremes of source surface density
sampled by the calibration fields, so the illustrate
the impact of confusion on the achieved sensitivity and
measurements statistics in the extracted source lists.
- Source Counts
Differential J, H and Ks source counts
as a function of source magnitude are presented in the first
figure in the field property pages.
These figures also show the source counts from the 2MASS All-Sky PSC
in the same region for comparison. The relative position
of the turnover in the count distributions indicates the relative
sensitivity gain over the single epoch measurements.
The 90301 field counts shown in Figure 3 reach approximately 4 mag
fainter than the main survey limits, as expected from the sqrt(Nscans)
improvement. However, counts in the 90312 field shown in Figure 4
reach only ~1.5-2 mags fainter than the survey because of the limitation
of confusion noise.
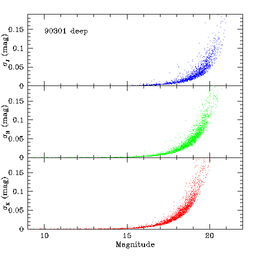
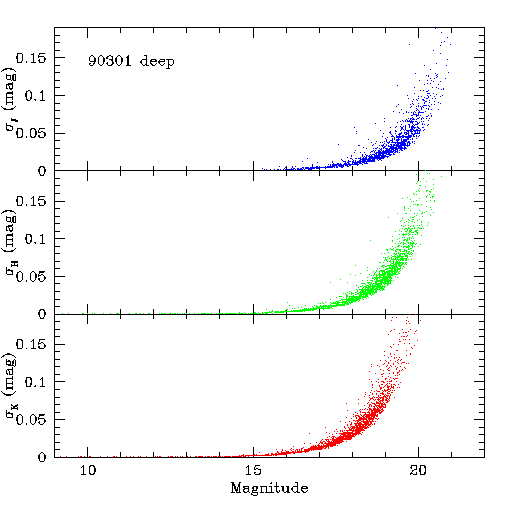
- Photometric Uncertainties
The second figure in each of the detailed field property pages
shows the distribution of J, H and Ks photometric
measurement uncertainties as a function of source magnitude.
The characteristic brightness at which SNR=10
(=0.1086 mag)
is achieved from the simple aperture photometry
measurements can be read from these figures.
In the 90301 field, the characteristic SNR=10 level is at J=20.3, H=19.6,
Ks=19.1 mag (Figure 5 below). This is approximately four
magnitudes fainter than the average SNR=10 levels
([jhk]_msnr10)
for all of the individual scans of the 90301 field,
J=16.4, H=15.5 and Ks=14.8 mag,
consistent with the gain expected from combining 1627 scans.
The characteristic magnitude for SNR=10 in the sources
extracted from the combined images of the 90312 field
are J=18.6, H=18.0, Ks=17.5 mag (Figure 6 below). This is
only ~2.5 mag fainter than the mean SNR=10 value in the individual
scans of this field (J=16.3, H=15.5 and Ks=14.7),
emphasizing the limiting impact of confusion noise on
the aperture photometry in high source density fields.
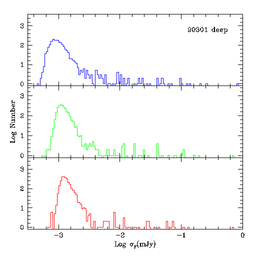
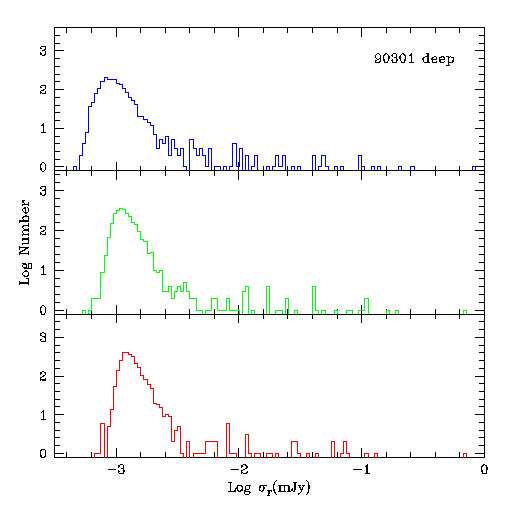
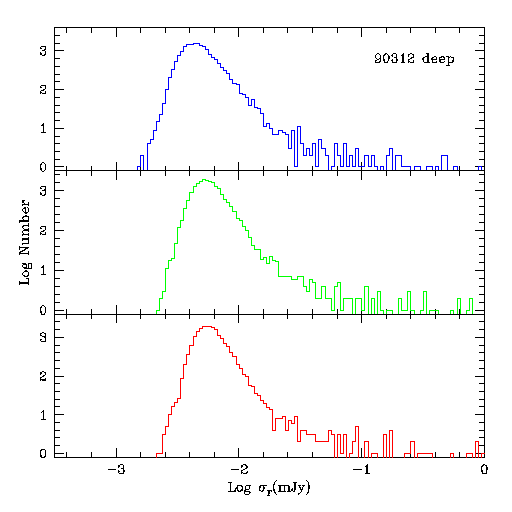
- Noise Histograms
The third figure in the individual field properties
pages shows histograms of the J, H and Ks
source measurement noise, in flux units. The peaks
of these distributions given the characteristic
source measurement noise values that is
analogous to the "point source noise" computed
for each survey scan that is listed in the
[jhk]_msnr10
columns of the Survey Scan Information Table.
Figures 7 and 8 below compare the noise histograms for the
90301 and 90312 fields, illustrating the elevated noise
due to confusion in the high density field.
 |
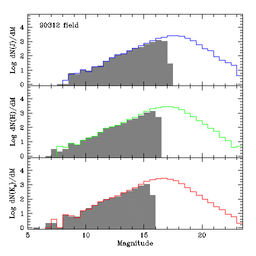 |
| Figure 3 - 90301 calibration field (l,b=245.6°,-55.5°) |
Figure 4 - 90312 calibration field (l,b=257.6°,-0.7°) |
| J, H and Ks source counts
from the combined images of two calibration fields. All-Sky PSC source
counts in the same approximate areas of sky are shown in the shaded
regions. |
 |
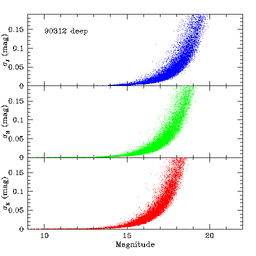 |
| Figure 5 - 90301 calibration field |
Figure 6 - 90312 calibration field |
| Photometric measurement uncertainty vs. magnitude for
sources extracted from two combined calibration field images. |
|
 |
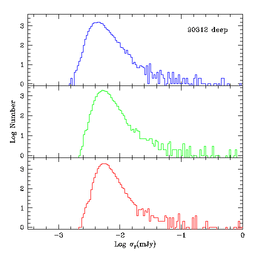 |
| Figure 7 - 90301 calibration field |
Figure 8 - 90312 calibration field |
| Histogram of extracted source measurement noise (in flux units)
as a function of source flux in two combined calibration fields. |
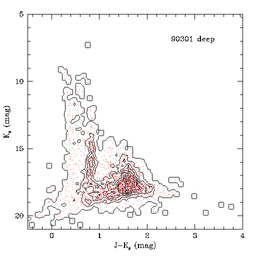
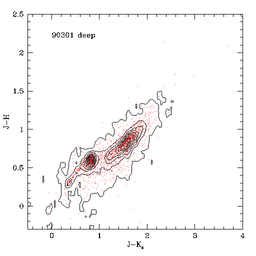
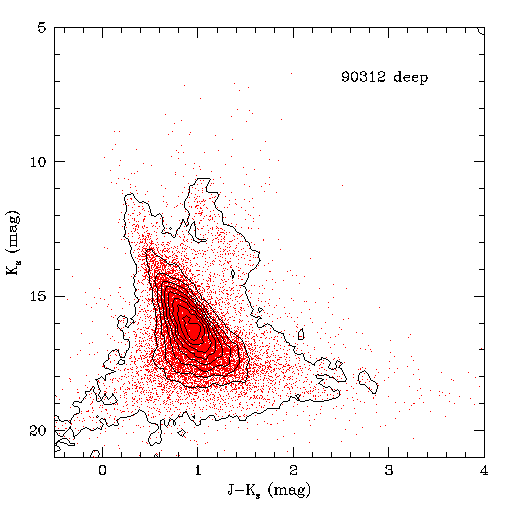
The relative, band-to-band photometric performance in the
combined calibration scan measurements is illustrated by the
color-magnitude and color-color diagrams shown in the fourth and fifth
figures in each field summary page. Examples of these
diagrams for the 90301 and 90312 fields are shown in Figures 9-12 below.
90301 is located at high galactic latitude (b=-55.5°) and
is free from foreground extinction.
The sources detected in this field are a mixture of predominantly dwarf stars
which comprise the vertical ridge of points at
J-Ks~0.7-0.8 mag in the color-magnitude diagram, and
faint, red galaxies with Ks>15 mag
and J-Ks>1 mag. The main sequence is visible in the
lower left of the color-color diagram in Figure 11, with
a concentration corresponding to the location of late-K and early-M dwarfs near
J-Ks~0.8 mag and J-H~0.6 mag. Most of the faint galaxies
detected in this field are below the sensitivity limit of the main
2MASS survey, but they dominate the number counts in the combined
calibration images for Ks>16 mag. They
form the diagonal ridge in the center of the color-color diagram,
and may include objects with redshifts up to z~0.7-0.9.
By contrast, most sources detected in the combined images of the
90312 calibration field, which lies on the Galactic plane,
are dwarf and giant stars. The locus of
points in the color-color diagram of 90312 is
elongated in the direction of the reddening vector, indicating
the presence of considerable foreground extinction. There
are few if any galaxies detected in this field.
 |
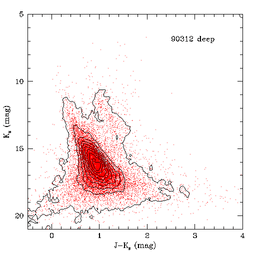 |
| Figure 9 - 90301 calibration field |
Figure 10 - 90312 calibration field |
| Color-magnitude diagrams for the 90301 and 90312 combined calibration
field extracted source lists. Red points denote individual sources
and the contours trace the density of points. |
 |
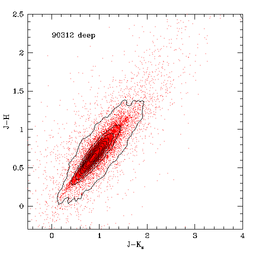 |
| Figure 11 - 90301 calibration field |
Figure 12 - 90312 calibration field |
| Color-color diagrams for the 90301 and 90312 combined calibration
field extracted source lists. Red points denote individual sources
and the contours trace the density of points. |
The sixth, seventh and eighth diagrams in the detailed field
summary pages show the differences between J, H and Ks
photometry from the All-Sky PSC and source photometry extracted
from the combined calibration fields plotted as a function of brightness in
the combined calibration fields. Examples of the photometric
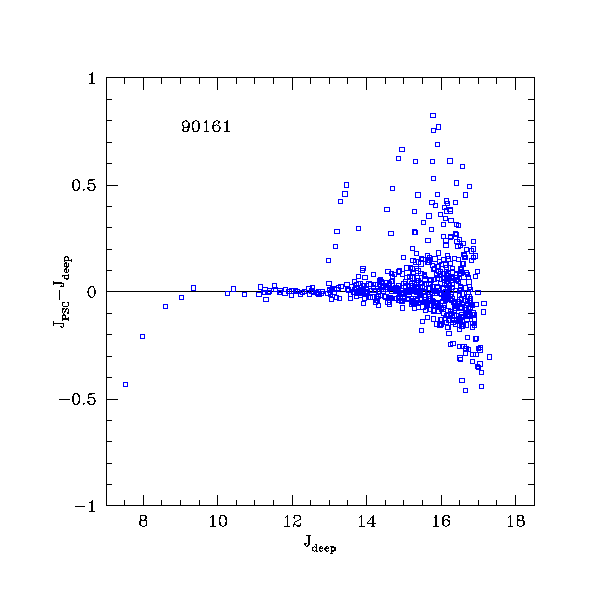
residual plots for the 90161 calibration field are shown below
in Figures 13-15. There is little net photometric offset
over most of the brightness range because the combined calibration
source photometry was calibrated using the survey calibration stars in each
field. The photometry of bright sources that saturate
the 1.3 s READ2-READ1 exposures from
which the Atlas Images are formed is systematically too faint in the
combined calibration data relative to the PSC. PSC photometry for
bright objects is drawn from the non-saturated 51 ms exposures.
A similar bias is visible for the faintest sources, but in this case the
PSC reports brighter magnitudes because of
statistical
flux overestimation for low SNR detections.
 |
 |
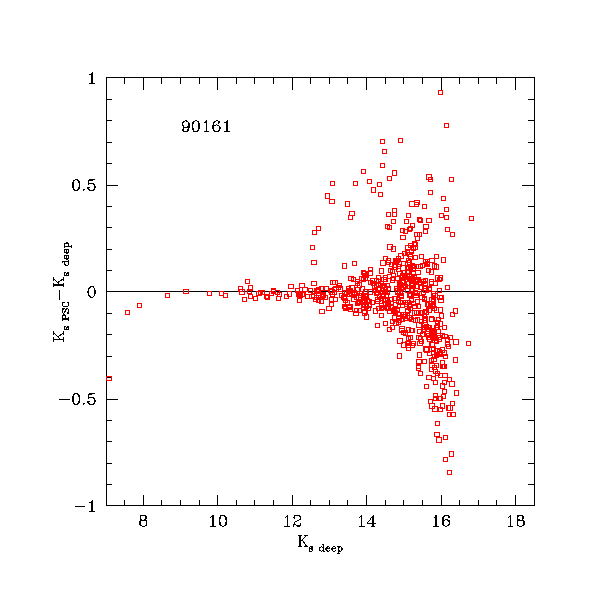 |
| Figure 13 | Figure 14 | Figure 15 |
| Difference between All-Sky PSC and combined calibration
source list photometry for objects in the 90161 field. (left) J-band, (center)
H-band, (right) Ks-band. |
Figures 9-11 in the detailed field summary pages show the declination
residuals between astrometry in the 2MASS All-Sky PSC
and the same sources measured in the combined calibration fields.
Figure 9 shows the declination offsets as function of declination,
Figure 10 shows the offsets as a function of RA, and Figure 11
shows a histogram of offsets. Figures 12-14 in each field
summary page show the equivalent plots for the RA residuals.
Position reconstruction for the
calibration scan data used
USNO-A2.0
as the primary astrometric reference catalog, rather than the
Tycho-2 Catalog
that was used as the reference for the main survey.
Because of small systematic astrometric differences between those two
catalogs, the resulting calibration scan astrometry
has systematic biases with respect to the main survey.
The mean position offset between the calibration
scan and survey Atlas images was at least partially
corrected during the
image combination process by determining the average offsets
between sources extracted from the individual calibration
scans and their counterparts in the All-Sky PSC, and then
applying those offsets to each calibration scan image before
final combination.
However, this procedure did not remove right ascension or declination offset
structure within each scan. An example of this remaining
structure can be seen in Figure 16 below which shows the
declination residuals for the 90161 field.
The largest remaining astrometric residuals occur in the combined calibration
image and source lists from the 90004 field, as shown in Figure 17 below.
Because of the large "raw" astrometric offsets with respect to the
All-Sky PSC in this field, many of the positional correlations
between the individual scan extractions that were needed to measure
the offsets were missed. This resulted in an undercorrection of the
mean offsets.
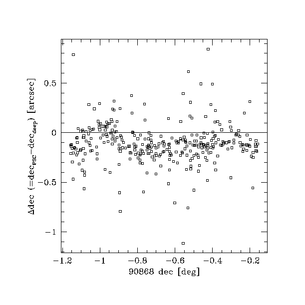 |
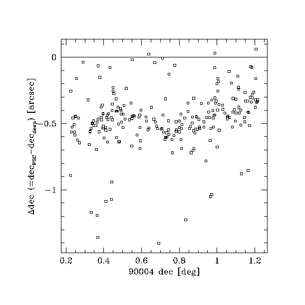 |
| Figure 16 - 90868 calibration field |
Figure 17 - 90004 calibration field |
| Source declination residuals between the All-Sky PSC and
the combined calibration scan images plotted as a function of
declination for two different fields. |
[Last Updated: 2008 February 18; by R. Cutri]
Previous page.
Return to Explanatory Supplement TOC Page.


