 ~0.02 DN.
For higher density fields (e.g. 90547)
the detection SNR threshold was effectively higher being dominated by
noise due to source confusion.
~0.02 DN.
For higher density fields (e.g. 90547)
the detection SNR threshold was effectively higher being dominated by
noise due to source confusion.
Source lists extracted from the combined calibration scan images from each field using conservative detection thresholds and simple aperture photometry are distributed as part of the 2MASS Extended Mission products. Because of source crowding, the large number of resolved galaxies, and the sometimes complex background structure, it is anticipated that most users will wish to perform their own custom profile- or template-fitting to extract optimal photometric measurements of sources in the combined calibration scan images. Consequently, the source lists provided here are not intended to be definitive. In particular, they do not probe to the full depth of the combined images, and photometric accuracy is limited for low SNR, confused or resolved sources by the simple aperture photometry employed. Instead, combined calibration scan source lists provide a convenient albeit conservative view of the properties of the faint source populations such as source counts and color distributions. In addition, the procedure used to construct the extracted source lists, described below, illustrates how photometric and astrometric calibration and artifact identification can be carried out when running custom source extractions.
The format of the extracted source tables is described in A7.3.d. The source lists for each calibration field can be retrieved using the on-line ftp interface in A7.4. Section A7.5 contains a summary of the general characteristics of the source lists from each field, including source count curves, noise distributions, color-magnitude and color-color diagrams, and photometric and astrometric comparisons with the 2MASS PSC.
i. Source Detection
Source extraction was performed on the masked, north- and south-going combined J, H and Ks images independently. Extractions were required to be detected in both directions to mitigate against random detections of noise and artifacts and bright source latent image artifacts (see IV.7). J, H and Ks detections in each scan direction were first positionally bandmerged, and then the bandmerged positions and fluxes measured from the two scan directions were combined and output in the final source lists. The masked images were utilized for source extraction to minimize the detection bias arising from the coverage drop-off at the east and west image edges of the images. The approximate coordinate boundaries covered by source extractions for each field are given in A7.5.
Source detection and aperture photometry used the DAOFIND and PHOT
algorithms within IRAF/DAOPHOT
(Stetson 1987, PASP, 99, 191).
(IRAF [Image Reduction and Analysis Facility] is distributed by the
National Optical Astronomy Observatories, which are operated by the Association
of Universities for Research in Astronomy, Inc., under cooperative agreement
with the National Science Foundation).
The Gaussian profile of the local density maxima in DAOFIND was
selected to be circular with a
full-width half-maxima of FWHM=3.0 image pixels (1"/pix).
The detection threshold for low density fields was typically ~0.1 DN in
each band, allowing detection of sources fairly conservatively at
signal-to-noise ratio SNR~5. Typical background noise levels
for sparse fields were very low relative to the individual
calibration scan data, with ~0.02 DN.
For higher density fields (e.g. 90547)
the detection SNR threshold was effectively higher being dominated by
noise due to source confusion.
The nominal gain (in e-/DN) and readnoise (in e-) for each combined image in each band for each scan direction was assumed to be 8.5 e-/DN*N_scan and sqrt(N_scan)*55 e-, respectively, where N_scan is the number of scans going into each final combined image as listed in Table 1 of A7.1a.
ii. Aperture Photometry
The brightness of each detected source was measured within a
4´´ circular aperture relative to the local background
in an annulus with an inner radius of 24.0´´ and outer radius
of 30.0´´. These are the same as the
"standard aperture" and sky annulus that
were used for point source aperture photometry in 2MASS pipeline data
reduction. It should be
noted that
the default sky fitting algorithm in DAOPHOT is the mode, which
differs from the 2MAPPS algorithm, which used a
-trimmed median. We show in
A7.5 that the resulting photometric uncertainty
estimation in each band for each field agrees well with that for corresponding
sources in the All-Sky Point Source Catalog over the appropriate brightness
regime.
The initial photometric zeropoint for the photometry was the value of the
MAGZP keyword in the header of each combined image. These values were
20.93, 20.67, and 20.03 mag for J, H, and Ks, respectively, for
all fields).
iii. Bandmerging and Confirmation
The DAOPHOT output from the J, H and Ks images in each direction were bandmerged using the routines in IRAF/PHOTCAL and a 1 pixel (i.e. 1´´) positional tolerance for extracted sources between bands. The adopted (X,Y) position for a source was established by weighting the (X,Y) centroid position of the source in each band by the inverse variance of its flux measurement.
The bandmerged source lists for each scanning direction were then cross-correlated, using a simple position matching algorithm with a tolerance of 0.5 pixel. As mentioned above, this cross-referencing removed many of the random noise extractions and theoretically all latent images artifacts detected in each of the two scanning directions. The positions, magnitudes, and photometric uncertainties for each source in the cross-referenced list were then merged. The simple mean and the standard deviation of the pixel (X,Y) positions for a source in each scan direction were computed and assigned to the merged source. For sources with valid flux measurements in a band in both scan directions, the two measurements were combined using an inverse-flux variance weighted average. The merged source flux uncertainty in this case was formed from the Gaussian-reduction of the individual uncertainties. If a source was detected in only one direction in a given band, then the single flux measurement and uncertainty were assigned to the merged source in that band. This occurred primarily for low SNR extractions.
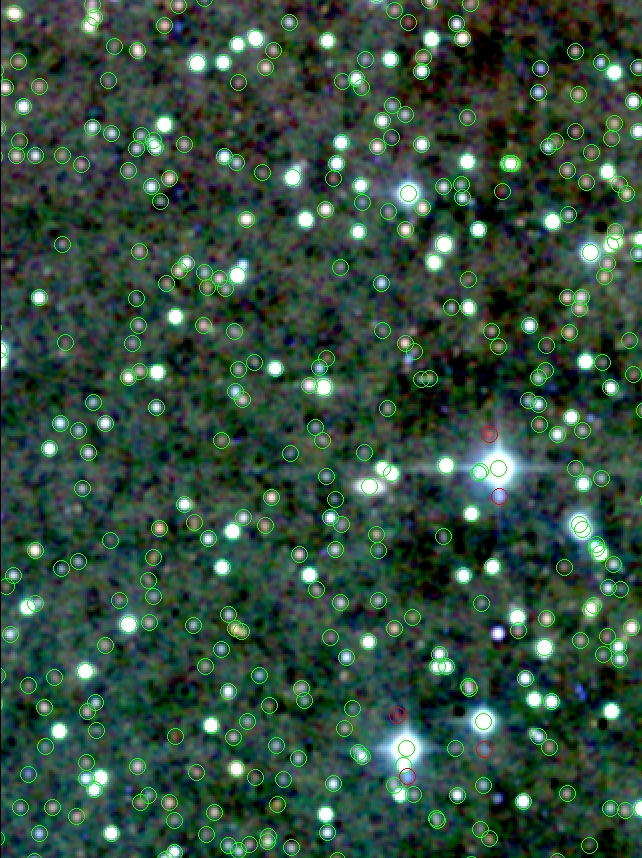
A section of the combined north-going scan images for the 90161 calibration field (l,b = 168.3°, +21.5°) is shown in Figure 1. Circles are overlayed on the 3-color image at the location of the confirming sources included in the extracted source list. The diameter of the circles is 8", the size used for the DAOPHOT photometry. Sources denoted with red circles are identified as likely artifacts in the source lists (see below). Note that conservative detection thresholds do not necessarily capture the faintest objects in the image. The J, H and Ks source count curves for 90161 field shown in Figure 2 turnover approximately 3.8 magnitudes fainter than the completeness limit of the All-Sky PSC, consistent with the gain expected from the 1170-1200 north-going scans combined.
 |
 |
| Figure 1 - J, H, Ks 3-color image showing a section of the combined north-going image of the 90161 calibration field. 8" diameter circles denote the location of sources in the extracted source list for this field. Red circles indicate sources flagged as possible artifact detections. | Figure 2 - J, H and Ks source counts from the 90161 combined calibration field extracted source list. |
i. Astrometric Calibration
The (X,Y) positions and positional uncertainties of merged sources were transformed to equatorial coordinates (ra, dec) using the WCS keyword information in the image headers (CTYPE1, CTYPE2, CRPIX1, CRPIX2, CRVAL1, CRVAL2, CROTA2, CDELT1, CDELT2, EQUINOX). The combined calibration images retain the tangent projections of the individual Atlas Images from which they were formed. The equatorial positions and uncertainties are carried in the ra, dec, dra, and ddec columns of the final source lists.
The individual calibration scan images from which the combined calibration scan images were formed contained position offsets with respect to the main 2MASS survey because position reconstruction for the calibration data used USNOA-2 as the primary astrometric reference catalog rather than Tycho-2 that was used for main survey data. As discussed in A7.2.b, a mean positional bias on each axis was removed during the calibration scan image combination procedure. However, because offset structure within individual scans could not be removed, residual offsets remain in the images, and consequently in the positions of extracted sources. The residual position errors with respect to the PSC reference frame are generally <0.5", as illustrated in Figure 3 which shows the offsets for the 90234 calibration field. The largest residual biases are found in the 90004 field, as shown in Figure 4. The individual calibrations scans of this field had the largest "raw" offsets with respect to the PSC which led to an underestimate of the bias during the position correction phase of the image combination.
Because of the residual position offsets, users should always defer to the position of sources reported in the 2MASS PSC, when available. For sources fainter than survey detection limit, improved astrometry can be achieved by computing mean position corrections using nearby brighter sources with PSC counterparts.
 |
 |
| Figure 3 - Differences between RA (left) and declination (right) of sources reported in the 2MASS PSC and the 90234 combined calibration field source list plotted as a function of declination. | |
 |
 |
| Figure 4 - Differences between RA (left) and declination (right) of sources reported in the 2MASS PSC and the 90004 combined calibration field source list plotted as a function of declination. | |
ii. Photometric Calibration
The final calibrated, corrected magnitudes given in the j_m, h_m, k_m columns in the combined calibration scan source lists are equal to:
where MAGZP is the photometric zero point given in the FITS header, DNDAOPHOT is the background-subtracted count level measured by DAOPHOT within the 4" aperture, and dmcorr is the aperture correction given in Table 1, described below.
Basic photometric calibration of the DAOPHOT source photometry was done using the zeropoint magnitudes (MAGZP) carried in the header of each combined calibration scan image. Recall that the J, H and Ks images for each field were normalized to the same photometric scale during the image combination process (A7.2.c), and thus the MAGZP values are the same for all fields (20.93, 20.67 and 20.03 mag in J, H and Ks, respectively).
The 4" aperture measurements systematically underestimate the total flux of sources because light in the wings of star images falls outside of the circular aperture. In the main survey data reduction pipeline, light loss outside the standard aperture was compensated for using a seeing-dependent aperture curve-of-growth correction. For the combined calibration scans, we corrected DAOPHOT photometry by simply normalizing to the a priori photometry of the primary and secondary standard stars in each field, given in Table 2 of III.2.d. This was done by subtracting from the DAOPHOT magnitudes a correction equal to the average difference between the a priori and initial DAOPHOT magnitudes of the standard stars, in each field. The mean and standard deviation of the J, H and Ks correction factors, in magnitudes, are listed for each field in Table 1. Normalizing to the a priori standard star magnitudes is preferable to using the more numerous PSC sources because the standard star magnitudes were generated using data from the entire survey, whereas PSC sources covering a calibration field are usually from only one or two survey scans that may be susceptible to photometric small biases.
The photometry given in the combined calibration scan source lists
accurately represents the flux for isolated point sources.
However, the brightness of extended sources and those in close proximity
to other objects (of which there are many in the deep, combined images),
will typically be underestimated.
Users are recommended to perform their own point source profile or
elliptical template fitting to obtain more accurate measurements for
extended and/or confused objects. General photometric
properties of the combined calibration scan source lists
are described in A7.5.
| Field | J corr | J corr |
H corr | H corr |
Ks corr | Ks corr |
|---|---|---|---|---|---|---|
| 90004 | 0.058 | 0.011 | 0.062 | 0.008 | 0.058 | 0.009 |
| 90009 | 0.043 | 0.015 | 0.045 | 0.004 | 0.047 | 0.007 |
| 90013 | 0.056 | 0.011 | 0.057 | 0.010 | 0.056 | 0.011 |
| 90021 | 0.056 | 0.012 | 0.058 | 0.008 | 0.058 | 0.010 |
| 90067 | 0.051 | 0.011 | 0.053 | 0.008 | 0.051 | 0.010 |
| 90091 | 0.063 | 0.006 | 0.070 | 0.010 | 0.064 | 0.009 |
| 90121 | 0.046 | 0.013 | 0.051 | 0.008 | 0.052 | 0.010 |
| 90161 | 0.059 | 0.011 | 0.064 | 0.010 | 0.057 | 0.012 |
| 90182 | 0.058 | 0.008 | 0.065 | 0.007 | 0.061 | 0.007 |
| 90191 | 0.056 | 0.009 | 0.058 | 0.009 | 0.056 | 0.010 |
| 90217 | 0.043 | 0.014 | 0.045 | 0.006 | 0.049 | 0.010 |
| 90234 | 0.051 | 0.011 | 0.055 | 0.007 | 0.055 | 0.008 |
| 90247 | 0.056 | 0.010 | 0.061 | 0.009 | 0.053 | 0.009 |
| 90266 | 0.060 | 0.010 | 0.065 | 0.010 | 0.061 | 0.010 |
| 90272 | 0.056 | 0.009 | 0.063 | 0.006 | 0.058 | 0.007 |
| 90273 | 0.045 | 0.013 | 0.046 | 0.009 | 0.049 | 0.008 |
| 90279 | 0.047 | 0.016 | 0.051 | 0.012 | 0.051 | 0.013 |
| 90290 | 0.064 | 0.009 | 0.067 | 0.006 | 0.060 | 0.006 |
| 90294 | 0.051 | 0.023 | 0.053 | 0.031 | 0.056 | 0.027 |
| 90301 | 0.047 | 0.014 | 0.050 | 0.011 | 0.053 | 0.011 |
| 90312 | 0.040 | 0.014 | 0.044 | 0.007 | 0.045 | 0.010 |
| 90330 | 0.058 | 0.008 | 0.063 | 0.008 | 0.055 | 0.008 |
| 90533 | 0.066 | 0.013 | 0.066 | 0.012 | 0.062 | 0.013 |
| 90547 | 0.041 | 0.016 | 0.049 | 0.012 | 0.048 | 0.014 |
| 90565 | 0.060 | 0.013 | 0.065 | 0.010 | 0.063 | 0.010 |
| 90808 | 0.053 | 0.004 | 0.058 | 0.002 | 0.054 | 0.005 |
| 90813 | 0.057 | 0.010 | 0.062 | 0.006 | 0.060 | 0.008 |
| 90860 | 0.049 | 0.011 | 0.053 | 0.011 | 0.053 | 0.011 |
| 90867 | 0.057 | 0.011 | 0.060 | 0.008 | 0.059 | 0.009 |
| 90868 | 0.058 | 0.009 | 0.061 | 0.006 | 0.061 | 0.008 |
| 90893 | 0.057 | 0.010 | 0.058 | 0.009 | 0.058 | 0.009 |
| 92026 | 0.058 | 0.010 | 0.057 | 0.009 | 0.058 | 0.010 |
| 92202 | 0.054 | 0.006 | 0.058 | 0.006 | 0.057 | 0.008 |
| 92397 | 0.049 | 0.010 | 0.050 | 0.010 | 0.054 | 0.009 |
| 92409 | 0.054 | 0.010 | 0.058 | 0.008 | 0.054 | 0.009 |
Filtering and identification of spurious detections of artifacts in the combined calibration scan extracted source lists was done in two steps. The first step filtered artifacts out of the final source lists by requiring that sources be detected on both the north- and south-going combined images. This naturally excluded most scan direction-dependent artifacts such as latent images, and many random detections on diffraction spikes and bright star halos, as well as low signal-to-noise noise events.
Artifact detections not removed by the north-south confirmation were identified and flagged in the combined calibration scan source lists in the second step. The source lists contain a last column, cc_flg, that is a flag indicating whether or not the source is likely an artifact. The flagged artifacts include dichroic glints (cc_flg="G"), which were identified using the glint mappings from the main survey data reduction pipeline (see II.4b and IV.7). The position of glint artifacts were generated from "seed" stars in the combined calibration scan source lists which have [jhk]_m < 13 in a low-density scan, [jhk]_m < 11, and [jhk]_m < 9 in high-density scans. The remaining artifacts were identified by eye, using the list of single-band detections as a guide. These artifacts include the residual latent image artifacts (cc_flg="P") that escaped the filtering by the north- and south-going scan confirmation. Also included are those sources which are either part of a bright star diffraction spike or occurred along a spike, to the effect that their photometric and astrometric accuracies are likely compromised by the presence of the spike; these have cc_flg="D". Finally, those sources which do not clearly fall into one of the above categories but visually appear to be artifacts are marked cc_flg="A". An example of this are erroneous sources detected across the saturated profile of an extremely bright star. Examples of artifacts flagged in the extracted source list in the 90161 calibration field are shown in Figure 1.
CAUTION: The combined calibration scan extracted source lists have not been as thoroughly vetted for spurious detections as the 2MASS Survey, 6x or Calibration Scan Point Source Working Databases. It is very likely that you will find unflagged artifacts in these tables. In particular, single-band detections should always be viewed with suspicion. We strongly recommend that you review the images to verify the nature of sources in these tables.
[Last Updated: 2006 October 9; by S. Van Dyk and R. Cutri]