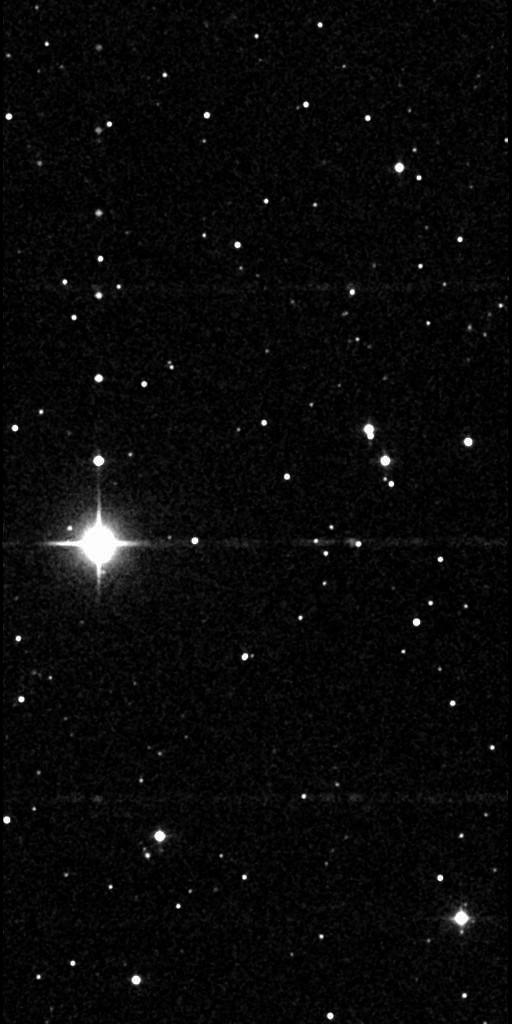

One of the primary sources of unreliability of 2MASS detections is confusion with artifacts produced by bright stars. These artifacts include familiar optical effects such as diffraction spikes, ghost images, and filter and dichroic glints, as well as features unique to the NICMOS3 detectors used by 2MASS such as latent images and "stripes" (see below).
The following J-Band Atlas Image from the northern night of 1997 Nov 16 UT (Figure 1), contains the bright star 2MASS J02450919+2851242 (= HD17054; J~5.8, H~5.1, Ks~5.0 mag). Figure 2 shows the same image with source detections in a "blinking" (or "animated") overlay. "Sources" associated with artifacts from this star and others are marked with squares. Note that these artifacts are not included in the Point Source Catalog. The color coding of the squares is as follows:
The PSC sources in the image are marked with circles. Green circles are "clean" detections, not influenced by any artifacts. Yellow circles are sources believed to be real, but which may have position and brightness measurements affected because of proximity to artifacts. The yellow circles also have artifact boxes within them to indicate the nature of the offending artifact.
|
|
|
| Figure 1 | Figure 2 |
During pipeline processing for each 2MASS Tile, artifacts are identified in the extracted source lists by searching for detections that have the correct positional and brightness relationship to bright stars. All sources, true and artifact, are output to the Working Source Databases, but artifacts are flagged therein. Detections that are highly probable artifacts are not included in the final release Catalogs for 2MASS. Sources which are believed to be real objects on the sky, but may have positional or brightness measurements affected by nearby artifacts are flagged in the appropriate bands with the "cc_flg" (confusion and contamination flag) in the PSC. Users are urged to pay attention to the values in this flag.
The possible values of this three character flag, one character per band [JHKs], the conditions they indicate, and the number of sources in each band having those cc_flg values in the PSC are summarized in Table 1 below. Sources that are affected by more than one of the contamination conditions have cc_flg set in the priority shown by the order of the values in the table. For example, a source that is identified as both contaminated by proximity to a latent image and a diffraction spike from a nearby bright star will have cc_flg="p" in the affected bands.
|
|
||||
|---|---|---|---|---|
|
|
Source is unaffected by artifacts, or source not detected in that band | 375059297 | 389911797 | 410775947 |
|
|
Persistence (Latent) Image from Bright Star | 2438794 | 3919008 | 1550140 |
|
|
Confusion with nearby brighter source | 90679500 | 73584699 | 54196294 |
|
|
Nearby Diffraction Spike | 133283 | 563982 | 707105 |
|
|
Horizontal "Stripe" due to Bright Star | 2667409 | 2995595 | 3740717 |
|
|
Confusion in Bandmerging | 14687 | 17889 | 22767 |
The variable mpar in this subsection is defined as the parent source's magnitude in a specific band. The artifact identification algorithms and positional parameters work in the universal(U)-scan coordinate system, which is in arcsec and independent of band. In this system, (xpar ,ypar) is the position of the parent source in the U-scan coordinates for the scan. The y-axis of the U-scan system is parallel to the telescope scan direction, pointing in a northward direction. The relationship between the U-scan system and J2000 RA-Dec axes changes with Tile, but the x-axis of the U-scan system never gets more than 3-4 arcmin out of the J2000 equatorial plane. Thus, away from the equatorial poles, to an approximation, x or cross-scan is in the negative RA direction and y or in-scan is in the Dec direction. In this page, the cardinal directions north, south, east and west actually refer to these approximations, so that "north" is the positive in-scan direction and "east" is the positive RA direction. For more information on 2MASS coordinate systems and transformations, see IV.6.
Additionally, final calibrations and corrections were applied to source magnitudes near the end of pipeline processing, so the magnitudes used in the pipeline do not exactly match those found in the Catalog. Therefore, any calculation of artifact areas and flags using RA, Dec, PSC magnitudes, and the algorithms and parameters found herein is only a close approximation to those calculated during processing, especially near the equatorial poles.
i. Diffraction Spikes [cc_flg="d"]
Since the diffraction spikes also vary in length, width, and brightness with facility (northern or southern), band, and direction, separate parameters are used to calculate the boundaries for each spike direction in each band and facility. The parameters were determined by the patterns of false sources created by the diffraction spikes and faint real sources pushed over the detection threshold by the extra flux, so the spike boundaries trace the areas in which the spikes cause false sources, not necessarily the full area of the visible spikes on the images. These parameter values are given in Table 2 below. The spike widths and lengths, as a function of band, are shown in Figures 3-14 below.
General Parameters
Faint parent sources do not cause diffraction spikes bright enough to create false sources. Therefore, diffraction spike searches are conducted only if the parent source is brighter than the mthrD parameter for that spike.
All sources found within the predicted boundaries of a
spike are at least contaminated by the spike. Those fainter than
mpar +  mD are
considered spurious detections and are culled from the
Catalog during the Catalog Generation process (see
V.1).
Sources brighter than the threshold
are included in the release Catalogs, but are marked as contaminated
by the spike. Such contaminated point sources have a value of "d"
in the appropriate band in the "cc_flg" in the PSC record.
mD are
considered spurious detections and are culled from the
Catalog during the Catalog Generation process (see
V.1).
Sources brighter than the threshold
are included in the release Catalogs, but are marked as contaminated
by the spike. Such contaminated point sources have a value of "d"
in the appropriate band in the "cc_flg" in the PSC record.
Spike Length
The calculated length l in arcsec of each spike area, from the center of the parent source, is:
l = l0 * 10 [a * (m0´ - mpar) ]where the l0 and a parameters depend on spike direction, band, and facility, and the m0´ parameter depends on the source density adjustment (see the next paragraph). In addition, there is a minimum spike length of 2´´, and a maximum spike length of 4080´´, or 68´, for the northern facility and 3840´´, or 64´, for the southern facility. If the calculated length is less than the minimum, it is set to the minimum value; if it is greater than the maximum, it is set to the maximum value, so no diffraction spike will be longer than 68´ or 64´ depending on the facility.
Source Density Adjustment
The initial value of the zero-point parameter m0 for all diffraction spikes is 6.0. However, as source densities increase, the confusion noise raises the background noise levels such that the diffraction spike lengths decrease. For these purposes, the source density value src_dens is simply the number of source detections in the Tile for one band divided by the survey Tile area, 0.85 deg2. If the Tile's source density is greater than 5883.0 per deg-2 (i. e., the number of source detections in the Tile for that band is greater than 5000), the m0 parameter is shifted using:
m0´ = 6.0 - [ log10(src_dens/5883.0) / d ]where the d parameter depends on spike direction, band, and facility, as illustrated in Figures 9--11 and 27--29 below. The shifted m0 values result in shorter spikes, as seen in Figures 12--20 and 30--38 using parent source magnitudes of 3.0, 5.0, and 7.0 as examples.
Spike Width
The diffraction spike widths increase with distance from the parent source, making the spikes into wedges that fan out from the center. The equation to calculate the spike half-width is
w = w0 + (e * z)where z is the distance in arcsec from the parent source.
| Table 2: Diffraction Spike Parameters | |||||||||||||||||||||
| Northern Facility | |||||||||||||||||||||
| J | H | Ks | |||||||||||||||||||
| mthrD | mD |
l0 | a | d | w0 | e | mthrD | mD |
l0 | a | d | w0 | e | mthrD | mD |
l0 | a | d | w0 | e | |
| N spike | 9.75 | 6.5 | 91.0 | 0.127 | 0.3172 | 2.0 | 0.0167 | 9.25 | 6.0 | 76.0 | 0.132 | 0.2175 | 2.0 | 0.0167 | 9.00 | 6.0 | 62.8 | 0.139 | 0.2701 | 2.0 | 0.0167 |
| W spike | 9.00 | 6.5 | 65.4 | 0.121 | 0.3517 | 2.5 | 0.0278 | 8.50 | 6.0 | 55.0 | 0.125 | 0.4641 | 2.5 | 0.0300 | 8.00 | 6.0 | 54.2 | 0.141 | 0.3223 | 2.5 | 0.0300 |
| S spike | 9.00 | 6.5 | 79.4 | 0.111 | 0.3012 | 2.0 | 0.0167 | 8.50 | 6.0 | 61.6 | 0.129 | 0.4723 | 2.0 | 0.0200 | 8.25 | 6.0 | 59.6 | 0.140 | 0.5304 | 2.0 | 0.0233 |
| E spike | 9.75 | 6.5 | 86.4 | 0.114 | 0.2940 | 2.0 | 0.0250 | 9.75 | 6.0 | 65.4 | 0.126 | 0.3166 | 2.0 | 0.0296 | 8.75 | 6.0 | 75.0 | 0.112 | 0.2027 | 2.5 | 0.0250 |
| Southern Facility | |||||||||||||||||||||
| J | H | Ks | |||||||||||||||||||
| mthrD | mD |
l0 | a | d | w0 | e | mthrD | mD |
l0 | a | d | w0 | e | mthrD | mD |
l0 | a | d | w0 | e | |
| N spike | 9.00 | 6.5 | 92.2 | 0.112 | 0.3620 | 2.0 | 0.0200 | 9.25 | 5.5 | 57.0 | 0.124 | 0.6244 | 2.0 | 0.0167 | 9.75 | 6.5 | 63.4 | 0.137 | 0.6943 | 2.5 | 0.0167 |
| W spike | 9.75 | 6.5 | 82.2 | 0.105 | 0.3831 | 2.0 | 0.0200 | 9.75 | 5.5 | 88.4 | 0.103 | 0.3845 | 2.0 | 0.0200 | 8.50 | 6.5 | 73.2 | 0.101 | 0.3893 | 2.0 | 0.0200 |
| S spike | 9.75 | 6.5 | 85.2 | 0.122 | 0.4871 | 2.0 | 0.0200 | 9.75 | 5.5 | 60.4 | 0.127 | 0.4871 | 2.0 | 0.0200 | 9.00 | 6.5 | 56.2 | 0.137 | 0.7818 | 2.0 | 0.0200 |
| E spike | 9.75 | 6.5 | 75.0 | 0.116 | 0.4258 | 2.0 | 0.0200 | 8.75 | 5.5 | 61.2 | 0.118 | 0.7503 | 2.0 | 0.0200 | 8.00 | 6.5 | 66.2 | 0.113 | 0.4923 | 2.0 | 0.0200 |
| Northern Facility | |||
| Spike Lengths | 
| 
| 
|
| Figure 3 | Figure 4 | Figure 5 | |
| Spike Widths | 
| 
| 
|
| Figure 6 | Figure 7 | Figure 8 | |
| Source Density-Adjusted m0 | 
| 
| 
|
| Figure 9 | Figure 10 | Figure 11 | |
| Source Density-Adjusted Spike Lengths for mpar = 3.0 |
| 
| 
|
| Figure 12 | Figure 13 | Figure 14 | |
| Source Density-Adjusted Spike Lengths for mpar = 5.0 |
| 
| 
|
| Figure 15 | Figure 16 | Figure 17 | |
| Source Density-Adjusted Spike Lengths for mpar = 7.0 |
| 
| 
|
| Figure 18 | Figure 19 | Figure 20 | |
| Southern Facility | |||
| Spike Lengths | 
| 
| 
|
| Figure 21 | Figure 22 | Figure 23 | |
| Spike Widths | 
| 
| 
|
| Figure 24 | Figure 25 | Figure 26 | |
| Source Density-Adjusted m0 | 
| 
| 
|
| Figure 27 | Figure 28 | Figure 29 | |
| Source Density-Adjusted Spike Lengths for mpar = 3.0 |

| 
| 
|
| Figure 30 | Figure 31 | Figure 32 | |
| Source Density-Adjusted Spike Lengths for mpar = 5.0 |
| 
| 
|
| Figure 33 | Figure 34 | Figure 35 | |
| Source Density-Adjusted Spike Lengths for mpar = 7.0 |

| 
| 
|
| Figure 36 | Figure 37 | Figure 38 | |
When a very bright source illuminates pixels on a NICMOS3 array, a latent signal that decays with time will persist in subsequent reads of those pixels. Because of the regular stepping in declination of 2MASS scanning (III.2a), bright stars will leave a "trail" of false stars of diminishing brightness, spaced at regular intervals in the direction opposite to the scanning. The brightness and duration of the persistence "trail" is a repeatable function of the parent source brightness. Note the prominent persistence trail extending north of HD17054 in the image above, as well as the fainter persistence artifacts just north of even much fainter stars. Because these artifacts appear stellar, they are particularly insidious especially when inspecting 2MASS images. The location of known persistence image artifacts are shown as overlays on the 2MASS Atlas Images that are retrieved using the IRSA 2MASS Image Services.
Algorithm
Because the scanning step size is known very accurately, and because
the decay in brightness of the latent images is well understood,
spurious detections of persistence artifacts can be identified in the
source lists during pipeline processing for each scan using simple
geometric and brightness relationships
for parent sources brighter than 11.5 mag in the J band,
10.0 mag in H, or 9.5 mag in Ks.
Very bright parents, especially those saturated in the Read1 images,
have larger position errors than most 2MASS sources,
which in turn cause larger errors in the predicted persistence positions.
These persistence sources are also much less point-like than normal sources,
because the saturated core of the parent is so large, and thus
the persistence detections are also more spread out.
Therefore, the persistence search radii and predicted persistence position
errors for parents brighter than 5.0, 4.5, or 4.0 mag in J, H, or Ks,
respectively, are larger than those for fainter parents.
For each detection that is
within 6´´ of an expected persistence artifact,
or within 14´´ if the parent is brighter than 5.0, 4.5, or 4.0 mag
in the J, H, or Ks bands, respectively,
the probability
that it is an artifact is evaluated based on a positional and brightness
 2 function,
which depends on the expected position and magnitude of the persistence artifact
and the difference between the actual detection and the expected values.
Using Numerical Recipes routines (Press, W., Flannery, B.P., Teukolksy, S.A.,
& Vetterling, W.T. 1988, Numerical Recipes in C [Cambridge: CUP], Ch. 6),
the probability is normalized such that
values > 0.5 are likely persistence artifacts, and are culled
from the final Catalog source lists. Objects with persistence
probabilities between 0.1-0.5 are included in the Catalog lists,
but are flagged as having measurements that are likely influenced
by nearby persistence artifacts. The "cc_flg" value corresponding to
persistence source contamination is "p."
2 function,
which depends on the expected position and magnitude of the persistence artifact
and the difference between the actual detection and the expected values.
Using Numerical Recipes routines (Press, W., Flannery, B.P., Teukolksy, S.A.,
& Vetterling, W.T. 1988, Numerical Recipes in C [Cambridge: CUP], Ch. 6),
the probability is normalized such that
values > 0.5 are likely persistence artifacts, and are culled
from the final Catalog source lists. Objects with persistence
probabilities between 0.1-0.5 are included in the Catalog lists,
but are flagged as having measurements that are likely influenced
by nearby persistence artifacts. The "cc_flg" value corresponding to
persistence source contamination is "p."
The expected position of a persistence artifact found at the location of the ith frame offset following the parent source is approximately:
xiP = xpar + (i * xoffs)where (xpar ,ypar) is the position of the parent, xoffs is the scan's average frame-to-frame cross-scan offset, and yoffs is the scan's average frame-to-frame in-scan offset. The signs of the offsets depend on the scanning direction. These offsets are read from a position information file for each Tile; typical values are, in arcsec, for north-going scans of Tiles:
yiP = ypar + (i * yoffs)
xoffs ~ 0.5´´
yoffs ~ 83´´
and for south-going scans of Tiles:
xoffs ~ -0.5´´
yoffs ~ -83´´
The predicted magnitude of the ith persistence artifact is approximately given by:
miP = mpar +where the
miP values are found in
Table 3 below.
Note that miP is not well-determined
for values of i > about 7 because there are few of these sources and
their parents are very bright,
so the persistence sources are not point-like
and their magnitudes can have large errors.
The 2 function is thus computed as:
where xs, ys, and ms are the possible persistence source's position and magnitude. The quantitiesx2 ] + [(ys - yiP)2 /
x2,
y2, and
m2 are
the sums of the squares of the possible persistence source's uncertainties
in x, y, and magnitude (found in the source data), the parent
source's uncertainties in x, y, and magnitude (also found
in the source data), and the uncertainties in the empirically predicted
positions and magnitudes, which are 4.0´´ in x and y,
or 10.0´´ for very bright parents, and 1.0 mag.
The persistence searches end when the value of miP, within its uncertainty, is fainter than the approximate source detection limits of the survey. Since the predicted magnitude uncertainty is approximately 1.0 mag, the search is ended when miP > 18.7 mag in J, 18.2 mag in H, or 17.7 mag in Ks for the northern facility, or 18.7 mag in J, 18.0 mag in H, or 17.6 mag in Ks for the southern facility.
| Table 3: Persistence Parameters | ||||||||||||||||||||
| Northern Facility | Southern Facility | |||||||||||||||||||
| i | 1 | 2 | 3 | 4 | 5 | 6 | 7 | 8 | 9 | 10 | 1 | 2 | 3 | 4 | 5 | 6 | 7 | 8 | 9 | 10 |
| J miP |
5.8 | 7.6 | 8.4 | 8.8 | 9.1 | 9.4 | 9.8 | 10.5 | 12.0 | 13.0 | 6.2 | 8.1 | 8.9 | 9.5 | 10.0 | 10.4 | 10.8 | 11.5 | 12.0 | 13.0 |
| H miP |
6.3 | 7.8 | 8.4 | 8.8 | 9.1 | 9.2 | 9.4 | 11.0 | 12.0 | 13.0 | 5.8 | 7.1 | 7.6 | 8.3 | 8.6 | 8.9 | 9.3 | 10.2 | 12.0 | 13.0 |
| Ks miP |
6.3 | 7.8 | 8.4 | 8.8 | 9.1 | 9.4 | 9.6 | 10.5 | 12.0 | 13.0 | 6.3 | 8.0 | 8.8 | 9.3 | 9.4 | 9.5 | 9.8 | 11.0 | 12.0 | 13.0 |
iii. Filter and Dichroic Glints
Glints are point-like images that result from internal reflections of bright stars within the filter and dichroics of the 2MASS cameras (III.1b). They are found at well-defined positional offsets relative to the bright source, and have magnitudes that are approximately constant offsets from the bright source's magnitude. For both the northern and southern 2MASS cameras, the glints lie within 34´´ of the parent object. Like persistence artifacts, the glints are stellar in appearance, so they can be easily confused with real objects on the sky in the images. The filter and dichroic glints have the added feature that they do not appear in all bands, so they can have extreme apparent colors. For example, because the Ks light passes through two dichroics, there is a Ks-only dichroic that produces red "companions" to all bright stars in 3-color composite images produced from the 2MASS Atlas Images. An example of these can be seen in the images of Gliese 445 and Kapteyn's Star in Section II.4b. There are 2, 1, and 2 glints in the J, H, and Ks bands in the northern camera and 4, 2, and 2 glints in the southern camera, respectively.
Glint artifacts are found in the detection lists during scan pipeline processing by searching for objects near the predicted position offset from a bright star that also have magnitudes within the uncertainty bounds of the expected magnitude. Such objects are culled from the detection lists and not included in the released 2MASS Catalogs during the Catalog generation process (V.1). As with persistence artifacts, the position of filter and dichroic glints are indicated on overlays to the Atlas Images retrieved using the IRSA 2MASS Image Services.
Algorithm
A source is considered a glint artifact if it is
found within rgl arcsec of the
glint's expected position (xgl ,ygl)
and has a magnitude within ±mgl mag
of mpar +mG,
where rgl, mgl,
and mG
depend on the glint number, band, and facility.
The expected position of the glint is:
xgl = xpar+fglwhere the fgl and hgl parameters also depend on the glint number, band, and facility.
ygl = ypar+hgl
| Table 4: Glint Parameters | |||||||||||||
| Northern Facility | Southern Facility | ||||||||||||
| J | H | Ks | J | H | Ks | ||||||||
| Param | glint #1 | glint #2 | glint #1 | glint #1 | glint #2 | glint #1 | glint #2 | glint #3 | glint #4 | glint #1 | glint #2 | glint #1 | glint #2 |
| f | 1.5 | 3.0 | 1.5 | 1.5 | -4.0 | -2.5 | 1.0 | -6.5 | -10.0 | -2.5 | 1.0 | -2.5 | 1.0 |
| h | -14.0 | -28.5 | -14.0 | -14.0 | 16.5 | 11.0 | -13.5 | 22.0 | 33.5 | 11.5 | -13.5 | 11.0 | -13.5 |
| rG | 2.0 | 3.0 | 2.0 | 2.5 | 2.5 | 3.0 | 1.5 | 3.5 | 5.0 | 3.0 | 1.5 | 3.0 | 2.0 |
| mG |
6.7 | 9.0 | 7.9 | 7.8 | 7.2 | 6.5 | 9.0 | 9.0 | 12.0 | 8.0 | 8.2 | 7.3 | 7.5 |
| mG |
0.9 | 2.0 | 1.6 | 1.8 | 1.3 | 1.0 | 2.0 | 2.5 | 3.0 | 2.0 | 2.0 | 2.4 | 1.5 |
Horizontal "stripe" artifacts extend the full east-west width of the scan at the declination of very bright stars, as well as at 256´´ north and south of the star's position. They are 8´´ in full-width north to south, and often have electronic echoes of the star at the locations (xpar ±0, 256´´, ypar ±0, 256´´). These stripes are an electronic feedback associated with the quad readout of the detectors, and are much fainter than diffraction spikes; only parent sources brighter than 6.7 mag in J, 6.2 mag in H, or 5.7 mag in Ks in the north or 6.7 mag in J, 6.0 mag in H, or 5.6 mag in Ks in the south are bright enough to create these lines of heightened charge. An example can be seen in the images of tau Ceti in Section II.4b.
Any detections that fall within the area covered by a stripe may have photometry affected by the artifact. Such objects are flagged with an "s" in the "cc_flg".
v. Bright Star Confusion Artifacts
Confusion artifacts can only be caused by parents that are saturated in the R2-R1 and/or R1 exposures. However, for sources saturated in the R2-R1 exposure, there often are no good data from that exposure and thus no explicit indication that the parent was saturated. To deal with this situation, magnitude thresholds msat are also used to determine if the parent should have been saturated in the R2-R1 exposure. These thresholds are found in Table 5 below. If the parent is brighter than the threshold in that band, saturation is assumed for that band. (See also Cautionary Notes below for more information.) The artifact confusion radii for the northern facility is shown in Figure 39, and for the southern facility in Figure 40.
The equation to calculate the artifact confusion radius for a read type (rd_flg = "1" or "2") is
riAC = r0AC * 10[ b * ( mi0AC - mpar ) ]where the r0AC and b parameters depend on facility and band, and the mi0AC parameter depends on facility, band, and read type i. In addition, there is a minimum radius of 1´´, and a maximum radius of 4000´´, or 66.67´, for the northern facility and 5000´´, or 83.33´, for the southern facility. If the calculated radius is less than the minimum, it is set to the minimum value; if it is greater than the maximum, it is set to the maximum value.
| Table 5: Artifact Confusion Parameters | ||||||
| Northern Facility | Southern Facility | |||||
| J | H | Ks | J | H | Ks | |
| msat | 8.0 | 7.7 | 7.1 | 8.0 | 7.6 | 7.1 |
| r0AC | 12.90 | 10.20 | 8.50 | 15.06 | 9.46 | 7.74 |
| b | 0.202 | 0.203 | 0.171 | 0.207 | 0.201 | 0.194 |
| rd_flg="1" m0AC | 2.5 | 2.5 | 2.5 | 2.5 | 2.5 | 2.5 |
| rd_flg="2" m0AC | 6.0 | 6.0 | 6.0 | 6.0 | 6.0 | 6.0 |
| 
|
| Figure 39 | Figure 40 |
vi. Photometric Confusion [cc_flg="c"]
rPC = r0PC * 10 [c * (mfs - mpar) ]where mfs is the magnitude of the fainter source, and the r0PC and c parameters depend only on band. There is a minimum radius of 1´´, and a maximum radius of 1200´´, or 20.0´. If the calculated radius is less than the minimum, it is set to the minimum value; if it is greater than the maximum, it is set to the maximum value. Additionally, all sources with "bl_flg" greater than zero are marked as having photometric confusion in that band, since they have been passively deblended.
| Table 6: Photometric Confusion Parameters | |||
| J | H | Ks | |
| r0PC | 4.678 | 4.380 | 3.980 |
| c | 0.1165 | 0.1148 | 0.1243 |
Figures 41 and
42
show the maximum photometric confusion radius
for a certain parent magnitude in each band and facility,
where the second fainter source has a magnitude equal to
the approximate source detection limits in that band and facility.
| 
|
| Figure 41 | Figure 42 |
The following discusses known problems in the application of the artifact identification algorithms described above. Confirmed unreliable sources in the PSC are maintained in an Anomaly File that will be updated periodically.
i. Residual Diffraction Spikes from Very Bright Parents
A detailed analysis has been made of residual diffraction spike artifacts in the PSC from very bright stars. These residual artifacts are most obvious around parents brighter than ~ -2 mag, although some faint remnants can also be seen around parents between about 0 mag and -2 mag in data from the southern facility. There are a total of 5 stars creating the most obvious residual spike artifacts for the northern facility, and 7 stars doing the same for the southern facility; all of these stars are known variables. Since these bright stars can cast diffraction spikes across scan boundaries, into adjacent scans that may have been observed at very different times, the artifact search parameters used in these adjacent scans may be based on the incorrect brightness of the parent at the time of the actual scan observation.
The sources located in the areas covered by the residual spikes were also examined.
Most are single-band sources;
almost all of the rest are two-band sources with
ph_qual lower than "A" in both detected bands;
and only a few in the Ks band from the southern facility
are triple-band sources which have low photometric quality,
with ph_qual = "C" or "D" in each band.
The profile-fit photometry 2
values for the sources in the residual spike areas tend to be larger than 2,
but the extended high 2 tail
for both the populations of real sources and possible artifacts in these regions
makes it impossible to use this quantity alone to separate the populations.
Table 7 below
gives the total numbers of single-band and double-band sources
found in the rectangular areas approximately covered
by the residual spikes for each band and facility;
these numbers would be the maximum number of unreliable sources left in the PSC
from these residual spikes.
| Table 7: Residual Spike Source Counts | |||
in spike rectangles | in spike rectangles | ||
ii. Artifacts from Skipped Single-Band Parents
mj´ = 2.695 * mh - 1.695 * mk
mh´ = 0.370 * mj - 0.630 * mk
mk´ = 1.598 * mh - 0.587 * mj
None of these parents are very close to Tile edges, so they did not create any confusion artifacts in nearby Tiles. For each of the 11 skipped parents that are members of close visual multiples, there was at least one two- or three-band extraction of another component of the group or in the middle of the components, and artifacts that happened to fall in the areas masked by those other extractions were properly flagged. Also, the processing did search for artifacts found in the same Tile as their parents. Therefore, only a few of the diffraction spike artifacts located in nearby Tiles remain unflagged; 28 of these are found in the PSC, and are found in the PSC Anomaly File. These artifacts were caused by nine of the 12 skipped parents; the other three did not cause any unflagged artifacts.
iii. Confusion Artifacts from the Read1 Images
As mentioned above in section IV.7.a.v, confusion artifacts can only be caused by saturated parents. However, saturated sources are sometimes not detected in the saturated exposure; in these cases there are no explicit data indicating saturation. To deal with this situation, magnitude thresholds msat are also used to determine if the parent should have been saturated in the exposure. If the parent is brighter than the threshold in that band, saturation is assumed for that band.
Unfortunately, the same magnitude threshold values used for R2-R1 exposures were also used for R1 exposures, instead of those values minus ~ 3 mag: 5.0 mag in J, 4.7 mag in H, and 4.1 mag in Ks for the northern facility, and 5.0 mag in J, 4.6 mag in H, and 4.1 mag in Ks for the southern facility. Therefore, for the confusion artifact searches, parents between 8.0 and 5.0 mag in J, 7.7 and 4.7 mag in J, and 7.1 and 4.1 mag in Ks for the northern facility and 8.0 and 5.0 mag in J, 7.6 and 4.6 mag in J, and 7.1 and 4.1 mag in Ks for the southern facility were treated as saturated in the R1 exposure even if they were not actually saturated.
The Read1 exposures' artifact confusion radii, however, are very small for parents with magnitudes between the correct thresholds and those actually used: the radii at the correct threshold magnitudes are 4.0´´ in J, 3.6´´ in H, and 4.5´´ in Ks for the northern facility, and 4.6´´ in J, 3.6´´ in H, and 3.8´´ in Ks for the southern facility, and the radii at the incorrect threshold magnitudes are, respectively, 1.0´´, 1.0´´, 1.4´´ 1.1´´, 1.0´´, and 1.0´´. For comparison, source deblending will only work on source pairs separated by ~ 4´´ or less, and the minimum source resolution of the survey is ~ 1.5´´. Therefore, most of the rd_flg="1" sources incorrectly flagged as confusion artifacts are probably caused by missed frame merges from the Read1 images.
iv. Unflagged Persistence Sources
As described above in section IV.7.a.ii, bright stars are followed by a "trail" of false persistence sources of diminishing brightness, spaced at scan step intervals in the direction opposite to the scanning. In addition to searching for persistence from parents found in the Tile, the processing also looks for bright stars in the first five frames at the beginning of each scan used to build up to the six-frame-deep coverage of points in the Tile, and searches for persistence and other artifacts inside the Tile area from these "low-coverage area" parents.
However, there was a bug in the search for persistence sources on the Read2-Read1 images from some of these parents in the low-coverage areas at the beginning of a south-going scan, when the predicted position of the first persistence source was north of, or before, the first rd_flg="2" source in the scan. In these cases, an incorrect flag setting would prevent further persistence searches on the Read2-Read1 images at later -- i.e. more southern -- frame positions. This bug does not affect persistence searches with parents in, or less than 1 frame preceding, the R2-R1 exposures' six-frame-coverage area, or in north-going scans. It also does not affect affect searches for rd_flg="1" persistence sources, nor any other type of artifact searches (e.g., glints, diffraction spikes, etc.).
Because of the particular circumstances that cause this problem, only one of these unflagged persistence sources has been found so far during analysis. The only way to estimate how many other unflagged persistence sources might remain in the working database and PSC is to count the flagged persistence sources caused by "low-coverage area" parents. If we assume that the north- and south-going scans of Tiles are distributed randomly over the sky, half of the sources should be found in north-going scans and the other half in south-going scans. This means that approximately half of this type of persistence sources were flagged correctly, and half were not.
The numbers of persistence artifacts,
with persistence probabilities > 0.5,
and persistence-affected sources,
with persistence probabilities  0.5,
in the PSC and working database from parents in the first five frames of Tiles
are found in the first two lines of
Table 8 below.
Only 20-25% of these sources in the working database
with persistence probabilities 0.5
are also found in the PSC,
probably because most of them are, as expected, real sources
that happen to fall on a persistence position
and thus have duplicate extractions in neighboring Tiles.
These duplicates are likely to be farther from the Tile edges
and therefore would be selected in the duplicate-resolution processing,
and they will either have full-coverage persistence parents
if their scans run in the same direction as the scans with low-coverage parents,
or will not fall on a persistence position
if their scans run in the opposite direction.
0.5,
in the PSC and working database from parents in the first five frames of Tiles
are found in the first two lines of
Table 8 below.
Only 20-25% of these sources in the working database
with persistence probabilities 0.5
are also found in the PSC,
probably because most of them are, as expected, real sources
that happen to fall on a persistence position
and thus have duplicate extractions in neighboring Tiles.
These duplicates are likely to be farther from the Tile edges
and therefore would be selected in the duplicate-resolution processing,
and they will either have full-coverage persistence parents
if their scans run in the same direction as the scans with low-coverage parents,
or will not fall on a persistence position
if their scans run in the opposite direction.
However, not all low-coverage parents will be able to create more than one persistence source, as required for this bug to occur. The numbers of low-coverage parents creating more than one persistence source in the working database and PSC are found in the third and fourth lines of the table, and the numbers of persistence sources created or affected by these parents are found in the fifth and sixth lines. Unfortunately, we can only get these counts one band at a time, so the "any band" category is left blank. Since approximately 76% of the sources in the PSC are 3-band sources, these counts will certainly overestimate the numbers of persistence sources.
Assuming that approximately half of this type of persistence sources
were flagged correctly, and half were not,
and ignoring the fact that most of the sources are 3-band, not single-band,
these last two lines of the table are a reasonable estimate of
the maximum number of missed persistence sources.
A maximum of 94364 working database sources
should have had persistence probability > 0.5;
if about 17%, 24%, and 19% of them in the
J, H, and Ks bands respectively are in the PSC,
the catalog contains approximately 5621, 9965, and 3758
missed persistence artifacts in J, H, and Ks,
or 19344 total.
This is 0.0041% of the total number of sources in the PSC (470992970).
The maximum number of missed working database sources
that should have had persistence probability 0.5
is approximately 117092;
the PSC contains approximately 4130, 10492, and 9273 of these sources
in J, H, and Ks, or 23895 total.
This is 0.0051% of the total sources in the PSC.
| Table 8: Low-Coverage Parents' Persistence Source Counts | ||||||||
| # of sources in working database | # of sources in PSC and (# in PSC / # in WDB) | |||||||
| J | H | Ks | any band | J | H | Ks | any band | |
| pers.prob > 0.5 | 53629 | 53643 | 30954 | 83226 | -- | -- | -- | -- |
| pers.prob 0.5 |
36162 | 60593 | 67009 | 106636 | 7336 (0.20) | 15364 (0.25) | 14550 (0.22) | 24084 (0.23) |
| parents w/ > 1 src having pers.prob > 0.5 | 9692 | 10723 | 6208 | -- | -- | -- | -- | -- |
| parents w/ > 1 src having pers.prob 0.5 |
7930 | 12861 | 15556 | -- | 1392 (0.18) | 3159 (0.25) | 3139 (0.20) | -- |
| srcs from parents w/ > 1 src having pers.prob > 0.5 | 33063 | 41521 | 19780 | -- | -- | -- | -- | -- |
| srcs from parents w/ > 1 src having pers.prob 0.5 |
24362 | 44618 | 48112 | -- | 4130 (0.17) | 10492 (0.24) | 9273 (0.19) | -- |
[Last updated: 2007 December 28, by R. Cutri and T. Evans]
 Pegasi
(Ks~-1.9) in the Second Incremental
Data Release, the confusion radius can be many arcminutes.
"rd_flg"="2" sources found within the R2-R1 exposure artifact confusion radius
and "rd_flg"="1" sources within the R1 exposure artifact confusion radius
around a very bright star
are identified as a spurious detections and not selected for inclusion
in the release Catalogs.
Pegasi
(Ks~-1.9) in the Second Incremental
Data Release, the confusion radius can be many arcminutes.
"rd_flg"="2" sources found within the R2-R1 exposure artifact confusion radius
and "rd_flg"="1" sources within the R1 exposure artifact confusion radius
around a very bright star
are identified as a spurious detections and not selected for inclusion
in the release Catalogs.