iii. Catalog Selection By SNR, Not Flux Limits
The natural unit of any survey, such as 2MASS, is the noise
(justified below). Magnitude or flux limits are fundamental measures for a
source. But it is counterproductive, and often dangerous, if one uses
a flux limit to select sources for entry into a catalog.
The definition of what the noise actually is in any survey must, of course, be
carefully considered. However, for the moment, assume that one understands the
noise in a given survey, and that its value is readily calculable.
The basic reason that catalog selection should be by SNR is that the value of
any experimental data depends strongly on its SNR. It is generally accepted
that for any individual source, nothing less than a 95 or 99% confidence limit
should be used to quote a meaningful number, corresponding to 2--3 Gaussian
 . It is also generally accepted that for any
survey containing lots of sources, no source that does not have at least one
measurement with flux above 5--6
  should enter a
catalog of results from that survey.
The first reason behind the higher threshold for a survey is the
reliability of the catalog based on the survey. The reliability depends
directly on the number of volume elements over which one searches for sources
in a survey. For example, if the survey makes independent estimates for every
4´´ × 4´´ area of sky, there are 3.3×10¹⁰
volume estimates in the sky. Even under Gaussian statistics, rarely attained
in any survey, a +5  fluctuation happens
3×10⁻⁷ for each volume element, and hence there would be
10,000 false sources in a catalog containing sources down to 5
  .
.
In practice, there is a significant non-Gaussian tail in nearly all surveys,
which could easily produce 10--100 times more false sources above 5  ,
which would be 100,000 to 1 million false sources.
There are at least three other reasons why catalogs should not use a
threshold below 5-6  for a source to
enter the catalog:
- The actual accuracy of the photometric measurement is much lower than is
commonly associated with a "5
 measurement";
- there is a severe flux overestimation problem; and
- the quoted photometric error does not well describe the actual error
distribution, which is severely non-Gaussian for fainter sources.
The basic problems here derive from the usual astronomical case that the
number of sources increases rapidly as flux decreases.
Catalogs can and should contain fluxes that are carried along from
other bands that are well below 5--6  . Those
fluxes are largely unbiased, compared to the bands that have passed a threshold to enter the catalog. It is the act of thresholding that produces the bias, so
non-thresholded bands will not have the bias discussed here.
Consider all sources reported to be at a given flux of n  in a survey. They will consist of sources whose true flux is n
 and whose realized measurement error is zero, and
of sources whose true flux is n+m
  whose realized measurement error is -m
  .
When n is large, this population smearing matters little, since the
ratio of the true fluxes of these sources coming from the population with
realized measurement errors of +m and -m
  is (n+m) / (n-m) ~ 1 + 2m/n.
Taking m=1, the ratio is 1 + 2/n, which is 1.2 for n=10
(1.22 non-approximated value). Note that the ratio goes to zero as n
increases, but becomes quite large as n decreases.
In nearly all cases, the number of sources varies with flux, as flux to the
-1 or -1.5 power. Hence, the ratio of the number of true sources at
n+m  to the true number at
n-m
  is
{(n+m)/(n-m)}(1 to 1.5).
For n=10 and m=1, this ratio is 1.22--1.35. For m=2,
the ratio is 1.5 - 1.8.
Hence, even at 10  , the error distribution is not
symmetric: there are 20--30% more sources whose true flux is 9
 than those whose true flux is 11
 , and 50--80% more sources whose true flux is 8
 than those whose true flux is 12
 . Note that as n increases, this effect
vanishes, and hence can be largely ignored for a catalog which contains only
sources brighter than SNR=10.
However, as one goes below 10  , note what happens
to that ratio of the true fluxes of these sources. At 5
 , the ratio is 6/4 -- 7/3 = 1.5 to 2.3, for
m=1 to 2. Hence, the observed 5
  sources
come from sources whose true flux varies typically by 50%, compared to the
variation of 20% or less for the sources with SNR above 10.
Worse, in this set of sources whose flux is claimed to be 5  ,
there are a lot more sources whose true flux is actually
3--4
  than whose true flux is actually
6--7
  . The ratio of the number of sources whose
true flux is 3
 , compared to the number of sources
whose true flux is 5
 , is (5/3){1,1.5}
= 1.7 -- 2.2. This gives rise to a large number of problems:
All in all, this makes a catalog of sources almost begging to be
misused by most astronomers, if one includes sources fainter than
5--6  in all bands. (Again, catalogs
should contain measurements down to ~3--4
  in
bands other than the band thresholded above 5--6
 .) Worse, because most of the sources in any
catalog are the faintest sources in the catalog, such problems quickly
adulterate any catalog that contains such faint sources.
This situation for a survey is completely different from the usual case
of a measurement for an individual source. If an astronomer already has a
source known from another survey, and wishes simply to obtain a flux
measurement for that source, a 5  measurement is
quite good. Concerns about flux overestimation play a much smaller factor,
since the source has already been selected. In other words, a random source
from a survey measured at 5
  is likely to be a
significantly fainter source, whereas a 5
  measurement for a pre-detected source is likely to be an unbiased estimate of
the source's flux. This is why the measurements in bands carried along
after thresholding in another band also are valid measurements, not subject to
this thresholding bias.
Even a 5  measurement of a previously known
source at a different wavelength can easily be biased upward by
~1
  , if care is not taken in how the flux
measurement is done. The bias arises if one attempts to measure the flux by
integrating until one gets a 5
  measurement.
For example, if the true flux of the source is 5 mJy, it is more likely that
as the measurement converges, a 5-
 6 mJy
measurement is obtained (which requires the uncertainty to be 1.2 mJy), before
a 5-
 measurement at 5 mJy or 4 mJy. Hence, the
bias, which can be avoided by setting the integration time by some other means
than achieving exactly a specified signal-to-noise ratio.
If you select a 5- detection in a given band, one
can argue that the source is "known," and that the measurements in the other
bands are unbiased. However, this is true only if one does not apply a
cut-off; if one require that those measurements also pass a threshold of some
sort, they will also be biased. This makes sense if one considers a
requirement that a 2-band detection be 5
  in each
of two bands. The biases cannot change if one sorts first on the first band
and then on the second band, compared to the reverse.
Hence, special care must be taken putting sources into a catalog based on two
bands satisfying a lower SNR threshold than source selection based on a single
band. These sources are likely to have significantly increased flux
overestimation.
The proper treatment of sources with no measurements above 5-6
 is to place them in a "Reject File." Astronomers
can use that "Reject File" to obtain quite valid measurements of individual
sources. Also, intrepid users who understand statistics and who can carefully
evaluate the actual error statistics of a catalog, may be able to use the
population of sources less than 5--6
  and reach
meaningful results. However, the history of such analysis is sordid, and
hence, making such users state that they analyzed the "Reject File" serves as
a warning to casual readers of their papers.
There is also a huge advantage to selecting sources by SNR. If a flux
threshold is used to select sources, that flux threshold has to be set high
enough, so that these problems do not exist in the least sensitive 2MASS scans.
A SNR threshold takes advantage of the fact that many 2MASS scans are more
sensitive than the worst scans, and releases a lot more useful sources to the
community.
How To Select Sources By SNR
The SNR is the flux divided by the noise. The flux of a source is well defined.
The flux of a point source is the PSF-fit flux in most cases, and the aperture
flux in a few cases. Hence, the only concern is how to calculate the noise.
The prescription is simple: outside of high source density areas, the noise is
directly related to the measured background. An
extensive analysis of the noise
shows that the typical residual between the measured background-removed noise
and that predicted solely by the background is 0.02 DN. Hence,
a robust estimate of the noise exists outside of high source density areas.
In high source density areas, the measured Atlas Image noise can be used,
either before or after background subtraction.
Of course, there are additional sources of noise: (1) meteor streaks, which
can occur by themselves, on top of faint point sources (making a 1
 true source into something much more), and can
cross another meteor streak; (2)
electronic noise; (3) airglow noise (both of which can interfere with
each other); (4) cosmic ray hits, hot pixels, pixels of varying noise;
and, (5) dead pixels that can occur anywhere on or in the background of a
source.
None of these noise sources show up in gross measurements of the noise of an
entire Atlas Image, because they affect only a few pixels. Hence, these noise
sources are more properly considered as a cause of unreliable sources. The
distribution of these unreliable sources gives rise to a strong non-Gaussian
tail of sources that extends well beyond 5  , where
the
  is calculated from the background, which is
the same as the noise calculated from an individual Atlas Image.
The proper way to handle the presence of these noise sources is to empirically
study the reliability of the catalog as a function of SNR. It may well be
that one has to set the threshold well above 5--6  ,
in order to meet the point source reliability requirement. Thus, for point
sources, the SNR threshold should be set by the reliability requirement.
The reliability requirement in the 2MASS Level 1
Specifications was placed on sources in the last half-magnitude bin above
the SNR = 10 limit. The intent was that the faintest sources in the
Catalog would satisfy that reliability requirement. In particular, note
that one does not want searches for sources without optical identifications to
be overwhelmed by false sources.
Because the "faintest sources in the Catalog" is not an easily quantifiable
requirement, it is traditional to place the reliability specification at the
SNR = 10 limit.
The fundamental reason that the reliability standard must apply to all SNR
levels in the Catalog is little attention is generally paid to what is the
SNR of any source in a catalog. Putting sources into the Catalog that have
significantly lower reliability than the SNR = 10 sources is the fastest route
to adulterating the quality of the Catalog.
In summary, a SNR threshold is mandatory for an optimal catalog.
[Last update: 1999 January 29, by T. Chester]
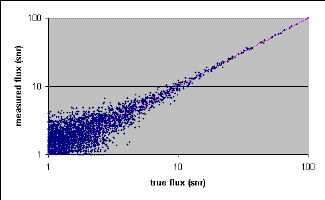
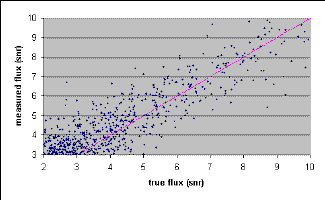
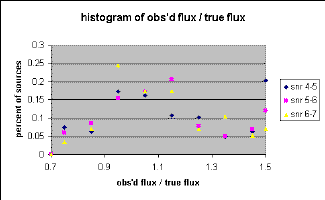
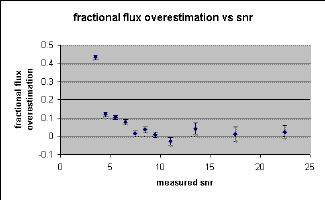
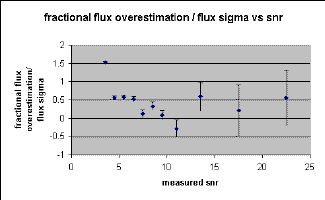
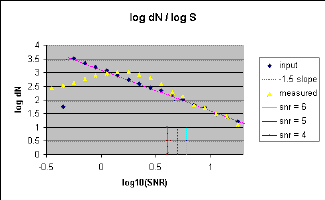
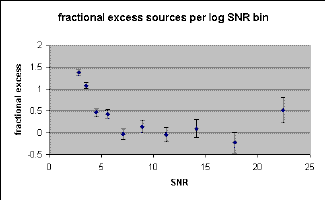
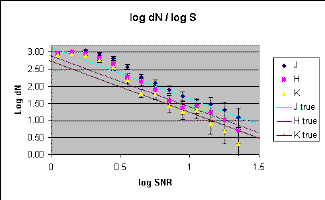
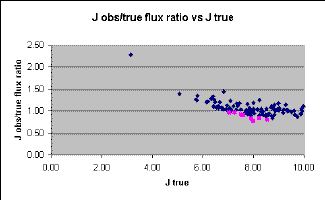
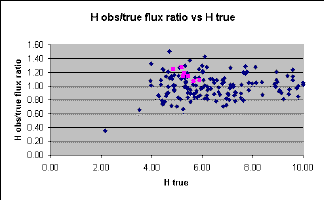
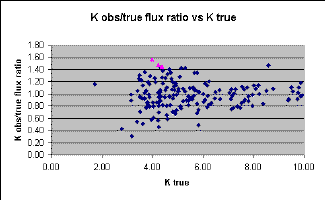
Return to  . 11,000 sources were
generated from a population that had a log N / log S slope of
-1.5, a cutoff at signal-to-noise ratio, SNRtrue = 0.5.
This should provide accurate results for observed SNR > ~3.5. SNR was used
as a direct proxy for flux, assuming a constant noise in this simulation.
(Multiplying all SNR values by
  results in the
flux, in flux units, rather than SNR units.)
