
2MASS survey data reduction produced point and extended source Working Databases (PSWDB and XSWDB) that contain the superset of measurements of sources extracted from all survey scans that were taken under nominally photometric conditions. A highly uniform and reliable subset of the PSWDB and XSWDB entries were selected to form the 2MASS All-Sky PSC and XSC using the criteria described in V.1. The Survey Point and Extended Source Reject Tables (PSRT and XSRT) contain all extractions from the Working Databases that were not selected for the All-Sky PSC and XSC.
Tables 1 and 2 summarize the number of entries in the Survey WDBs, All-Sky Catalogs and Source Reject Tables. For the PSRT, breakdowns of the number of detections by band and band-detected combinations are given in Tables 3 and 4. Band-detection tables are not given for the XSRT because extended sources were generally detected in all three bands.
| Full PSWDB | All-Sky PSC | Survey PS Reject Table |
|---|---|---|
| 1,314,981,867 | 470,992,970 | 843,988,897 |
| Full XSWDB | All-Sky XSC | Survey XS Reject Table |
|---|---|---|
| 2,590,500 | 1,647,5991 | 943,441 |
1 - The All-Sky Release XSC contains 540
Large Galaxy entries that are taken
from special processing, and are not found in the Survey XSWDB.
| Band | Number of Detections | ||
|---|---|---|---|
| Full PSWDB | All-Sky PSC | Survey PS Reject Table | |
| J | 959,198,941 | 455,371,014 | 503,827,927 |
| H | 855,470,189 | 436,797,138 | 418,673,051 |
| Ks | 727,697,937 | 375,248,502 | 352,449,435 |
| Band Combination | Full PSWDB | All-Sky PSC | Survey PS Reject Table | |||
|---|---|---|---|---|---|---|
| Number | % Total | Number | % Total | Number | % Total | |
| JHKs | 527,946,264 | 40.1 | 359,919,450 | 76.4 | 168,026,814 | 19.9 |
| JH | 136,115,027 | 10.4 | 64,724,153 | 13.7 | 71,390,874 | 8.5 |
| HKs | 17,879,984 | 1.4 | 7,603,506 | 1.6 | 10,276,478 | 1.2 |
| JKs | 19,144,429 | 1.5 | 4,257,125 | 0.9 | 14,887,304 | 1.8 |
| J | 275,993,221 | 21.0 | 26,470,286 | 5.6 | 249,522,935 | 29.6 |
| H | 173,528,914 | 13.2 | 4,550,029 | 1.0 | 168,978,885 | 20.0 |
| Ks | 162,727,260 | 12.4 | 3,468,421 | 0.7 | 159,258,839 | 18.9 |
The Survey PSRT and XSRT contain a large number of spurious extractions of low SNR noise excursions and image artifacts, and in the case of the XSRT sources that are not truly extended. Each entry in the Reject Tables is assigned a reliability score (rel) that is related to the probability that it is a detection of a real source at the time of the 2MASS observation, and in the case of the Survey XSRT, if the source is extended. See A2.2.d below for further discussion of the source reliability distributions in the Survey Reject Tables.
| rel | Probability of reliability | Survey PS Reject Table | Survey XS Reject Table |
|---|---|---|---|
| A | >90% | 243,892,807 | 682,720 |
| B | 80 to 90% | 37,304,125 | 65,024 |
| C | 70 to 80% | 25,303,048 | 17,791 |
| D | 50 to 70% | 32,227,208 | 43,277 |
| E | 20 to 50% | 72,557,964 | 69,890 |
| F | <20% | 432,703,745 | 64,739 |
| Total | --- | 843,988,897 | 943,441 |
The Full Survey Image Atlas and source Reject Tables WDBs are drawn from the complete set of 2MASS survey scans, and thus have a nominal coverage of 41,252.255 deg2, or 99.998% of the sky. There are 21 small gaps in sky coverage, totaling 0.644 deg2. However, the effective sky coverage of the Survey PSRT and XSRT is complex and non-uniform because they contain only some of the extractions in scans selected for use in the All-Sky Release, and they may contain multiple, independent measurements of objects in regions of the sky observed more than once.
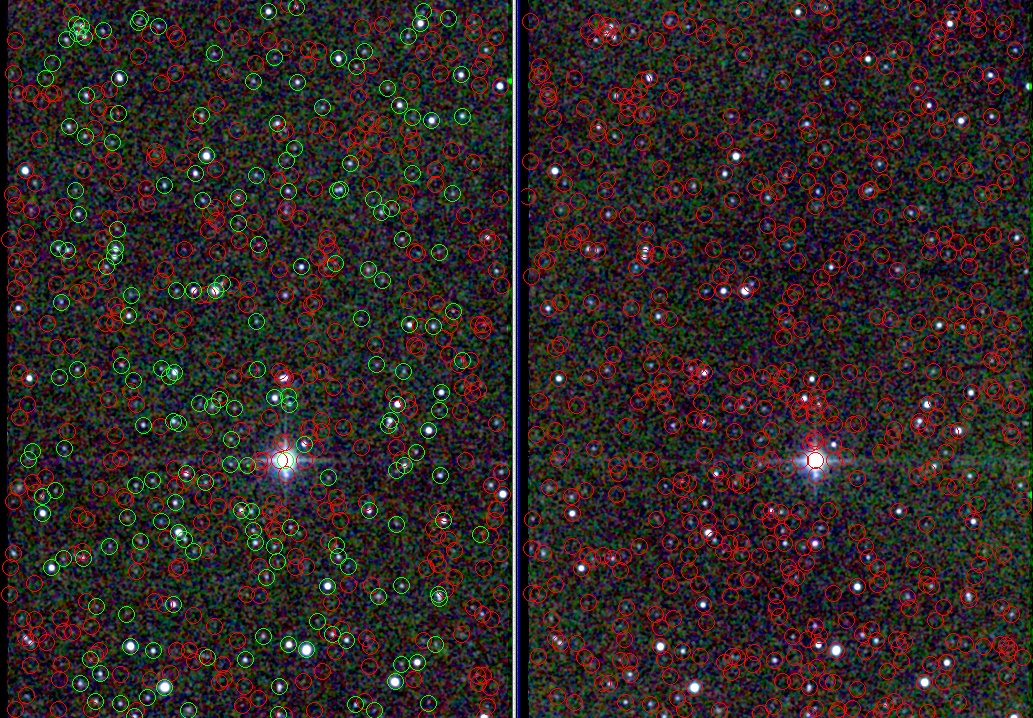
The non-uniform coverage in the Survey Reject Tables due to exclusion of All-Sky Catalog sources is illustrated in Figure 1. Two images of the central section of tile 2140 taken from different scans are compared in this figure, with point source extractions from the respective scans overlaid on the images. Extractions from the PSRT are shown in red and those in the PSC are shown in green. The first image is from the scan of the tile that was selected for inclusion in the All-Sky Release. Most of the reliable source extractions from this scan were selected for the All-Sky Catalogs. Most of the red circles denoting PSRT extractions fall on positions of very faint and/or non-existent sources and image artifacts over most of the scan area. A few bright, reliable PSRT sources are circled in red near the east and west scan edges where extractions from adjacent tiles were selected for the PSC and XSC in the duplicate source detection resolution process. The image shown in the right panel of Figure 1 is from a scan of tile 2140 not selected for the All-Sky Release. The Reject Tables contain all extractions, including reliable source detections at all SNR levels as well as spurious low SNR noise extractions and artifact detections from this scan.
|
|
|
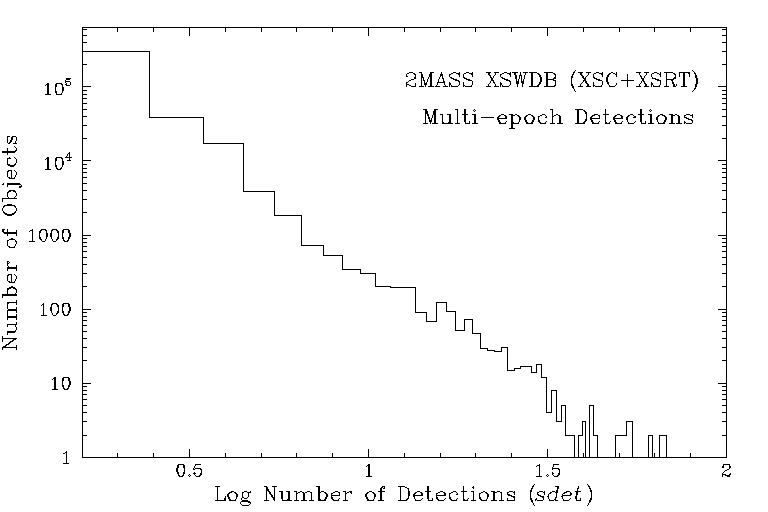
| Figure 1 - A comparison of J+H+Ks images of the central 8.5'x10' of 2MASS survey tile 2140 (ra,dec=257.92°,+2.93° J2000) from two different survey scans. (left) Scan 48 from 5/27/2000 UT (scan_key=61165) used in the in the All-Sky Release. Sources in the All-Sky PSC are marked in green, and those found only in the Survey PSRT are marked in red. (right) Scan 43 from 6/9/2000 UT (scan_key=61420) not used in the All-Sky Release. All extractions from this scan are in the PSRT and are marked in red. | Figure 2 - Histogram showing the number objects as a function of the number of independent detections in the full Survey PSWDB (PSC+PSRT). | Figure 3 - Histogram showing the number objects as a function of the number of independent detections in the full Survey XSWDB (XSC+XSRT). |
Approximately 30% of the sky was observed two or more times during 2MASS survey operations. The 2MASS Survey PSRT and XSRT may contain one or more measurements of objects in these regions, independent of the source measurements found in the All-Sky PSC and XSC. The multi-epoch coverage area is split between the overlap regions between survey tiles, and tiles that were intentionally scanned multiple times. The resulting depth-of-coverage of the survey observations is very complex, and is illustrated in Figures 1 and 2 in A2.1.a.
Figures 2 and 3 contain histograms of the point and extended source detection frequency (sdet), respectively, in all survey observations. The point and extended sources with largest number of independent detections in the survey Reject Tables are both found near the north equatorial pole, where over 600 scans converge. The faint object at <ra,dec>=78.03714°,+89.89904° (<Ks>=14.69 <J-Ks>=0.95; gcntr=1092764044) was scanned 673 times and has 660 detections in the PSRT. The faint galaxy at <ra,dec>=65.6760°,+89.9405° (<Ks>=13.76 <J-Ks>=1.21; gcntr=2308583 ) was scanned 342 times and has 156 independent measurements in the XSRT. Neither of these objects appear in the All-Sky PSC or XSC because they did not satisfy one or more of the source selection criteria for the reliable, uniform Catalog.
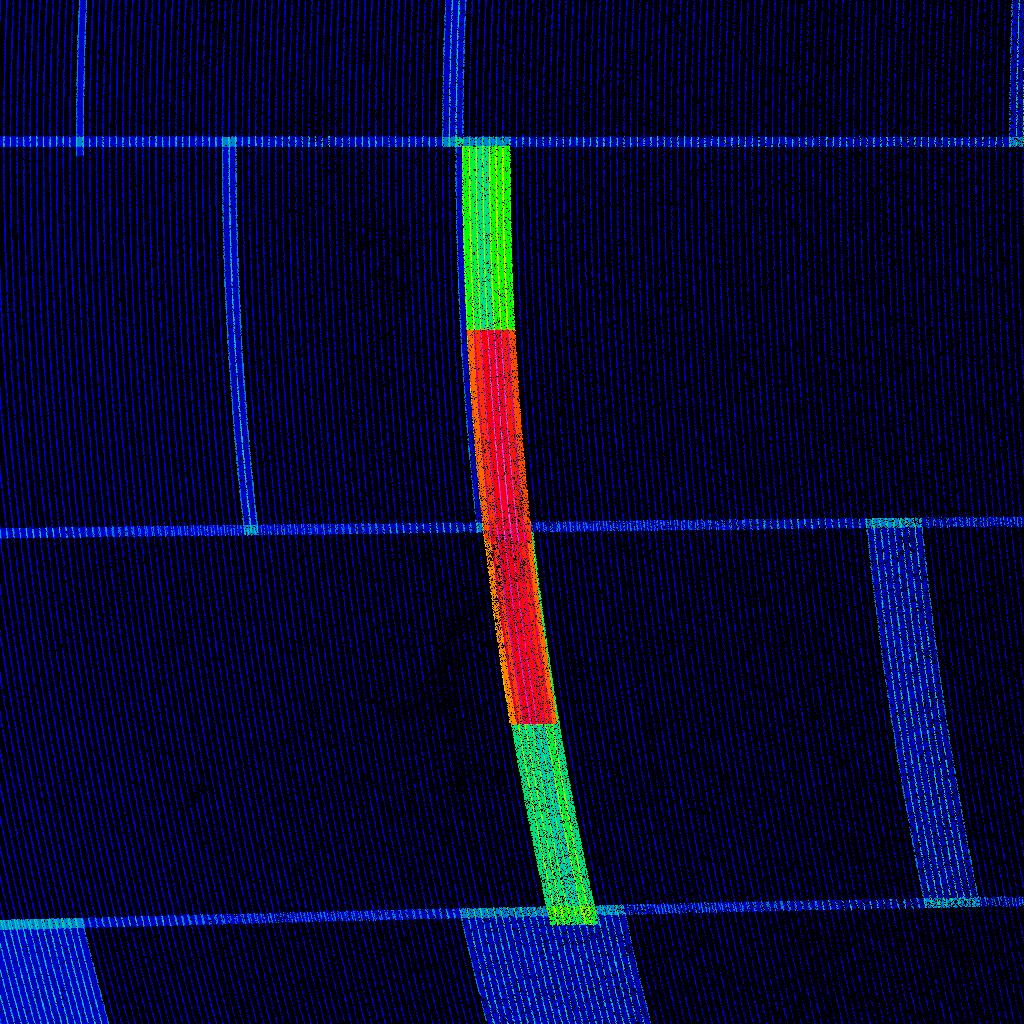
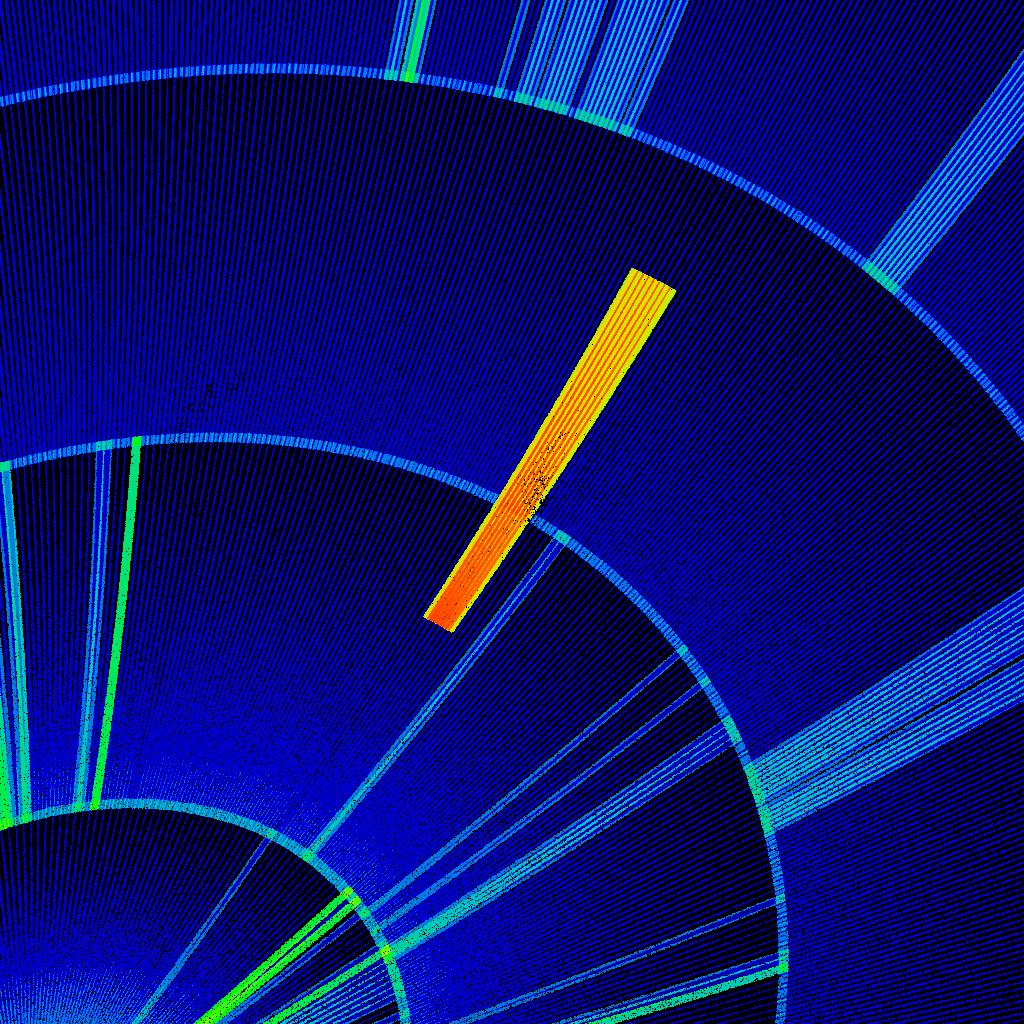
Three regions of particular interest that were scanned between 12 and 28 times during the survey are the Orion and Chameleon I molecular cloud complexes, and the Abell 3558 galaxy cluster. Table 6 contains a summary of the number of scans covering these regions, their approximate boundaries on the sky, and the survey tile numbers that were repeatedly scanned. Figures 4-6 show depth-of-coverage maps of these three regions. The repeated observations of Abell 3558 were made on normal survey tiles. For the Orion and Chameleon I fields, a block of special tiles that spans the normal survey declination bands were observed multiple times, along with the normal survey tiles covering those regions.
| Region | Type | Area (deg2) | RAmin (deg) | RAmax (deg) | Decmin (deg) | Decmax (deg) | No. Scans | Tiles |
|---|---|---|---|---|---|---|---|---|
| Orion | molecular cloud | ~5 | 83.36 | 84.25 | -12.1 | +0.2 | 25-28 | 100692-100698,103675-103680, 300694-300699,303673-303680, 388692-388698 |
| Chameleon I | molecular cloud | ~4.5 | 165.7 | 169.4 | -80.0 | -73.7 | 12-14 | 328402-328411,329181-329186, 388403-388410 |
| Abell 35581 | galaxy cluster | ~4 | 201.55 | 202.30 | -36.0 | -29.7 | 12-17 | 315822-315826 |
Notes to Table 1
1 - The Abell 3558 field is also covered by 2MASS
Long Exposure (6x) observations
 |
 |
 |
| Figure 4 - Orion: Equatorial Projection | Figure 5 - Chameleon I: Galactic Projection | Figure 6 - Abell 3558: Galactic Projection |
| Color-coded survey depth-of-coverage maps for three heavily observed regions. Each map shows a 17°x17° area. Black denotes single coverage. Light blue indicates two-scan coverage, which is most common in overlap regions between most normal survey scans. Declination overlaps are easily seen as the parallel light blue lines separated by 6°. RA overlaps are not visible on the thumbnails, but only when the figures are viewed at full resolution. The peak coverage is in the central portion of the Orion field, shown in red, which was scanned up to 28 independent times. The position and depth-of-coverage for each field is given in Table 6. | ||
The Survey PSRT and XSRT contain all source measurements extracted from 2MASS 6°-long Survey mode scans that are not found in the All-Sky Release PSC and XSC.
Consequently, the PSRT and XSRT contain a large number of spurious detections that include: low SNR noise excursions, artifacts caused by bright stars such as diffraction spikes and ghost images, transient events such as cosmic ray strikes and meteor trails. In the case of the XSRT, unreliable detections also include sections of large galaxies or nebulae, point sources superposed on diffuse and/or complex backgrounds, and single and multiple stars that are not truly extended sources.
To help discriminate between real source detections and the many spurious extractions in the Survey Reject Tables, each PSRT and XSRT entry has been assigned a reliability score (rel) that is related to the confidence level that the extraction is the detection of real astrophysical object at the time of the 2MASS survey observation, and in the case of the XSRT, that the object is truly extended and not a detection of a fragment of a galaxy or a single or multiple star. In Tables 7 and 8 are listed The fraction of entries in the Survey PSRT and XSRT as a function of reliability are listed in Tables 7 and 8, respectively, for the full tables, and also in four galactic latitude ranges.
i. PSRT Reliability
The overall fractional reliability of the Survey PSRT (i.e. the percentage of extractions in the PSRT that are reliable source detections) is in the range 35% to 53%. Table 7 shows that the PSRT fractional reliability varies strongly with galactic latitude, though. This latitude dependence is really a dependence on source density, and it occurs because a fixed SNR threshold (~3.5) was used for source detection during 2MASS data processing, and the background noise estimator was allowed to adjust dynamically in response to increasing confusion noise levels. At high galactic latitude, where the source density is lowest therefore and confusion noise is lowest, the resulting detection thresholds reach well into the background Poisson noise to maximize completeness. In dense fields, source confusion contributes significantly to the overall image noise and limits measurement accuracy, so the flux level of the detection threshold rises to a conservatively high level resulting in relatively high overall reliability.
| rel | Probability of reliability | Fraction of Total | ||||
|---|---|---|---|---|---|---|
| full-sky | |b|>50° | 30°<|b|<50° | 10°<|b|<30° | |b|<10° | ||
| A | >90% | 0.289 | 0.059 | 0.111 | 0.272 | 0.586 |
| B | 80 to 90% | 0.044 | 0.010 | 0.017 | 0.045 | 0.085 |
| C | 70 to 80% | 0.030 | 0.011 | 0.015 | 0.036 | 0.046 |
| D | 50 to 70% | 0.038 | 0.020 | 0.025 | 0.046 | 0.049 |
| E | 20 to 50% | 0.086 | 0.087 | 0.090 | 0.104 | 0.061 |
| F | <20% | 0.513 | 0.813 | 0.742 | 0.496 | 0.172 |
| Total | --- | 843,988,897 | 150,150,895 | 177,351,787 | 278,198,978 | 238,287,241 |
ii. XSRT Reliability
The overall percentage of Survey XSRT extractions (Table 8) that are reliable is in the range 76% to 88%. This is much higher than the fractional reliability of the PSRT primarily because extended source identification used a "seed" list of point source detections cut at a relatively high SNR level, thereby filtering out most of the low SNR noise extractions. In contrast to the Survey PSRT, the reliability of the XSRT is highest in low source density, high galactic latitude regions, and poorest in high density regions nearer to the galactic plane. This behavior occurs because the most significant contribution to unreliable extended source classification comes from contamination with foreground stars and confusion with multiple stars. Stellar confusion is minimized at high galactic latitudes.
| rel | Probability | Fraction of Total | ||||
|---|---|---|---|---|---|---|
| all-sky | |b|>50o | 30<|b|<50o | 10<|b|<30o | |b|<10o | ||
| A | >90% | 0.723 | 0.907 | 0.849 | 0.964 | 0.387 |
| B | 80 to 90% | 0.069 | 0.026 | 0.030 | 0.151 | 0.123 |
| C | 70 to 80% | 0.019 | 0.008 | 0.013 | 0.030 | 0.046 |
| D | 50 to 70% | 0.046 | 0.044 | 0.067 | 0.054 | 0.035 |
| E | 20 to 50% | 0.074 | <0.001 | 0.014 | 0.180 | 0.182 |
| F | <20% | 0.069 | 0.015 | 0.026 | 0.112 | 0.228 |
| Total | --- | 943,441 | 211,648 | 244,639 | 364,855 | 122,299 |
The photometric and astrometric characteristics of the Survey PSRT and XSRT are similar to those of the All-Sky Release Catalogs. Please see VI.3 and VI.6 for summaries. The lower SNR extractions contained in the Survey Reject Tables WDB will have commensurately larger uncertainties in their photometric and astrometric measurements.
i. Effective Sensitivity
Figure 7 shows the distribution of photometric sensitivities (SNR=10 magnitude levels) achieved for all 2MASS survey scans. The average point source sensitivity level is J=16.4, H=15.5 and Ks=14.8 mag. However, the achieved sensitivities span a range of up to one magnitude among all scans because of differences in atmospheric transparency, seeing and background emission conditions.
The dashed lines in Figure 7 show the sensitivity distributions for scans that were not selected for inclusion in the 2MASS All-Sky Release. Those scans have on average slightly lower sensitivities than those used for the All-Sky Release. Because the Survey Reject Tables contain data from these scans, be aware that those measurements may be of slightly lower accuracy than those from the All-Sky PSC and XSC.
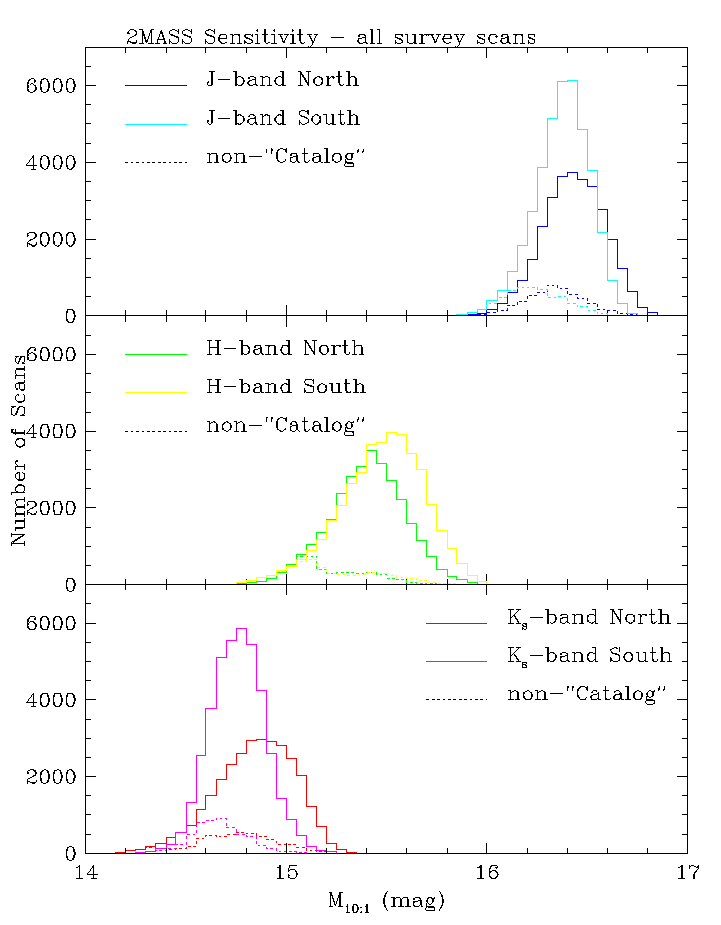 |
| Figure 7 - Distribution of SNR=10 point source sensitivity levels achieved in all 2MASS survey scans, in the absence of confusion. Dashed lines denote subset of scans that were not used for the All-Sky Release Catalogs. |
ii. Detection Limits and Source Counts
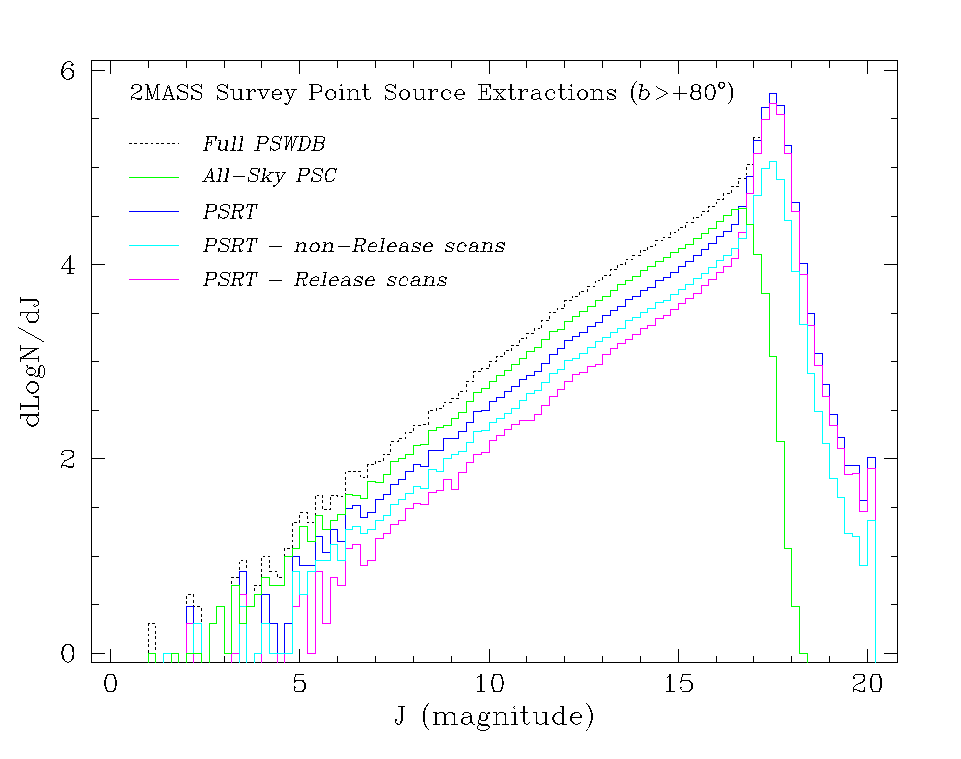
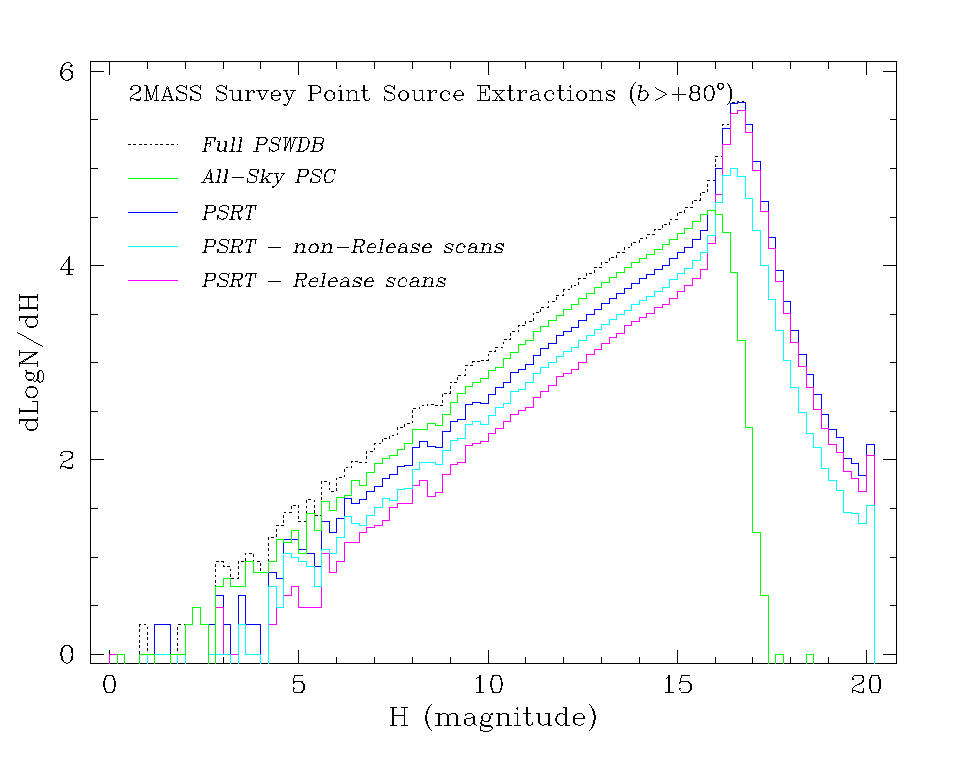
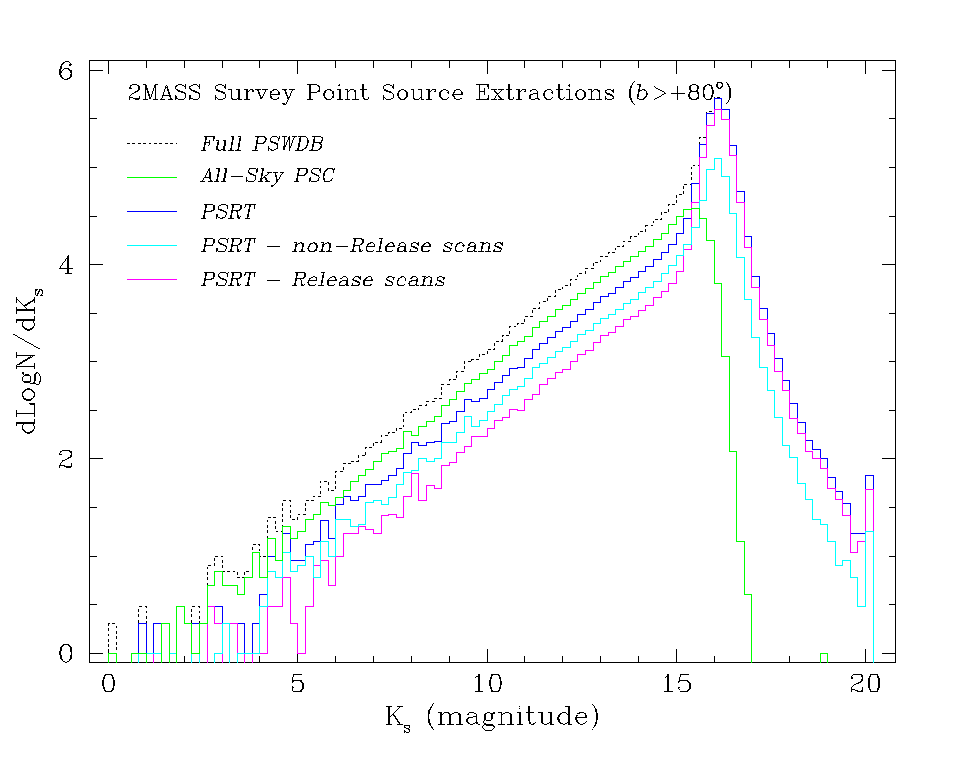
Point Sources
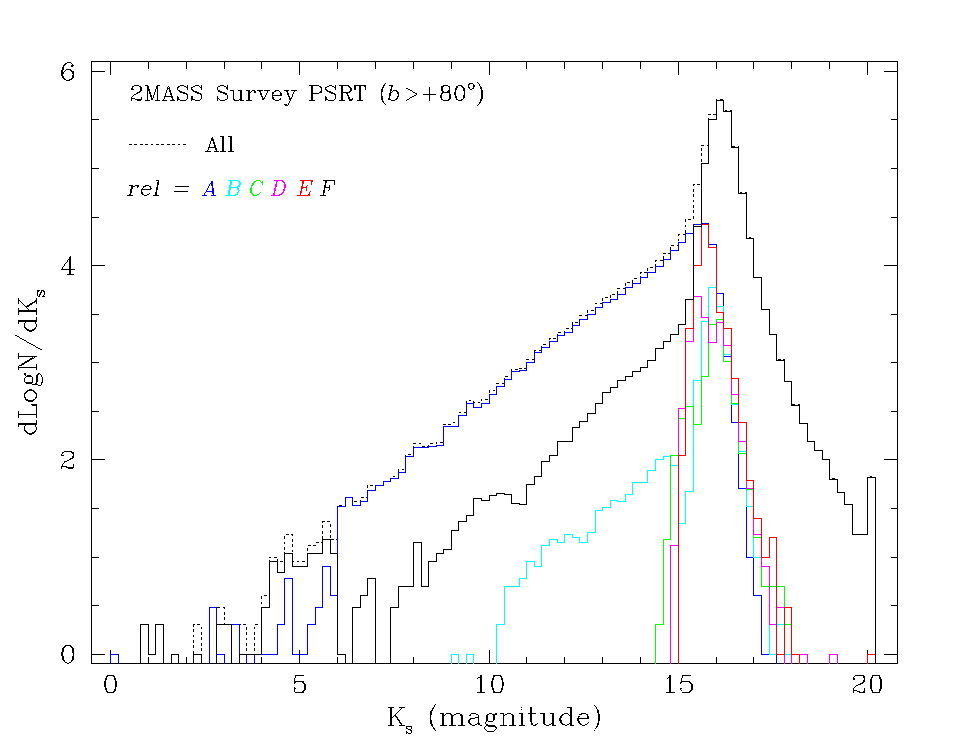
Figures 8-10 show the differential J, H and J, H and Ks source counts for the full Survey PSWDB, the All-Sky PSC and Survey PSRT. The PSRT counts are further decomposed into counts from scans included in the All-Sky Release (denoted "Relese scans" in the figures) and from scans that were not (denoted "non-Release scans").
The Survey PSRT counts parallel those from the All-Sky PSC over much of the brightness range because of the extractions from the many bright source detections in scans not included in the All-Sky Release, and from brighter sources in the overlap regions at the edges of scans that were included in the All-Sky Release. The Survey PSRT counts are distinguished from the those of the PSC by the strong upturn at faint magnitudes, and the inclusion of extractions 1.5-2.0 mag fainter than the PSC. Point sources were detected down to a level of SNR~3.5 during pipeline data reductions. However, the reliability of the faint extractions are generally poor. In order to meet the stringent reliability requirements of the All-Sky PSC, sources were were required to have SNR>7 in at least one detected band, or SNR>5 in three detected bands to be included. Thus, most low SNR extractions remain in the Survey PSRT. Because the reliability of point source extractions drops rapidly with decreasing SNR (A5.2), the low SNR extractions in the PSRT must be used with caution.
Figure 14 shows the Survey PSRT differential Ks-band point source counts in the north galactic cap decomposed by estimated reliability according to the rel flag values. The track of relatively bright, unreliable extractions (rel="F") that parallels the high reliability source counts is produced primarily by bright latent images and other artifacts from bright stars. The small number of rel="B" extractions brighter than Ks=14.5 mag are sources that are not detected in all three bands and that have elevated photometric uncertainties (often due to confusion). The majority of PSRT extractions fainter than Ks~15.5 mag in this region of the sky are spurious detections of noise.
Extended Sources
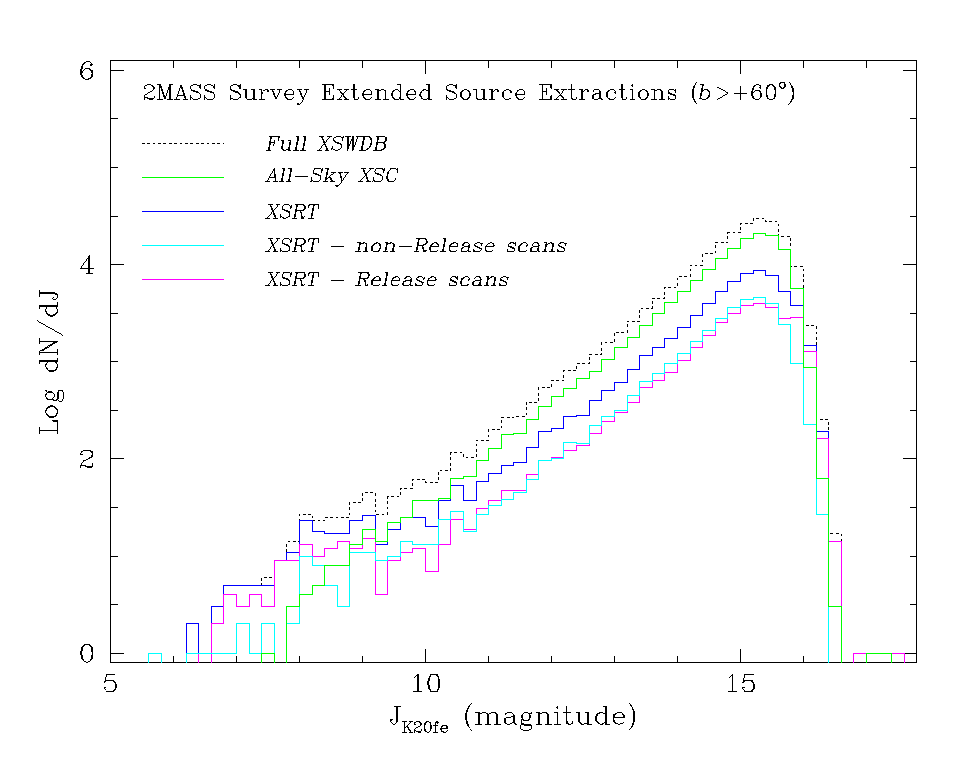
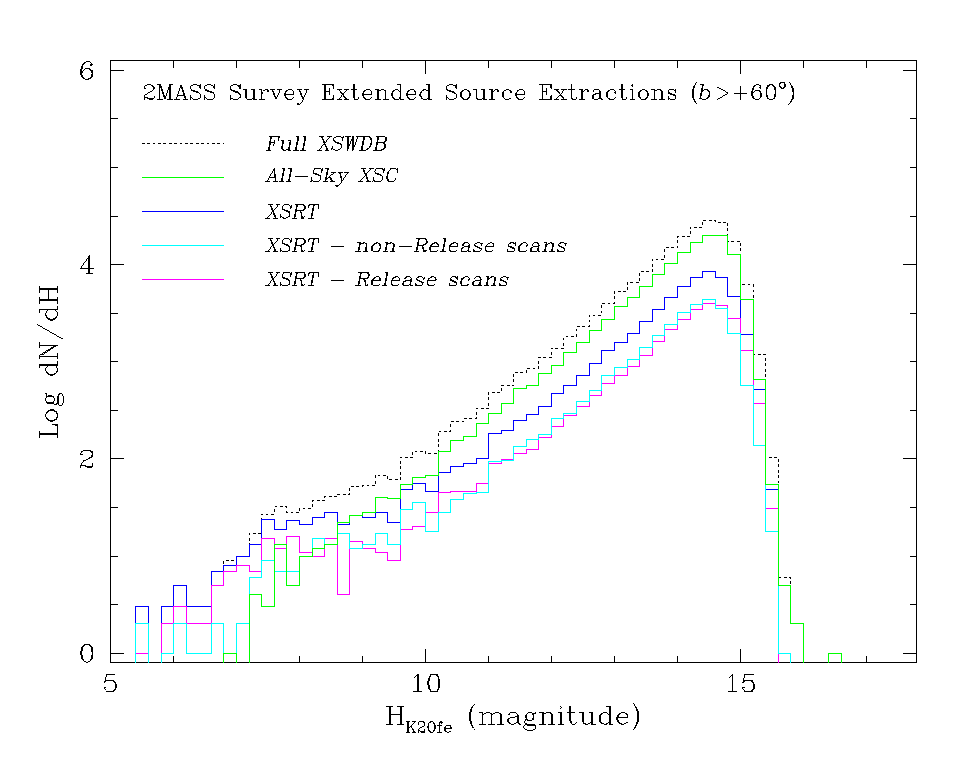
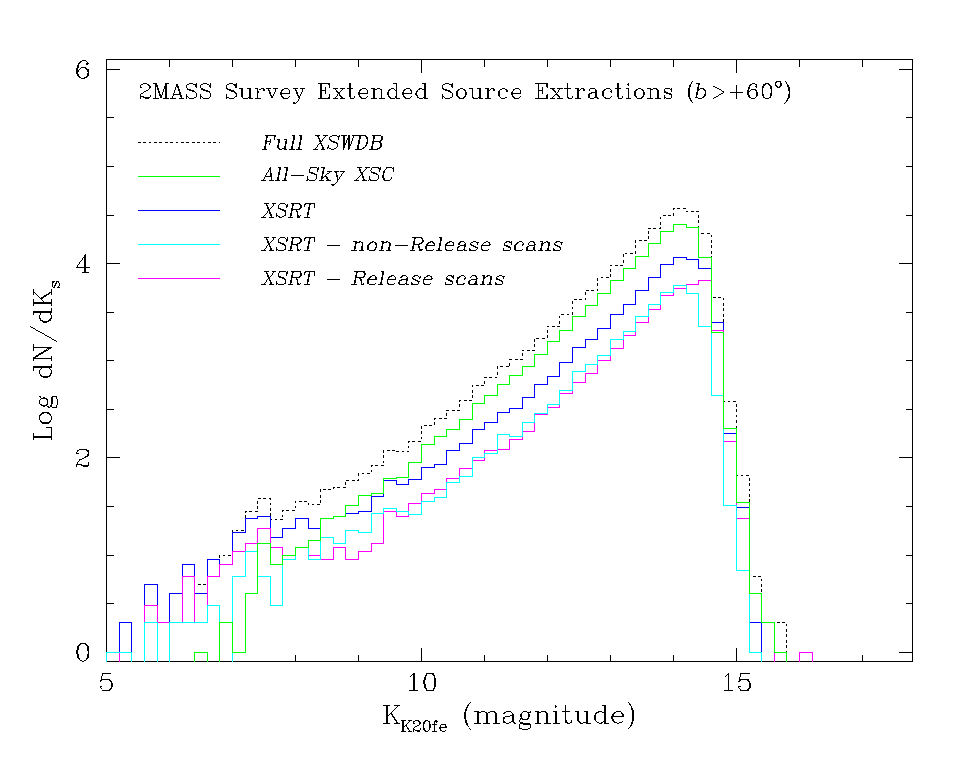
Figures 11-13 show the differential J, H and Ks source counts for the full Survey XSWDB, the All-Sky XSC and Survey XSRT. The XSRT counts are further decomposed into counts from scans included in the All-Sky Release (denoted "Relese scans" in the figures) and from scans that were not (denoted "non-Release scans").
The Survey XSRT source counts doe not exhibit the excess of faint extractions relative to the All-Sky XSC such as that seen in the PSRT because the 2MASS extended source processing was initiated using a "seed" list of relatively bright detections fed from the point source processing. The seed list was limited to sources with point source aperture magnitudes brighter than J<15.50, H<14.75 and Ks<14.25 mag. Hence, most of the unreliable low SNR extractions were not subjected to extended source characterization, and a large fraction of all extended source extractions were selected for the XSC. The XSRT source count distributions generally parallel those from the XSC because of the reliable extractions in the "non-Release" scans and from the edge overlap regions in the "Release" scans. The exception to this is that there are proportionally more extractions at the bright end of the XSRT than in the XSC.
In Figure 15, the Survey XSRT Ks source counts in the north galactic cap are decomposed by estimated reliability (rel). A large fraction of the "excess" bright extended source extractions in the XSRT are unreliable, and are typically associated with large, diffuse image artifacts from bright stars.
 |
 |
 |
| Figure 8 - J-band | Figure 9 - H-band | Figure 10 - Ks-band |
| Differential point source counts as a function of default magnitude in the north galactic cap from the 2MASS Survey PSWDB (black dotted curve), All-Sky PSC (green curve) and Survey PSRT (blue curve) showing the preponderance of faint, low SNR extractions in the PSRT. The components of the PSRT from scans included and not included in the All-Sky Release are shown separately by the magenta and cyan curves. | ||
 |
 |
 |
| Figure 11 - J-band | Figure 12 - H-Band | Figure 13 - Ks-band |
| Differential extended source counts as a function of K=20 mag arcsec2 elliptical isophotal magnitude in the north galactic cap from the 2MASS Survey XSWDB (black dotted curve), All-Sky XSC (green curve) and Survey XSRT (blue curve) showing the preponderance of faint, low SNR extractions in the XSRT. The components of the XSRT from scans included and not included in the All-Sky Release are shown separately by the magenta and cyan curves. | ||
 |
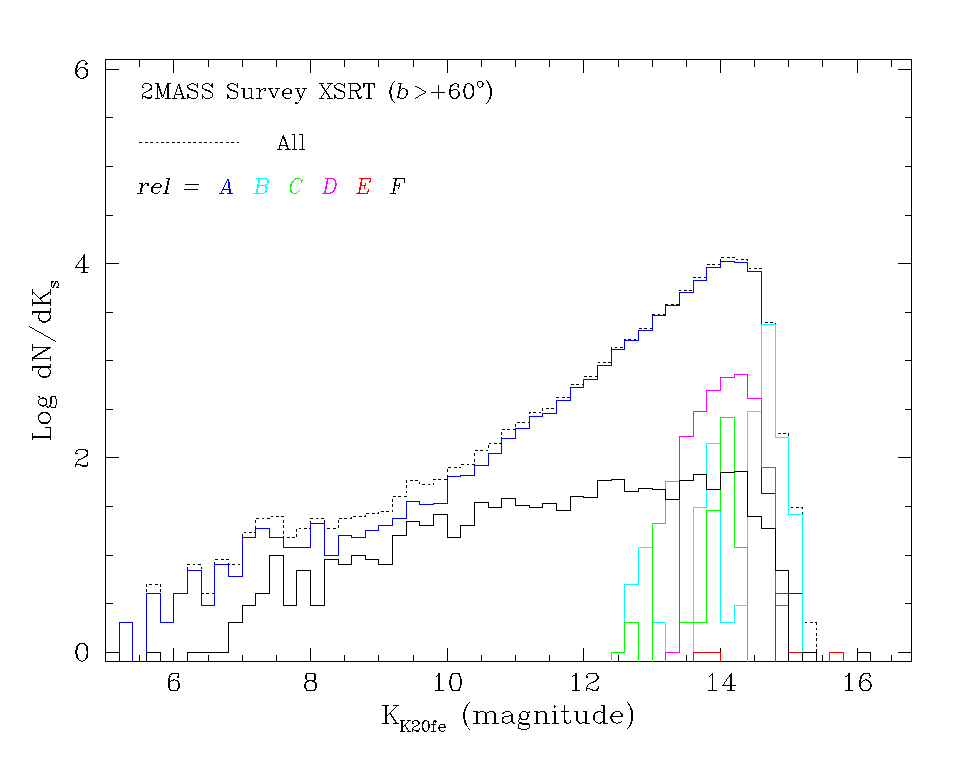 |
| Figure 14 - Survey Point Source Reject Table Ks point source counts in the north galactic cap, broken down by estimated reliability (rel). The bright, unreliable (rel="F") "sources" are typically spurious detections of image artifacts from bright stars. | Figure 15 - Survey Extended Source Reject Table Ks extended source counts in in the north galactic cap, broken down by estimated reliability (rel). The bright, unreliable (rel="F") "sources" are typically spurious detections of large, diffuse image artifacts from bright stars. |
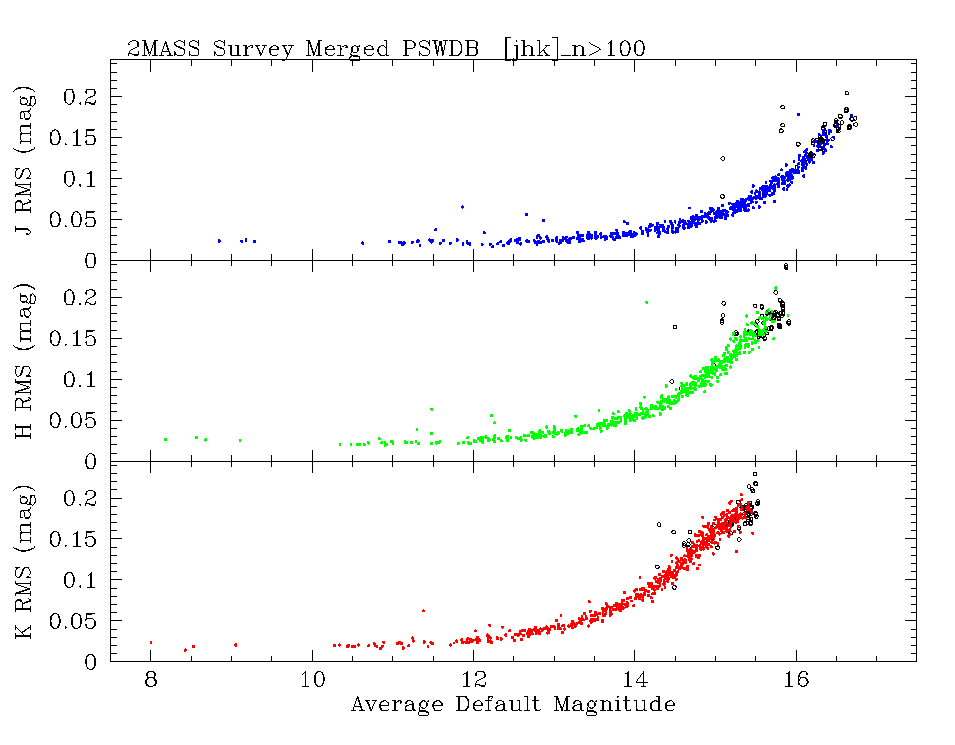
iii. Photometric Repeatability
The multi-epoch measurements in the PSRT and XSRT are used to demonstrate the repeatability of survey source extraction photometry in Figures 16 and 17. In these figures, the root variance (RMS) flux is plotted as a function of the mean magnitude for all point and and extended sources that have at least 100 detections in the full Survey PSWDB and XSWDB (note that at most one detection of each source is the in the All-Sky PSC or XSC, the remainder are in the PSRT or XSRT). The RMS values are computed using statistics accumulated during the generation of the Survey Merged Extended Source Information Table:
for point sources: [JHK] RMS = [jhk]_m_stdev * sqrt([jhk]_n-1)
for extended sources: [JHK]7 RMS = [jhk]_mstdev_7 * sqrt([jhk]_n_7-1)
For high SNR sources, the point and extended source photometry is internally repeatable to within 1-2%. This is consistent with the photometric uniformity of the All-Sky Catalogs discussed in VI.3.a.ii and reflects the stability of the survey's photometric calibration. The photometric dispersion increases monotonically with decreasing source brightness, reaching 10% dispersions at J=16.0, H=15.0 and Ks=14.5 mag for point sources, and J=15.0, H=13.9 and Ks=13.4 mag for extended sources. These 10% dispersion levels are comparable to those achieved for the All-Sky PSC and XSC.
The point source photometric repeatability distributions shown in Figure 16 flatten slightly at the faintest magnitudes. This is a consequence of statistical flux overestimation for low SNR sources, as described in A2.1.c. The flattening is not as noticeable for the extended source distributions in Figure 17 because of the higher SNR thresholds for extended source identification.
 |
 |
| Figure 16 - Root variance (RMS) point source flux for sources in the Survey PSRT detected at least 100 times, plotted as a function of the average brightness. The average magnitudes and RMS values are taken from the Survey Merged Point Source Information Table. The solid points are from non-confused merged groups. Open circles are from confused groups. | Figure 17 - Root variance (RMS) flux in 7" circular apertures for all sources in the Survey XSRT detected at least 100 times, plotted as a function of the average brightness. The average magnitudes and RMS values are taken from the Survey Merged Extended Source Information Table. The solid points are from non-confused merged groups. Open circles are from confused groups. |
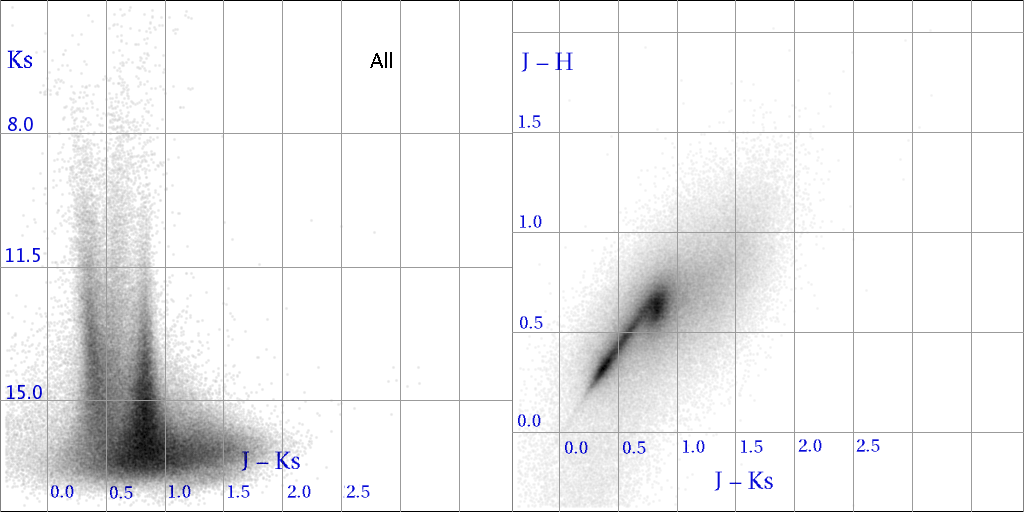
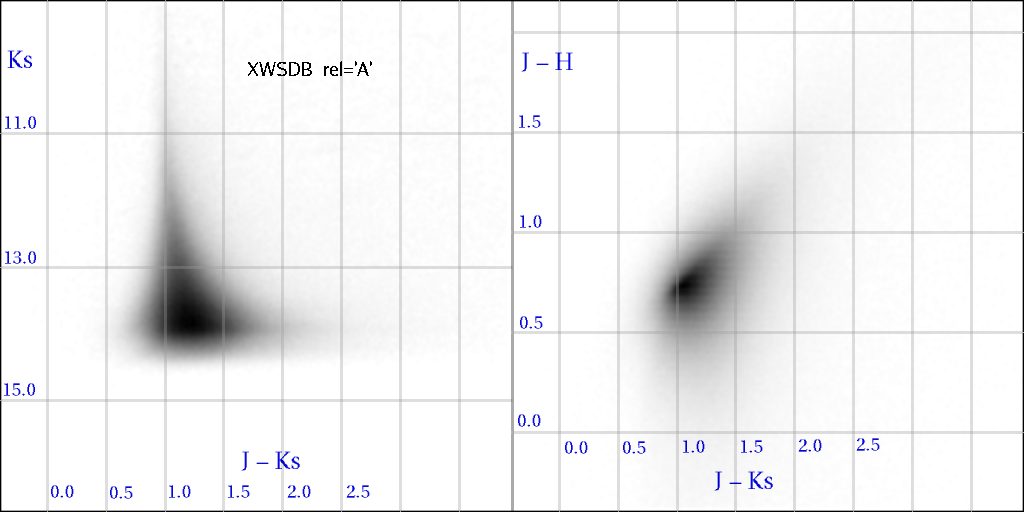
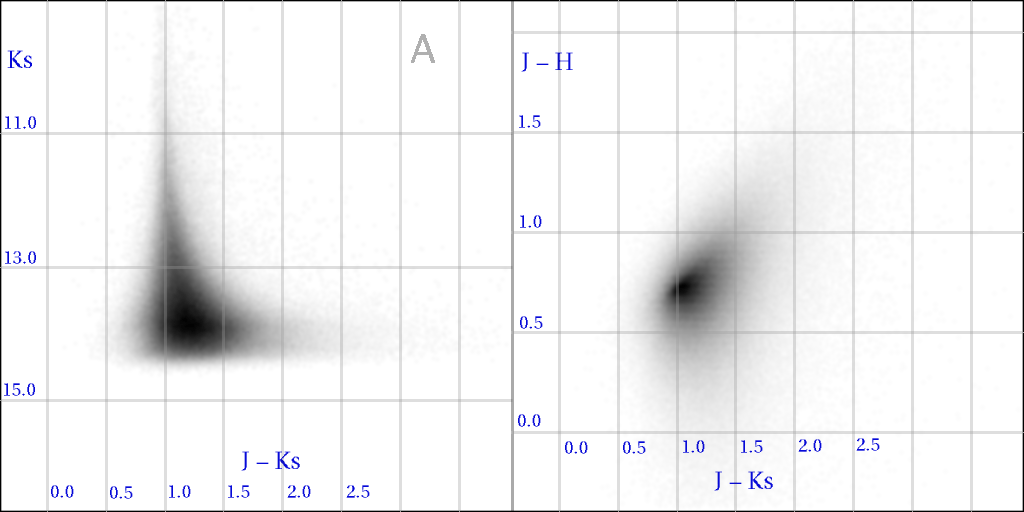
Figure 18 is an animated GIF image that cycles through color-magnitude and color-color Hess diagrams showing three-band detection Survey PSRT extractions located in the north galactic cap. The animations show, in turn, all 3-band extractions, those with the highest degree of reliability (rel="A"), those with lowest reliability (rel="F"). Three-band detected point source extractions generally have the highest reliability (see A5.2. They are assigned a reliability score of rel="A" unless they are flagged as artifact detections in all three bands, in which case they are assigned rel="F".
The color-magnitude and color-diagrams of the rel="A" subset can be compared to those of the All-Sky PSC shown in II.2.b.vii. The vertical spikes in the color-magnitude diagram are due to dwarf stars (left) and giants (right) distributed in apparent magnitude by their varying distance. The spike features broaden with decreasing source brightness because of decreasing measurement accuracy. In the color-color diagram, the sources cluster along the overlapping giant and main-sequence track for stars of spectral earlier type than K5. The "hook" at the red end of this distribution arises from K7/M0 main-sequence stars and cooler. Sources redder than J-Ks=1.0 mag at faint magnitudes are primarily unresolved galaxies. The low reliability, rel="F" extractions in the PSRT exhibit considerable scatter in the diagrams, and have colors that are on average bluer than the main sequence. The small number of bright but unreliable extractions are spurious detections in the image profile wings of very bright stars. Such artifacts were in fact detected at all brightnesses, but fainter examples detected on the 1.3 s READ2-READ1 exposures were effectively filtered out of the source detection list before the production of the PSWDB. Bright examples that were detected on the 51 ms READ1 exposures were not as effectively filtered, and therefore persist as flagged artifacts in the PSRT.
Figures 19 and 20 are animated GIF images that cycle through color-magnitude and color-color diagrams of Survey XSWDB (XSC+XSRT) extractions having reliability scores, rel, ranging from "A" (>90% reliability) to "F" (<20% reliability). These are representative of extractions in the XSRT. Figure 19 contains all XSWDB (XSC+XSRT) extractions and Figure 20 is limited to extractions with |b|>30°.
The rel="A" subsets show the nominal color distributions for 2MASS extended sources which are predominantly galaxies. The sources are dominated by low redshift galaxies with a rest frame J-Ks~1.0 mag color. There is a well-defined locus of sources extending to redder colors along the expected k-correction track, with a small contribution from starburst and Seyfert galaxies. The lower reliability distributions cluster towards fainter magnitudes and exhibit increasing scatter in the color-color plane, as expected for their decreasing SNR. The horizontal "banding" in the color-magnitude diagrams is an artifact produced by the interaction of the different SNR thresholds used in establishing the extended source classification e_score and g_score and in setting the reliability score. The lowest reliability extractions, rel="F", are predominantly foreground stars or spurious extractions of image artifacts, and thus exhibit the largest scatter.
 |
 |
 |
| Figure 18 - (animated GIF) Color-magnitude and color-color diagrams for Survey PSRT 3-band detections with |b|>80°. The animation shows, in order, all 3-band detections, high reliability detections (rel="A"), low reliability detections (rel="F"). | Figure 19 - (animated GIF) Color-magnitude and color-color diagrams for all XSWDB (XSC+XSRT) extractions, grouped by reliability score, rel. | Figure 20 - (animated GIF) Color-magnitude and color-color diagrams for XSWDB (XSC+XSRT) extractions with |b|>30°, grouped by reliability score, rel. |
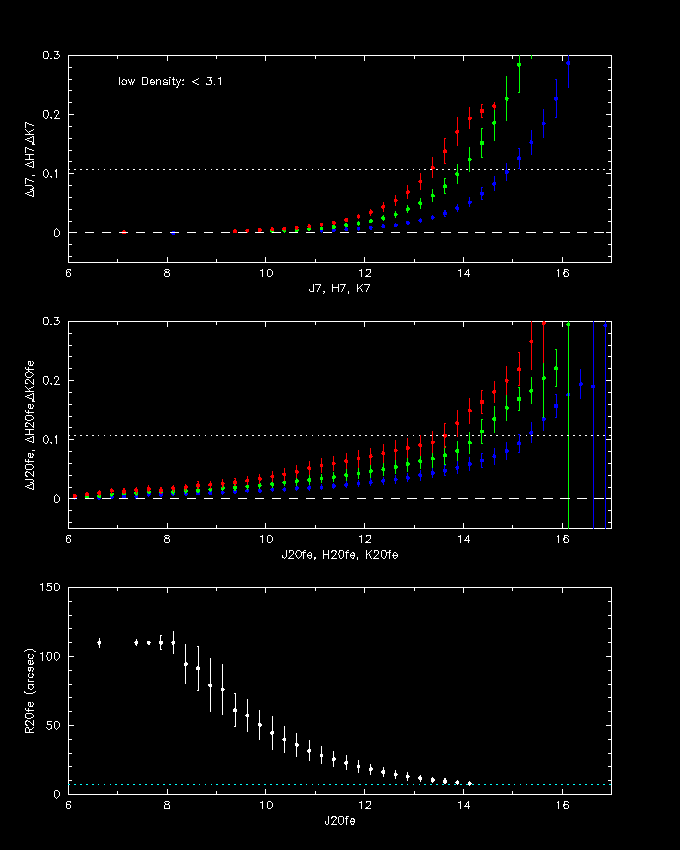
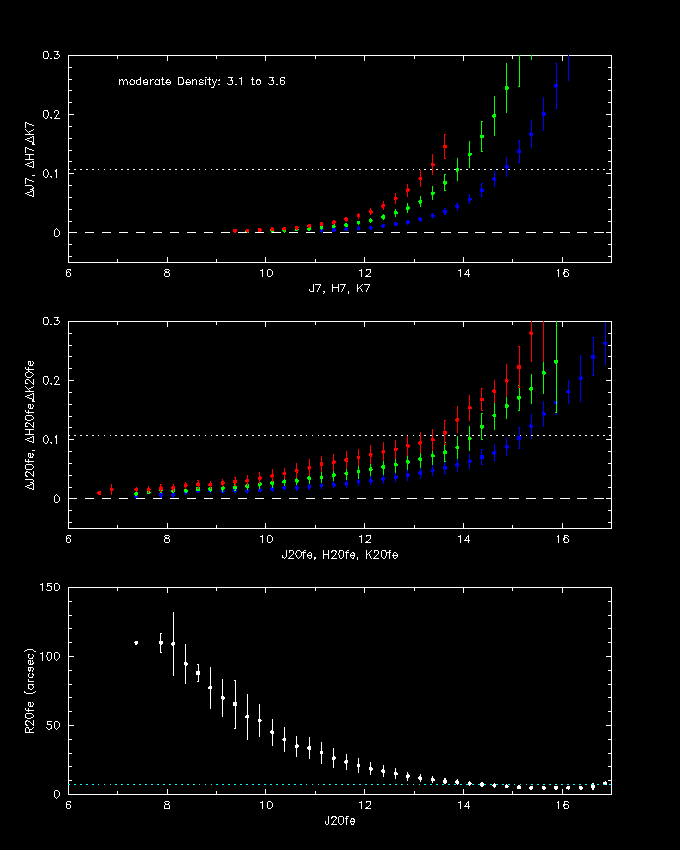
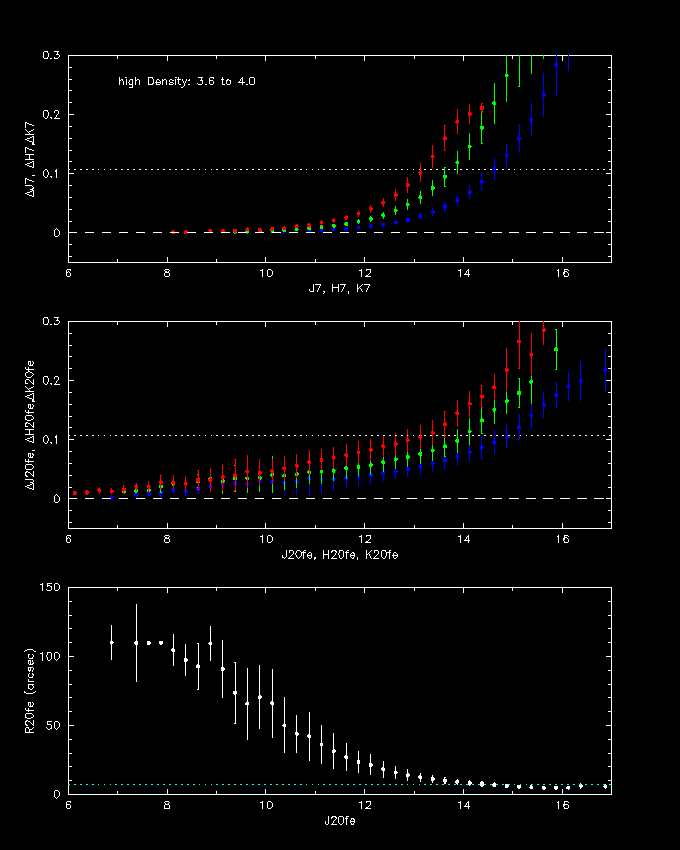
v. Extended Source Average Properties
Figures 21 through 24 show the characteristic photometric properties and sizes of extractions in the Survey XSWDB. In each figure, the top panel shows the mean uncertainty in the fixed, circular 7" radius circular aperture measurements plotted versus magnitude. The middle panel shows the mean uncertainty in the Ks-band fiducial 20 mag arcsec-2 elliptical isophotal aperture photometry plotted versus magnitude. The bottom panel shows the mean measured semi-major axis sizes plotted as a function of isophotal J-band magnitude. The vertical error bars represent the RMS of the uncertainty and size distributions for all extractions in 0.25 mag bins.
|
|
|
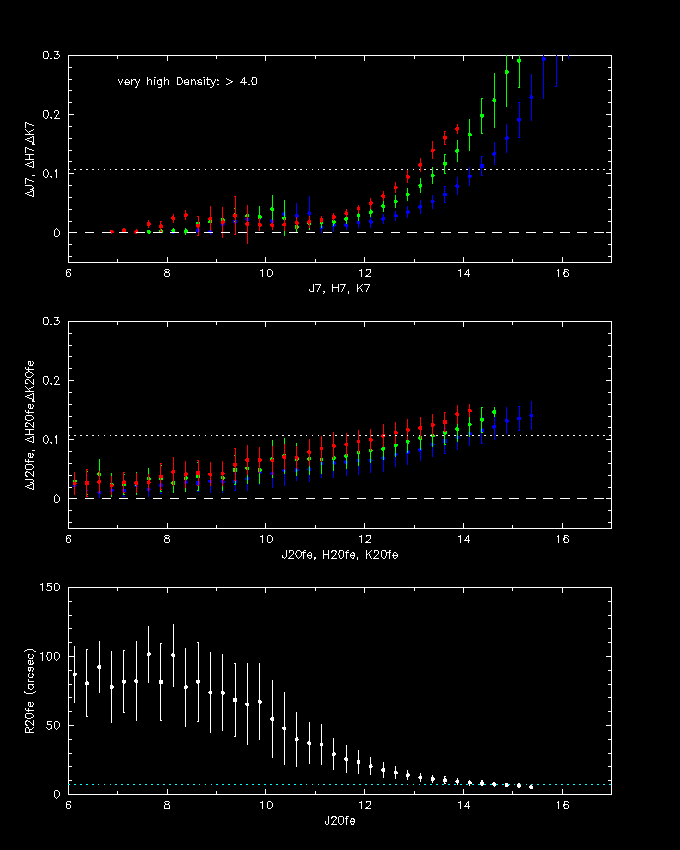 |
| Figure 21 - Low Density (logN<3.1) | Figure 22 - Moderate Density (3.1<logN<3.6) | Figure 23 - High Density (3.6<logN<4.0) | Figure 24 - Very High Density (logN>4.0) |
| Mean photometric uncertainties and semi-major axis sizes in 0.25 mag bins of extractions in the Survey XSWDB, which are representative of the XSRT. Four different foreground stellar source density regimes are presented in the four diagrams, as labeled. J is indicated with blue points, H with green and Ks with red. | |||
[Last Updated: 2007 January 2; by R. Cutri]