The 2MASS Survey, 6x and Calibration observations each covered some regions of the sky multiple times. As a result, the respective extracted point and extended source Working Databases (WDBs) may contain multiple, independent measurements of sources in the multi-epoch coverage areas. Whereas the 2MASS All-Sky and 6x Catalogs contain only one measurement of sources that were detected more than once for uniformity of depth, the Merged Working Database Tables make use of all available measurements to provide improved possible position and brightness information for these objects.
WDB merging was carried out by spatially autocorrelating the extractions in each of the Survey, 6x and Calibration point and extended source Working Databases (WDBs) and identifying groups of independent extractions that are positionally associated. For each associated group, the mean source properties were computed, and coverage and detection statistics accumulated. Each merged group in a specific WDB table has been assigned a unique identifier, gcntr, that is used to link it with the individual WDB extractions that belong to the group. The Merged Source Cross-Reference tables contain listings of the individual extractions associated with each merged group, and group identifiers and confirmation statistics derived from the merging have been added to the WDB entries for multiply-observed extractions. Merging was carried out for each WDB table separately. There was no cross-merging between tables (i.e. the 6x point source WDB was not merged with the Survey point source WDB).
The 2MASS Merged Source Information tables contain the averaged astrometry and photometry in each survey band for multiply-observed sources. The tables also contain a variety of statistics on the observed position and flux distributions that indicate the accuracy of the combined source parameters, and that can be used to identify potentially moving or variable objects. In addition, the Merged Information tables contain source detection statistics that are useful for evaluating source reliability.
The merging process and the parameters derived for the merged sources are described in A6.2. The formats of the Merged Source Information and Cross-Reference tables are described in A6.3. Limitations of the merging process and caveats concerning the merged databases are summarized below in A6.1.b. Users are encouraged to read and familiarize themselves with these cautionary notes.
The merged working databases are intended primarily to be used as a source of improved astrometry, photometry and reliability information for the subset of objects observed more than once during the 2MASS Survey, 6x and Calibration observations. They are not substitutes for the Point and Extended Source Catalogs. The merged databases do not contain data for objects observed only once, so their spatial coverage is not uniform. Furthermore, because the relative depth and coverage of the merged tables is highly non-uniform, the Merged Source Information tables are not a useful resource for large-scale statistical investigations.
The number of entries in each of the Survey, 6x and Calibration point and extended Merged Source Tables is given in Table 1. The number of entries in the Merged Source Information Tables are naturally smaller than in each of the respective WDB tables (see Table 1 in A1.2) because the multi-epoch sightings of each source have been collapsed down to one entry, because only sources detected more than once are included in the Merged Source tables, and because the merging process for each WDB was restricted to extractions that have >50% probability of being real source detections (see A6.2).
| Product | Survey | 6x | Calibration | LMC/SMC Calibration |
|---|---|---|---|---|
| Merged Point Source Information | 165,942,357 | 4,771,737 | 456,480 | 35,278 |
| Merged Point Source Cross-Reference | 396,697,288 | 12,267,173 | 204,143,440 | 4,250,232 |
| Merged Extended Source Information | 406,636 | 30,252 | 2,146 | 101 |
| Merged Extended Source Cross-Reference | 960,841 | 76,636 | 473,971 | 8,660 |
The degree of improvements in photometry and astrometry afforded by the source merging scales approximately as the square root of the number of times a source is detected. Figure 1 and 2 show the frequency distributions of the number of unique detections of a point and extended sources, respectively, within a given WDB, given by the value of sdet in the merged source information tables. The majority of sources in the Survey and 6x WDBs were detected only a few times, and will thus show only modest gains in measurement accuracy. However, there are thousands of sources in the polar regions of the Survey and in the calibration fields that were detected hundreds to thousands of times and will have correspondingly precise photometry and astrometry available.
The improvement in photometric accuracy with increasing numbers of detections is illustrated in Figure 3. Figure 3 shows the standard deviation in of Survey Ks-band measurements of point sources near the equatorial poles plotted versus the number of number of times each source was detected. The vertical spread of points in the diagram is caused by the distribution in intrinsic source brightnesses; brighter objects start out with smaller measurement uncertainties. The measurement accuracy for objects in a narrow range of brightness follows the expected sqrt(N) trend, as illustrated by distributions of bright and faint objects shown in green and red, respectively.
Similarly, the improvement in astrometric accuracy is illustrated in Figure 4 wherein is shown the semi-major axes of the merged position error ellipses (emj_mrg) for point sources in the 90191 calibration field plotted as a function of number of times they were detected. The merged source position error ellipses are computed from the standard deviation of the mean positions from all independent measurements. Again, there is a vertical spread in the distribution of points that is due to the distribution of source brightnesses. The majority of sources are fainter and make up the upper envelope of points that follow the sqrt(N) trend. Sources brighter than J<15.8 (SNR>10 in a single scan) are shown in red, and define the lower envelope that follows the sgrt(N) relationship. The group of outlying points circled in red are discussed below.
 |
 |
| Figure 3 - Standard deviation of Ks measurements plotted as a function of number of times a source is detected for objects near the equatorial poles in the survey merged point source information table. Bright sources are shown in green and faint in red. | Figure 4 - Merged source position error ellipse semi-major axes plotted as a function of number of times sources were detected in the 2,086 scans of the 90191 calibration field. Sources brighter than J<15.8 (SNR>10 in a single scan) are shown in red. The group of outliers circled in red are associated with the nearby M6.5V star LHS 191 whose proper motion led to confusion in the positional merging. |
In Figure 5, the J-H-Ks color-color diagram for sources in the Survey Merged Point Source Information table detected 100 or more times is compared to that for the same sources in the 2MASS Point Source Catalog (single epoch). These field objects are all near the equatorial poles where the survey coverage was deepest. The improved colors from the merged tables show clearly that the majority of objects are stars on or near the main sequence, with a relatively small fraction of galaxies. The most dramatic gains in photometric precision are found in the Calibration Merged Source tables, where thousands of independent measurements are combined. Figure 6 compares color-magnitude diagrams from the Calibration Merged Point Source Information table for sources detected more than 1000 times in the 90067 calibration field (covering the M67 open cluster) and the same sources in the 2MASS PSC (single epoch). The precise CMD from the merged table shows a tightly defined main sequence with a clear turn-off near Ks=11.0 mag, as well as a clearly delineated binary main sequence.
 |
 |
Figure 5 - Color-color diagram from the 2MASS PSC (left) and Survey Merged Point Source Information table (right) for sources detected more than 100 times during the survey. | Figure 6 - Color-magnitude diagram from the 2MASS PSC (left) and Calibration Merged Point Source Information table (right) for objects in the 90067 calibration field detected more than 1000 times. |
The statistics on the flux and position distributions of the associated groups provided in the Merged Source Information tables can be used to assess the quality of the merge, and to identify potentially variable and moving sources. For example, Figure 7 shows the flux distribution chi-squared statistics computed for the merged sources in the 90272 calibration field (observed 1973 times). Most of the merged sources have chi-squared values near unity. However, one very obvious outlier, circled in red in Figure 7, has a very high chi-squared value indicating a flux distribution that is not consistent with the uncertainties in the individual observations. This source is the radio-loud QSO B31456+375 (z=0.33) which shows strong time variability as seen in the light curve shown in Figure 4 of Section A.4.1.
The position error ellipse semi-major axis distribution for the 90191 calibration field shown in Figure 4 has a group of outliers with much larger position residuals than other sources observed a similar number of times. These three points, circled in the figure, are all associated with the nearby M6.5 dwarf star LHS 191. This star has a proper motion of over 1"/year which produced the large position residual in the merged source table. Although LHS 191 was detected in all 2,086 scans of this field, over the source of the survey it moved a distance larger than the 2" correlation radius used in the point source positional merging (see A6.2) which resulted in it being "split" into three confused merged groups. The large position residuals for LHS191 are a direct result of its motion.
The source confirmation statistics supplied with each merged source, the number of times a source was detected and the number of times it was observed (sdet and spos in the merged source information tables) can be used as a reliability indicator. Figure 8 shows the detection fraction (=sdet/spos) for sources in the 3,430 scans of the 90301 calibration field. The roll-off in detection fraction at faint magnitudes is a natural consequence of the diminishing detection completeness with decreasing signal-to-noise ratio of real objects. However, the clusters of "sources" with detection fractions <0.05 at the faint end of the distributions are in fact spurious detections of noise excursions and other features such as image artifacts.
 |
 |
| Figure 7 - Chi-squared values of the merged source flux distribution for objects detected more than 1,000 times in the 90272 calibration field. The outlier circled in red is the highly-variable radio-loud QSO B3 1456+375. | Figure 8 - The ratio of the number of times a source was detected to the total number times it was observed plotted versus the source magnitude in the 3,430 scans of the 90301 calibration field. |
Before using the 2MASS Merged Source databases, users are strongly encouraged to familiarize themselves with the Cautionary Notes to the All-Sky Data Release, and the Cautionary Notes to the individual Extended Mission products in A2.1.b (Survey Reject Files and Full Image Atlas), A3.1.d (6x Databases, Catalogs and Image Atlas), and A4.1.c (Calibration Databases and Image Atlas). The 2MASS Merged Source Tables were constructed using Working Source Databases from each key data set, and so characteristics and limitations associated with those products will be imprinted onto the merged source databases.
The sections below describe features and caveats that are unique to the
Merged Source databases. These sections are intended to supplement
the Cautionary Notes for the individual Survey, 6x and Calibration
databases.
i. Scope of the Merged Source Tables
ii. Limitations of the Merging Process
Only extractions with estimated likelihood of reliability >50% (rel=[A-D]) were included in WDB merging process. Thus, some low SNR extractions of real, multiply-observed sources may be excluded in the merge. In addition, there may be a significant number of unreliable, spurious extractions included in the merge. Such objects are often characterized by low confirmation statistics (sdet<<spos).
Merge association used a relatively simple positional correlation algorithm that is fundamentally limited by source confusion. Confusion can for several reasons:
No attempt has been made to resolve cases in which individual database extractions could be positionally associated with more than one merged group. In these cases, the extractions are allowed to contribute to all of the candidate groups, and the groups are flagged as confused (gcnf>1). For extractions in confused groups, the group identifier, gcntr, that is listed in the WDB entry is the group to which the extraction is closest.
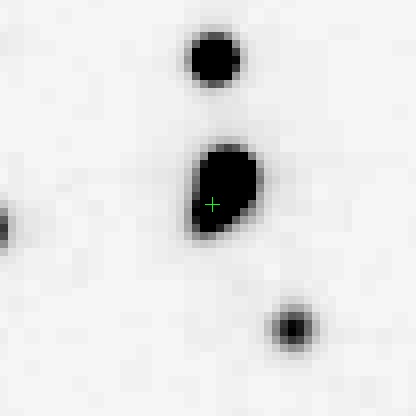
Confused groups often show elevated flux measurement dispersions that may be misinterpreted as signatures of variability. Therefore, it is important to always examine merged gourps that have gcnf>1. For example, Figure 9 shows an image of a close pair of sources observed over 3600 times in the 90067 calibration field. There are two, confused (gcnf=2 entries in the Calibration Merged Point Source Information table near the position of the fainter component of the system, with essentially the same average flux (j_mavg=11.98). However, the RMS of the J-band fluxes is ~0.4 mag, much larger than would be expected from a source that bright. A light curve produced using all extractions in the Calibratio PSWDB within 2" of the merged source position, shown in Figure 10, exhibits a bimodal brightness behavior. The two components of the double have a separation of ~7" and are resolved in most of the observations. Therefore, the flux is normally representative of the fainter component. In a small number of observations the sources are not split. The resulting blended source measurement includes flux from the brighter component resulting in the artificially bright periods in the light curve. When the sources are not resolved, the centroid shifts towards the system's photocenter and is associated with the other detections of the fainter component.
 |
 |
| Figure 9 - J-band image of a close double source in the 90067 calibration field. The image covers an area 52"x52". There are two confused entries in the Calibration Merged Source Information Table at the location marked with the green cross. | Figure 10 - Light curve (magnitude versus relative day number) produced using all extractions in the Calibration PSWDB that are located within 2" of the green cross in Figure 9. The bright magnitudes correspond to observations when the system is not resolved, and the blended flux included light from the brighter component. |
The positional association for point sources used a relatively small 2" correlation radius to minimize confusion. Objects with proper motions large enough to move farther than the correlation length during the 2MASS observational period will not be successfully merged. Merges of the individual detections of fast moving objects (i.e. asteroids) may be missed altogether. Detections of slower moving sources, such as nearby stars, may be split into multiple, confused groups with elevated position dispersions, as illustrated above in Figure 4.
Measurements of faint sources near the 2MASS detection thresholds are affected by statistical flux overestimation bias. This bias results naturally when measuring sources with non-zero uncertainty at true flux densities near system sensitivity limits. Sources will preferentially be detected when noise drives up the apparent flux rather than driving it down. Therefore, sources detected near the sensitivity limit will have, on average, a measured brightness higher than their true brightness, or equivalently a higher SNR than their true value. Such sources will also have measurement errors that do not accurately represent their true SNR. The closer a measured brightness is to the detection limit, the larger the amplitude of the statistical overestimation.
The statistical flux overestimation of low SNR sources is effectively "institutionalized" in the Merged Information Tables because upper limits for non-detections were not included in the computation of the merged group average fluxes. All of the flux and upper limits information is available from the individual extractions of each merged group to compute more accurate merged mean flux estimates. However, the overestimation bias in the individual detections will still be present, and can only be corrected using a statistical adjustment.
Figure 11 illustrates the flux overestimation bias for low SNR sources in the Merged Source Information Tables. In the top panels of this figure, differences between photometry extracted from the very deep, Combined Calibration Field Images of the 90067 field and the average calibration scan photometry from the Calibration Merged Point Source Information Table are shown plotted as a function of average magnitude. The Combined Calibration Images have an effective sensitivity approximately four magnitudes fainter than the single scans and are therefore are free from bias at the flux limits of the individual scans. The bottom panels of Figure 11 show the RMS (root variance) of the merged calibration scan photometry plotted as a function of average magnitude.
Statistical flux overestimation is seen beginning at J>16.3, H>15.2 and Ks>14.7 mag. Reading down to the bottom panel, these magnitudes corresponds to SNR~8-9. By SNR=7, the flux overestimation is nearly ~0.05 mag, and rises steeply exceeding 0.2 mags at SNR=5. This behavior agrees well with the bias predicted from simulations in V.3.a.ii.
The RMS vs. magnitude curves in the bottom panels of Figure 11 begin to flatten below SNR~7. This is also a manifestation of incompleteness and flux overestimation. At low SNR levels, sources are not detected when noise fluctuations drive the flux down. This effectively truncates the faint end of the measured flux distribution leading to an artificially narrow distribution and hence an artificially low flux uncertainty and biased flux estimate.
 |
| Figure 11 - Illustration of statistical flux overestimation as a function of magnitude and SNR in the merged point source photometry of the 90067 calibration field. (top panels) Difference in J, H and Ks magnitudes measured on deep, combined calibration scan images and the average magnitudes from single calibration scans plotted as a function of average magnitude. (bottom panels) RMS (root variance) of merged (average) calibration scan magnitudes plotted as a function of average magnitude. Red horizontal lines indicate SNR=5,7 and 10 levels. |
iii. Position Reconstruction Errors
The reconstructed astrometry of two of the 1,582 scans of the 90009 Calibration Field had errors that resulted in positional offsets of 5-15" with respect to all other scans. The affected observations are scan 106 taken on 05/15/1999 and scan 102 taken on 05/18/1999, both from the southern observatory (scan_key values of 26284 and 25081, respectively). The astrometric errors in these scans are described in AIV.1.c.i.
Because the source extractions from these scans were included in the
Calibration point and extended source WDBs, they were
incorporated into the merge of those tables.
Most of the extractions in these two scans were not properly associated
with the extractions from other scans
because of the large position offsets.
If they appear in the Calibration merged source tables at all,
the extractions from these two scan may appear as merged sources with
a small number of detections offset from the
remaining merged sources. In some cases, there may have been
coincidental matches between the real source detections in the
two offending scans and spurious noise detections in the scans
that did not have position errors.
A variety of parameters and flags are provided with each entry in the Merged Source Information table to help users assess of the accuracy of the association of extractions and the ensuing combined positions and photometry. These flags are described in A6.2.v, and a few of the key ones are summarized below. Users are strongly encouraged to examine the merge quality flags when using the merged tables.
Use of the ce_flg=0 constraint is conservative, and may result in the rejection of many uncontaminated groups. This is particularly true for groups containing thousands of independent measurements, such as those in the Merged Calibration WDBs, because the probability is relatively high that one or more measurements may be affected by the conditions tracked by ce_flg.
[Last Updated: 2008 February 18; by R. Cutri]