VI. Analysis of the Release Catalogs
3. Global Photometric Properties
a. Point Source Catalog
ii. Photometric Uniformity
Executive Summary
The 2MASS Level 1 Science Requirements specifies that point
source photometry will exhibit <4% deviations or biases in
spatial uniformity. The All-Sky Release PSC easily meets the
Level specification.
This specification is driven by the concern that drifts in calibration at
small spatial frequencies might lead to inference of spurious features using
star count analyses.
We estimate that the PSC exhibits <1-2%
global photometric variation in calibration, which will make it a major
resource for studies of Galactic structure.
This is demonstrated:
Each of these tests are discussed briefly below.
Zero Point Stability
Spatial uniformity is imposed on 2MASS photometry on the largest
scales by the Survey's photometric calibration strategy.
Nightly photometric transformations are derived from hourly measurements
of one of 35 calibration fields. The fields are distributed on
approximately two hour centers in RA at declinations of approximately
-30°, 0° and +30°.
The equatorial fields were often observed from both observatories
on the same night.
Thus, the photometric system is tied between the 2MASS observatories by
referencing all photometry, in part, to measurements of the
same standard stars.
The nightly photometric transformations are derived by fitting
the difference between the instrumental and "true" brightnesses
of a networks of 958 standard stars contained in 35
calibration fields, as a function of time. With the Survey
observations calibrated against the nightly transformations
derived from the spatially distributed network of calibrators,
the achieved spatial uniformity
is limited primarily by the internal consistency of magnitudes
of stars in the network.
The standard star "true" magnitudes were derived using a
procedure that derived the set of
photometric solutions to each night's calibration measurements
that minimizes the overall variance of the solutions for
all observations
((Nikolaev et al. 2000, AJ, 120, 3340).
This global  2 minimization procedure
used the database of between 600 and 3500 standard star measurements
accumulated over the Survey.
It is sensitive to small (<1%) systematic changes
photometry around the sky, and provides a test of the
internal stability of the derived calibrations.
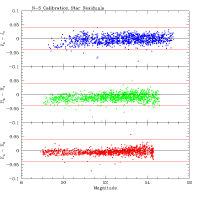
Figures 1,
2 and
3 show the magnitude residuals between
standard stars
observed from both observatories on the same night, extracted during
the
  2 minimization process, plotted as a
function of brightness, right ascension and declination.
We observe the self-consistent tie between the North and South to be at
the <1.5% level (which is close to the limits of our analysis), well
within the 4% photometric spatial uniformity requirement.
There are a few measurement differences that
fall outside the 4% tolerances, but all are related to random
contamination of individual measurements, rather than systematic
trends in the photometry.
 |
 |
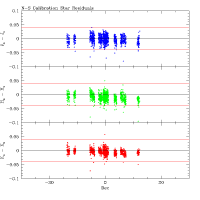 |
Figure 1
N/S mag Differences vs. Magnitude |
Figure 2
N/S mag Differences vs. RA |
Figure 3
N/S mag Differences vs. Declination |
Calibration Stars Measured in Survey Observations
Each of the 958 2MASS standard stars was observed during
normal Survey scans, and they are listed in the PSC.
Thus, they can be used as test particles to
examine the uniformity of the calibrations that were applied
to the PSC. This analysis is discussed in detail in this
memo.
The results are summarized here.
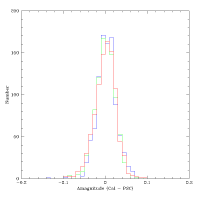
Figure 4 shows histograms of the
differences between the "true" magnitudes
(Mcal) and PSC magnitudes (Mpsc)
for all the calibration stars.
The mean and RMS magnitude differences (Mcal-Mpsc)
in each band are given in Table 1. Statistics are given for the
full ensemble of stars, and also broken out for stars observed from the
northern and southern observatories.
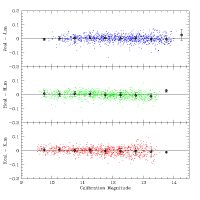
Figure 5 shows the magnitude
differences for each star
as a function of "true" magnitude. The small points are
the differences for individual stars, while the large black points
are the mean and RMS differences in 0.5 mag bins.
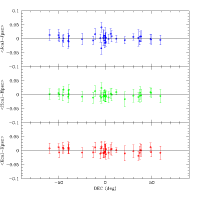
Figures 6 and
7 show the mean and RMS magnitudes
differences for all stars in each calibration field as a function
of the field right ascension and declination.
Figure 8 shows the
magnitude differences as a function of survey day number.
In Figure 8, the small points are the
differences for
individual stars, and the large colored points are the mean and RMS
differences for all stars in two-day bins.
There
is no measureable net difference between true and PSC magnitudes for
the full ensemble of standards, or from the observations from each
hemisphere. There are no biases larger than 1-2% between
the "true" and PSC photometry as a function
of source brightness or time. The most significant outliers are the
associated with the standards in the two fields which lie
deep in the Galactic Plane. Their influence is diluted on the
net calibrations, since they were always observed with
several other fields on any given night.
As with the global calibration analysis, measurements of individual
stars sometimes fall outside
the 4% range, but these are always associated with contamination of
the individual measurements, rather than with systematic effects.
The one standard deviation levels of the mean photometric difference
distributions in all three cases is <0.02 mags, well within
the Level 1 Requirement for spatial uniformity.
Table 1 - Mean and RMS Magnitude Differences For Calibration Stars
| | All | | North | | South | |
|---|
| Band | < Mcal-Mpsc > | RMS | < Mcal-Mpsc > | RMS | < Mcal-Mpsc > | RMS |
|---|
| J | +0.0018 | 0.0241 | +0.0015 | 0.0214 | +0.0019 | 0.0256 |
|---|
| H | -0.0010 | 0.0233 | -0.0015 | 0.0238 | -0.0007 | 0.0230 |
|---|
| Ks | -0.0005 | 0.0252 | -0.0031 | 0.0246 | +0.0010 | 0.0253 |
|---|
 |
 |
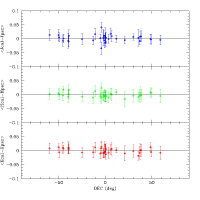 |
Figure 4
Mag Residual
Histograms |
Figure 5
Mag Residuals vs. Brightness |
Figure 6
Mag Residuals vs. RA |
 |
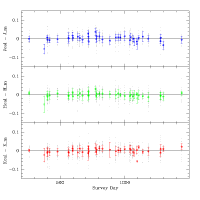 |
Figure 7
Mag Residuals vs. Dec |
Figure 8
Mag Residuals vs. Time |
Tile Overlap
Each 2MASS survey Tile overlaps adjacent Tiles by ~1 arcmin
in right ascension and ~8.5 arcmin in declination. Sources falling
in the overlap regions are observed multiple times during the Survey,
and photometry is extracted from each of these measurements.
Because the time separating observations of adjacent Tiles
ranged from ~7 min up to ~3 yr, and because
adjacent Tiles were sometimes observed from different observatories,
the comparison of photometry from each apparition of these multiply-detected
sources probes photometric uniformity both on a variety of timescales
and between observing systems.
During the process of selecting which apparition of
multiply-detected sources that
would be used in the PSC (duplicate source resolution),
sources from adjacent scans in the Tile overlap regions were positionally
associated and their extracted magnitudes were compared. The mean
photometric offsets for all high signal-to-noise (SNR>20) sources
common to each scan pair were computed. The mean and standard
deviation photometric differences for scan pairs
that contain at least 100 SNR>20 sources in the overlap regions
are presented in Table 2. Statistics for three different
sets of scan pairs are presented.
The column labeled FSky contains the statistics
for all scan pairs in the Survey. The column labeled N2N
gives the statistics for only scans pairs in which the adjacent
Tiles were observed on different nights. Finally, the column
labeled Hemis gives the statistics for all scan pairs
in which the adjacent Tiles were scanned from different observatories.
The mean photometric offsets between Tiles for all sets are <0.01 mag.
Moreover, the dispersion in the offsets is <0.02 mags, indicating
that the photometric precision of the point source photometry is
excellent.
Table 2 - Mean and Standard Deviation Photometric Offsets of
SNR>20 Sources
in Tile Overlaps Regions (Counts >100)
| Band | N2N | Hemis | FSky |
|---|
| Mean Delta Mag | Std | Mean Delta Mag | Std | Mean Delta Mag | Std |
|---|
| J | +0.0004 | 0.019 | +0.0086 | 0.019 | +0.0025 | 0.014 |
|---|
| H | -0.0003 | 0.017 | +0.0005 | 0.018 | +0.0040 | 0.015 |
|---|
| Ks | -0.0002 | 0.017 | -0.0038 | 0.017 | +0.0001 | 0.014 |
|---|
Global Color Variations
The science driver for the 2MASS point source photometric uniformity
requirement is the objective to use star count and color analysis
to measure structure in the Milky Way, study stellar populations
and variations thereof, and to infer estimates of extinction over small
spatial scales. The spatial variations intrinsic to the data acquisition
and processing ultimately limit the precision with
which such studies can made.
An analysis has been carried out to probe the intrinsic color variations
of the PSC; full details are available in this
memo.
In this analysis, the color changes in for sources
having a narrow J-H color range
(0.30 J-H
J-H 0.34), chosen
empirically from the 2MASS color-color diagram to be blueward of the giant
branch. This population, therefore, emphasizes the extended solar
neighborhood. The center of this color range corresponds to an
early G dwarf (e.g.,
Bessell & Brett 1988, PASP, 100, 1134). Sources were selected from
the PSC that have the highest photometric quality (ph_qual="AAA"),
no photometric confusion or association with image artifacts,
and that were in the non-saturated regime of the 1.3 s R_2-R_1 exposures
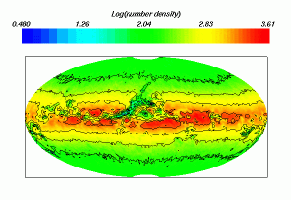
(rd_flg="222"). Figure 9 shows the
mean source counts
in equal area spatial bins for this sample, in Galactic
aitoff projection, and demonstrates the effect of low and moderate
latitude reddening and extinction on number counts.
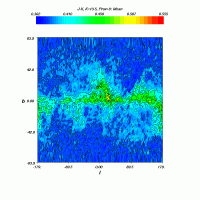
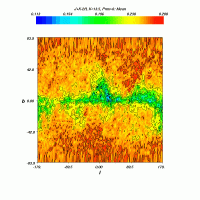
Figures 10,
11 and
12 show the spatially-binned mean
J-Ks, H-Ks and (J-H)-(H-Ks) colors
of the sample in Galactic Cartesian projections, respectively.
The latter is roughly perpendicular to the reddening vector, so
should best reveal any systematic non-reddeding color changes in the PSC.
Figure 13 shows the root sample
variance in J-Ks color in an Equatorial Cartesian
projection. Analysis of these figures show:
- The survey does not have any internal systematic color drifts
larger than 1%. The observed color variations across the
sky are consistent with those expected from Galactic extinction.
- There is a feature in the root variance of J-Ks
at the 0.01-0.02 mag level that corresponds to the declination
boundary separating regions of the sky observed from the two 2MASS
observatories.
- It should not be a surprise that accurate modeling of global Milky Way
stellar structure will require detailed attention to the extinction
and reddening model.
 |
 |
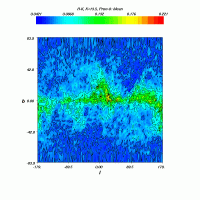 |
Figure 9
Number Counts |
Figure 10
Mean J-Ks Color |
Figure 11
Mean H-Ks Color |
 |
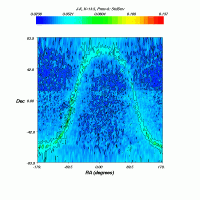 |
Figure 12
Mean (J-H)-(H-Ks Color |
Figure 13
Std Dev in J-Ks Color |
[Last Updated: 2003 January 27; by R. Cutri, M. Weinberg and S. Wheelock]
Return to VI.3.
 2 minimization procedure
used the database of between 600 and 3500 standard star measurements
accumulated over the Survey.
It is sensitive to small (<1%) systematic changes
photometry around the sky, and provides a test of the
internal stability of the derived calibrations.
Figures 1,
2 and
3 show the magnitude residuals between
standard stars
observed from both observatories on the same night, extracted during
the
  2 minimization process, plotted as a
function of brightness, right ascension and declination.


 J-H
J-H


