Source merging within each of the individual 2MASS Working Database (WDB) tables first required finding all available detections of objects in regions of the sky that were observed multiple times. Once groups of associated detections were identified, then the independent measurements were combined to provide refined photometry and astrometry.
WDB merge processing for the 2MASS Extended Mission was performed using the Working Auto-Correlation software (WAX; Monkewitz and Wheelock 2005, in "Astronomical Data Analysis Software and Systems (ADASS) XIV," ASP Conference Series Vol. 347, p148; P.L. Shopbell, M.C. Britton and R. Ebert, eds. ) WAX was designed specifically for efficient operation on very large data sets allowing partitioning of the sky into declination-ordered bands for enabling parallel operation. Detailed documentation for WAX is available on-line at this link..
Independent measurements of the positions of an inertial source will be spread over a small error because of natural measurement errors. The degree of spread is primarily a function of source signal-to-noise ratio, but can also be increased by systematic astrometric calibration errors, and confusion with nearby sources and transients such as cosmic rays and hot pixel events impinging on a source image. If the true position of a source was known a priori, then finding all available detections of it within a given WDB table would simply require searching a region around that position that was large enough to cover the expected spread in the individual sightings. Of course, a priori positions are not known, so WAX employed a detection density-directed search to identify spatially associated groups of extractions.
WAX processing began by making a pass through a WDB table to compute for each entry the centroid and density of a provisional group of extractions that lie within a specified angular distance from the initial entry, ri. The density is defined as the number of other extractions that fall within the search region, and the centroid is the average position of all provisional group members. For this step, relatively small matching radii, ri, were used: 1" for point source tables and 2.5" for extended source tables. These limits produced high reliability groupings at the expense of missing some real group members.
Next, the WDB entries were sorted into decreasing density order forming a queue of possible seeds. Final groups were then constructed from the queue of seeds as follows:
The density-ordered use of seeds is akin to peak finding in source detection algorithms, but results in extremely poor WDB access patterns (both to disk and in memory data). The algorithm therefore traverses the input data multiple times in spatial order, generating groups around the seeds encountered according to the following rules:
These rules result in identical output to the basic in-density-order algorithm described above, regardless of the order in which seeds are actually considered.
In some circumstances, the merging algorithm assigned an extraction to more than one group. These extractions, and the groups containing them, are said to be confused. The grouping algorithm employed is conservative: if a detection can be associated with more than one group, then it is allowed to do so, and that detection and all of its containing groups are flagged as confused. No attempt was made to resolve confused groups to avoid introducing biases.
The group identification process lays down a set of sometimes overlapping circular regions on the sky, and is thus figuratively called the "swiss cheese" algorithm. Figure 1 illustrates the "swiss cheese" algorithm, and shows how confusion can arise. Panel (a) in the upper left shows the distribution of source extractions in a small region of the sky that was observed multiple times. Each one of these extractions has an associated density and centroid computed from the first pass of WAX processing. The first group is identified in panel (b) having the highest density of any of the extractions, and all of the extractions in that group are removed from the list of seeds. The second group is found among the remaining seeds in panel (c), and its members are removed from the seed list. In panels (d)-(f), groups are generated around the remaining seeds that can incorporate extractions already assigned to another group.
|
| Figure 1 - The "swiss cheese" algorithm for identifying spatially associated groups of extractions in the 2MASS WDBs operating on a small region of the sky. (a) The raw extractions. (b-c) The first and second groups are generated. Unprocessed extractions are drawn in blak, unconfused extractions and groups in light grey. (d-f) As more groups are generated, confusion - drawin in dark grey - appears. (from Monkewitz and Wheelock 2005) |
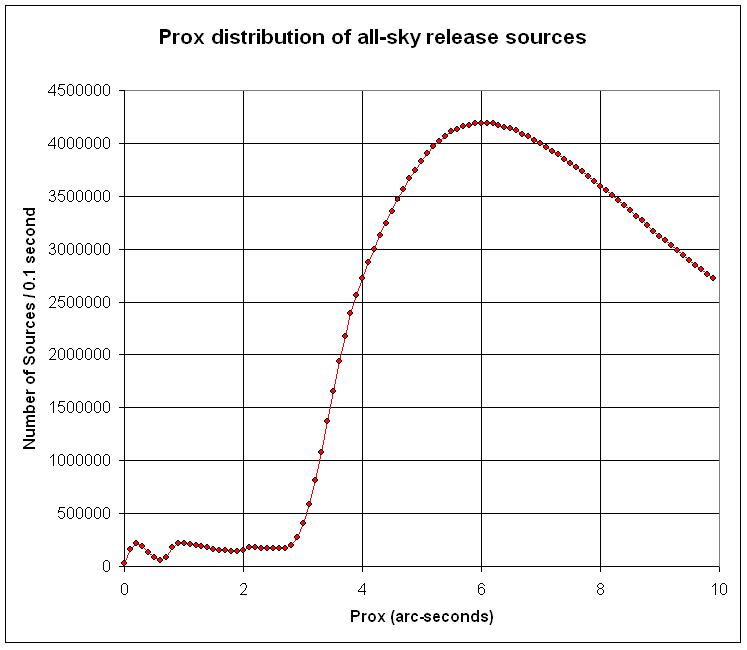
The angular separation limits used to generate the final associated groups, rf, were 2" for the point source tables and 5" for the extended source tables. These limits are large enough to recover virtually all possible detections of sources, but not so large as to be badly contaminated by detections of nearby sources. Figures 2 and 3 show details of the distributions of the nearest-neighbor distances (prox) from the 2MASS All-Sky PSC and XSC, respectively. The rf values were selected to be slightly less than half of the size defined by the separations at which the prox distributions turn over sharply. For extended sources, rf was selected to be equal to the point at which the prox distribution drops to a constant, near zero level. A slightly more conservative (i.e. smaller) limit was adopted for point sources because the internal position residuals measured in scan overlap regions is typically <1" (see Figure 14 of Section I.6.b). The number of single (non-merged) extractions, unconfused merged groups and confused merged groups produced by merging a section of the 6x point source WDB using a range of matching radius values, rf, are shown in Figure 4. The broad minimum in the number of confused merged groups seen in the bottom panel shows that a matching search radius of 2" provides the best balance between source detection completeness and nearby source confusion.
 |
 |
 |
| Figure 2 - The nearest neighbor distribution (prox) for all sources in the 2MASS PSC. | Figure 3 - The nearest neighbor distribution (prox) for all sources in the 2MASS XSC. | Figure 4 - The number of point source single extractions (top), unconfused merged groups (middle) and confused groups (bottom) produced as a function of merging separation radius, rf. |
The WAX spatial auto-correlation process described above produced a set of associated groups of extractions for each WDB table. Each associated group was assigned a group identifier (gcntr) that is unique within a given WDB table. The 2MASS Merged Point and Extended Source Cross-Reference tables provide a link between the group and the individual WDB extractions that comprise it. For each associated group, the Cross-Reference tables contain a set of lines that give the group identifier followed by the identification number of the individual extraction in the respective WDB table (pts_key/cntr or ext_key/cntr) and the number of groups of which that particular extraction is a member. The number of lines in the set is equal to the number of extractions in the group. The format of the Merged Source Cross-Reference tables is described in A6.3.c.
In regions of the sky covered repeatedly by many 2MASS scans, such as the equatorial poles and the calibration fields, there is a high probability of chance associations between spurious noise extractions and between real detections and noise extractions. To minimize the potential of contamination by spurious extractions in the merging process, only WDB entries with >50% probability of being real source detections (rel MATCHES '[A-D]') were input to WAX.
The impact of pre-filtering of the WDBs before merging is illustrated in Figure 5. This is an animated GIF that cycles through five panels showing the J-band image of a 5'x5' region near the north celestial pole (00h+89°54') from a single 2MASS survey scan. The first panel shows just image. In the second panel, red points show the location of all Survey point source WDB extractions in a 6' radius circular region centered on the field. The depth of coverage of survey scans ranges from ~45 near the lower right of the image to over 400 in the upper left, and is reflected in the gradient of the essentially randomly distributed noise extractions. The third panel shows in green the location of the extractions with >50% reliability probabilities. Note that the filtering does not remove all spurious extractions, but greatly reduces the apparent surface density. The resulting merged groups are shown by the large blue circles in the fourth and fifth panels. There are a few merged groups that do not correspond to any obvious source in the J-band image. Most of these are unreliable merges characterized by very low sdet/spos ratios. In a few cases, there are real sources that are detected on the H and Ks images.
Limiting the merge processing to WDB entries with >50% reliability probability has two consequences. First, not all unreliable extractions are filtered out, so there can still be a few chance associations resulting in merged sources that are not real objects on the sky. The merged groups that do not correspond to any obvious source in the last panel of Figure 5 are examples of this. Most of these are characterized by very low sdet/spos ratios. Second, pre-filtering the WDBs excludes some real but low SNR source detections from the merge processing. Consequently, some multiply-detected faint source may have artificially low confirmation rates (sdet/spos), or they may be omitted from the Merged Source output tables altogether. It is always a good idea to search the search the full WDB tables in the vicinity of faint sources of interest to determine if there are other detections available that were not captured in the merge.
 |
| Figure 5 - Animated GIF image showing J-band image from a single 2MASS Survey scan of a 5'x5' region near the north celestial pole. (A) shows just the image. (B) shows in red the location of all survey point source WDB extractions in the region. (C) shows in green the WDB extractions with >50% probability of being reliable, (D) same as (C), but adding the Merged survey point sources as blue circles. (E) shows just the merged point source locations. |
The second phase of WAX processing computed the refined or merged positions and brightnesses and an assortment of statistics for each associated group that contained more than one extraction using the individual measurements of the group members. The refined parameters for each merged group are contained in the point and extended source Merged WDB Source Information tables. A detailed listing and description of the column in the Merged Information tables is given in A6.3. The following sections describe how refined parameters were computed.
The group identifier has also been added to the WDB record for each group member so that it is easy to see when additional measurements of an object may be available. In confused cases where a WDB extraction has been associated with more than one group, the value of gcntr assigned to the WDB entry corresponds to the group with mean position closest to the position of the extraction.
This value is carried in the WDB record of each group member.
This value is carried in the WDB record of each group member
Refined position estimation for the groups were computed using the equatorial positions and uncertainties (where available) of all group members.
For the 2MASS Survey and 6x point source Merged WDBs, updated positions
and uncertainties were evaluated using Gaussian refinement
incorporating the covariance matrix of the individual
extractions,  i:
i:
 |
(Eq. A6.2.b.1) |
where X and Y correspond to right ascension and declination. The refined coordinates of the merged group, Xr, Yr, are given by:
 |
(Eq. A6.2.b.2) |
where, r is the merged
position covariance:
 |
(Eq. A6.2.b.3) |
from which the components of the merged position error ellipse, emj_mrg, emn_mrg and ean_mrg, are derived.
Position uncertainties are not available for the 2MASS extended source WDBs, and those in the 2MASS Calibration point source WDB are not suitable for computing a reliable covariance because of the addition of a constant "floor" value (A4.4.b). For these WDBs, the merged group position is the simple average of the positions of the individual extractions. The dimensions of the merged position uncertainty ellipse are given by the standard deviation of the mean positions on each axis. The semi-major axis is assigned the value of the larger of the uncertainties on each axis, and the semi-minor axis the smaller of the two values. The position angle is set to 90° if the ra uncertainty is larger or 0° if the dec uncertainty is larger.
For the merged point source WDBs, the maximum radial separation from the mean position of any group member is given by sep_mxfmr. The radial distance separating the two members of a group having the earliest and latest observation dates, respectively, is given by sep_jdmax. These two parameters may be useful for identifying merged groups that exhibit source motion or that otherwise have aberrant position distributions.
The extended source Merged Source Information tables do not contain the sep_mxfmr and sep_jdmax columns.
 2
statistic computed using the ensemble of group member positions is given
by chisq_grp2d. The radial separation from the
mean group position of the group member that has the largest
individual positional 2 value,
chisq_mx2d, is given by sep_mxrad.
2
statistic computed using the ensemble of group member positions is given
by chisq_grp2d. The radial separation from the
mean group position of the group member that has the largest
individual positional 2 value,
chisq_mx2d, is given by sep_mxrad.
Note that the chi-squared statistics are computed only for the 2MASS Survey and 6x point source Merged Source WDBs. Those values are always "null" in the Calibration point source WDBs. The extended source Merged Source Information tables do not contain these columns.
The photometry for each associated group was combined band-by-band. Within a given band, the mean and weighted mean brightnesses were computed using the subset of detections that satisfied the following quality criteria:
Because upper limits for non-detections were not included in the flux refinements for each band, the merged brightness for faint sources near the 2MASS detection threshold will by systematically overestimated. This essentially "institutionalizes" the flux-overestimation bias that exists in the single measurements of low SNR sources in the WDB.
All brightness computations were performed in flux units. Extraction magnitudes were converted into flux units, mean fluxes and statistics were evaluated, and then the results were converted back into magnitudes, where appropriate.
 r-2 =
sum[i-2] ).
For point sources, this is computed
using the "default magnitudes"
and their uncertainties ([jhk]_m).
For extended sources, this is computed
using the photometry and uncertainties in the 7" circular aperture
([jhk]_m_7) and
the Ks=20 mag arcsec2 elliptical fiducial isophotal
apertures ([jhk]_m_k20fe).
If there is only one
detection available in a band, then its magnitude and uncertainty
are reported. This column is null if there are
no measurements available in a band.
r-2 =
sum[i-2] ).
For point sources, this is computed
using the "default magnitudes"
and their uncertainties ([jhk]_m).
For extended sources, this is computed
using the photometry and uncertainties in the 7" circular aperture
([jhk]_m_7) and
the Ks=20 mag arcsec2 elliptical fiducial isophotal
apertures ([jhk]_m_k20fe).
If there is only one
detection available in a band, then its magnitude and uncertainty
are reported. This column is null if there are
no measurements available in a band.
Figures 6-8 illustrate how the combined photometric statistics can be used to identify candidate variable sources. Distributions of selected J-band merged source statistics taken from the Survey Merged point source table in a 5 deg2 region in the Orion Trapezium region are shown in the figures. Carpenter, Hillenbrand & Skrutskie (2001 AJ, 121, 3160) identified 1,235 variable stars from an analysis of the 18-26 repeated 2MASS survey observations of this region. These variables are indicated with white points in Figures 6-8, and are clear outliers in each of the distributions.
 |
 |
 |
| Figure 6 - Standard deviation of the mean J-band brightness (j_mstdev) plotted versus average J-band magnitude for stars in the Orion Trapezium region scanned 18-26 times during the 2MASS survey. The white points highlight variable stars that were identified in the study of Carpenter, et al. 2001 AJ, 121, 3160). | Figure 7 - J-band chi-squared (j_m_chisq) plotted versus average J-band magnitude for same Orion stars shown in Figure 6. Color-coding is the same. | Figure 8 - Largest negative n-sigma deviations from the weighted average J-band magnitudes (j_mndev) plotted versus weighted average J-band magnitude for same Orion stars as shown in Figure 6. Color-coding is the same. |
The Merged extended source Information tables contain refined elliptical isophote fit parameters that are computed using the ellipse parameters of each individual extraction in the associated groups. The ellipse size, shape and orientation values for a given extraction were used only if they are all not null.
The following parameters and flags are provided with each merged source to help with assessment of the accuracy of the association of extractions and the ensuing combined positions and photometry.
The merged combined photometry and/or astrometry of merged sources with gcnf>1 should be used with caution. You are strongly encouraged to examine each of the detections comprising the merged group, and surrounding groups that are available in the respective WDB tables to determine for yourself if there are better possible combinations.
This flag is carried in the WDB record of each group member.
Users are encouraged to examine the individual quality flags and photometry of the individual extractions in the group for any merged source entry that has a non-zero value for ce_flg.
[Last Updated: 2006 November 13; by R. Cutri, S. Wheelock, S. Monkewitz, J. Carpenter]