The source selection criteria for 2MASS Catalog Generation, described in the following sections, are designed to draw from the Working Databases lists of reliable sources with accurate photometry and positions. Because reliability and completeness trade directly, though, the criteria have been tuned so as not to compromise the completeness of the Catalogs.
Point sources are required to be >10´´ from Tile edges, and
extended sources must be >15´´ from Tile edges to be candidates for
passing from the Point and Extended Source Working Databases to
the respective Catalogs. For this purpose, a Tile Edge is defined
to fall along the great circles interpolated between the four
Tile corners that are listed for each Tile in the Release
in the Scan Information Table.
These safety boundaries serve three purposes:
a. Tile Edge Boundaries

|
| Figure 1 |
 |
 |
 |
 |
Figure 2 | Figure 3 | Figure 4 | Figure 5 |
Sources selected for the All-Sky Data Release
source catalogs are required to satisfy the following band-detection
and and signal to noise ratio (SNR) criteria:
Must have a valid measurement in at least one band (rd_flg="1","2" or "3") SNR >7 in at least one
detected band
For the PSC, the SNR threshold must be satisfied by
either the SNR derived from the measurement uncertainty
of the default magnitude (see IV.4d;
SNR = 1.0857 / [jhk]_cmsig)
or the scan SNR
([jhk]_snr).
The latter ensures
that bright sources with poor quality photometric measurements
are not inadvertently omitted from the Release.
For the XSC, the SNR threshold must be satisfied by either
the 20 mag arcsec-2 isophotal fiducial elliptical
aperture measurement uncertainty
([jhk]_msig_k20fe),
or the 7´´ circular aperture measurement uncertainty
([jhk]_msig_7),
where SNR = 1.0857 /
i. Reliability
The source detection thresholds used in 2MASS pipeline processing
(cf. IV.4a)
are set to SNR~3.5 to ensure that the completeness requirements
of the Survey are met. The SNR thresholds given above are
intended to limit the contents of the Catalogs to reliable sources, per
the 2MASS reliability requirements.
Reliability, in this context, refers to a detection that corresponds to a real
source on the sky, but that may suffer from some flux-overestimation bias
(see below).
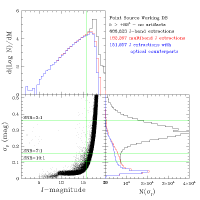
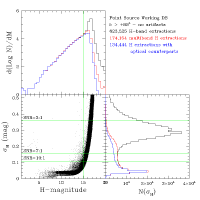
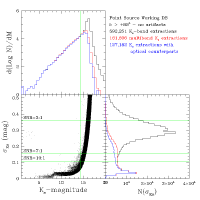
The effect of the SNR thresholds are illustrated in Figures
6, 7
and 8.
These Figures show J, H and Ks detection and measurements
statistics, respectively, for all point sources in the WDB with
b>+85°.
The three panels in each figure show, counterclockwise
starting from the upper left: a) the differential source
count curves (dlogN/dM) curves; b) source photometric measurement
uncertainty plotted versus the default magnitude; and c) histograms
of sources as a function of photometric uncertainty.
The horizontal green lines in the
bottom two panels indicate the equivalent SNR=10, 7, and 3 levels.
Two indicators of reliability for high latitude point sources
are detection in more than one band (particularly for
and H and Ks) and association
with an optical source from the Tycho 2 or USNO-A catalog (cf.
IV.4f).
The red and blue
curves in the upper left and lower right panels show
the distributions for multi-band detections and sources with optical
counterparts, respectively. The distribution of
putatively reliable multi-band detected sources
begins to fall-away from the distribution of all sources
for SNR levels below 7; this is well above the nominal
detection threshold of SNR~3.5 indicated by the peak in
the uncertainty histogram near
A powerful 2MASS source reliability indicator is multi-band detection.
Most spurious detection triggers such as the bright star
halos and diffraction spikes, meteor trails, cosmic rays, hot pixels, etc.
produce "sources" that do not bandmerge (see IV.4e).
Bright star persistence and dichroic glint detections do tend to bandmerge,
but are also the most reliably identified in scan processing
(see IV.7).
From a purely statistical standpoint, three-band sources are generally
highly reliable, two-band sources
are slightly less reliable, and single-band sources are the least reliable.
Therefore, three-band-detection is used, together with a lower SNR threshold to
augment the PSC with fainter sources that are still highly reliable.
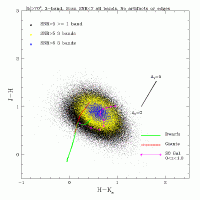
As an example of this, Figure 9 shows the J-H vs. H-Ks color-color
diagram for a sample of low SNR sources in the PSC in the north and south
Galactic caps. Black points represent sources
with 5 < scan SNR < 7 in at least one band,
yellow points
have 5 < Scan SNR < 7 in 3 bands, and the blue
points have 6 < scan SNR < 7 in 3 bands.
The green, red and
magenta overlays show
the loci of colors expected for dwarf and giant stars, and
S0 galaxies ranging from 0 < z < 1.0. The colors of the
high latitude, low SNR PSC sources are consistent with those of
unresolved galaxies with redshifts of a few tenths.
The 2MASS PSC and XSC contain sources with
with SNR < 5 in some bands, because
a higher-SNR measurement in one or two bands will "pull along" fainter
detections in the other band(s).
b. SNR and Detection Limits
AND
[ have SNR >7 in at least one
detected band OR (SNR >5 AND be detected in all three bands) ]
 mag.
The circular aperture measurement SNR is included because isophotal
magnitudes cannot always be reliably extracted for extended sources,
because of contamination by foreground stars.
 ~0.3 mag.
The SNR~7 threshold occurs at a flux level brighter than
the peak and roll-over in the dlogN/dM curves.
Therefore, the SNR>7 thresholds do not compromise the
completeness requirements for 2MASS. The vertical
green lines in each figure show the
magnitudes brighter than which the Level 1
Requirements specify the 2MASS Catalogs shall be >99% complete.
| 
|  |
 |
| Figure 6 | Figure 7 | Figure 8 | Figure 9 |
ii. Flux Overestimation Bias
The second purpose of the SNR thresholds for the All-Sky Data
Release is to filter out sources from the PSC and XSC
which are most affected by flux overestimation bias. This bias is a
natural consequence of selecting a flux-limited sample of sources with
non-zero measurement uncertainties. A source with an intrinsic brightness
near the sensitivity limit of a measurement
is more likely to be detected
if noise drives up the measured brightness, as opposed to driving it down.
Therefore, sources detected near the sensitivity limit will
have, on average, a measured brightness higher than their true brightness,
or equivalently a higher SNR than their true value. Such sources
will also have measurement errors that do not accurately represent
their true SNR.
The closer a measured brightness is to the detection limit, the larger
the amplitude of the statistical overestimation. A simulation based on pure
Gaussian noise statistics (see
V.3a)
shows that the flux overestimation is ~10% at the SNR~5 level, and
still 5% at the SNR~7 level,
but diminishes rapidly for brighter sources. Because the noise is rarely
Gaussian, this is a lower limit for the expected flux overestimation.
The flux overestimation bias is especially troublesome
for distributions in which the number of sources
rises rapidly with decreasing brightness, such as most
astronomical source distributions. There are more sources
fainter than a detection threshold than brighter, so
more sources are scattered above the threshold than
will be scattered below it. Therefore, at low SNR, sources
will "pile up" in the faintest magnitude bins, causing
an apparent excess in source count curves. This effect is clearly
seen in the dlogN/dM curves for all WDB point sources
in Figures
6, 7
and 8.
Because of its statistical nature, it is impossible to avoid this
bias entirely, but limiting the Catalogs to higher SNR sources
minimizes its impact.
Because they do not persist on the sky, transient events, such as
cosmic ray strikes, residual meteor trails and hot pixel events,
cause spurious detections in only one out of the six (and occasionally
seven) frames covering a particular spot on the sky.
Most isolated single-frame "events" and meteor trails are
filtered out during
production of the Atlas Images (IV.3), and
this avoids spurious detections from them.
However, cosmic ray strikes near
true sources, those affecting many pixels (i.e., grazing hits),
and a few residual meteor trails do persist into the coadded Atlas Images,
and will therefore trigger spurious detections.
These spurious sources can have any brightness from the saturation limit
down to the faint detection limit.
To filter out these spurious detections, candidate PSC sources
that are brighter than J < 14.5, H < 14.0, or
Ks < 13.5 mag (SNR > ~25) and
that are not saturated on the 51 ms Read_1 exposures
are required to satisfy the following frame detection criterion:
OR
The source must have non-saturated detections in the all three bands
on the 1.3 s Read_2 exposures
(rd_flg="222")
AND it must have been measurable on 2 frames
AND detected
with SNR>3 on both of those frames.
i. Low Frame Coverage
The number of frame coverages of a source position, Mb,
can be less than six or seven for several reasons, including:
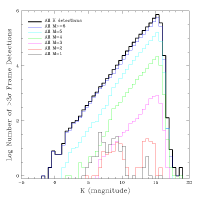
Figure 10 shows the
Ks band differential count curves for all
point sources in the WDB with |b|>70° that
satisfy the edge distance and SNR requirements, given above.
The distributions for sources with MK>6, MK=5,
MK=4,
MK=3, MK=2 and MK=1 are shown
in different colors, as specified on the figure. The great majority
of sources are measurable in >6 frames. The distribution of sources
measurable in MK=5, 4 and 3 frames are well behaved.
The distribution changes significantly at MK=2.
Most of the brighter sources (Ks<10.5 mag)
in the one and two frame coverage curves are spurious detections
around bright stars.
For reliable measurements in the PSC, we require that a source
should have at least one detected band for which there are
at least three usable coverages of a source (Mb>2). Sources
with at most two usable coverages in any band are selected
only if they are detected and measured cleanly in all three
bands on non-saturated in the 1.3 s R_2 exposures
(rd_flg="222").
ii. Minimum Number of Frame Detections
The minimum frame detection threshold required for PSC sources
is based on the premise that one- or two-frame detections of
high SNR sources are highly improbable, and are most likely
spurious detections of transient events.
A source can fail to have a >3-
The most common of these occurrences is the first one, and it is
why frame-detection thresholds are applied only
to sources brighter than J < 14.5, H < 14.0, or
Ks < 13.5 mag. This is also the reason why
reliable, but faint, sources can have Nb=0. The
second occurrence listed above is why the frame-detection thresholds
are not applied to any source that is saturated
on the 51 ms R_1 frames.
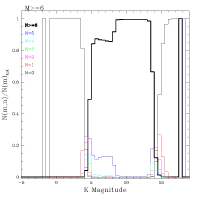
Figure 11
shows the fraction of sources with six frame coverages
having different numbers of >3
c. PSC - Frame-Detection Limits
The frame detection statistics for point sources are compiled in
the ndet parameter.
Ndet is a six character flag
(NJMJNHMHNKMK)
that gives for each band the number of frames on which the
source was detected at >3 in aperture photometry
(IV.4c), Nb, and
the number of frames which were available for measurement, Mb.
Thus, the frame detection thresholds are also referred to
as the "N-out-of-M" criteria.
 detection in the
aperture
measurements on individual frames for the following reasons:
 frame
detections, plotted as a function of Ks magnitude
for the same |b|>70° sample shown in
Figure 10. Sources
with missing frame detections are clustered around the
R_1 and R_2-R_1 saturation levels, and the fraction
of missed detections increases towards fainter
magnitudes. The "plateau" of bright NK=5 detections
(shown by the blue curve)
for 5 mag < Ks < 8.5 mag is not caused by large
number of missing 51 ms R_1 frame detections, but is due to an accounting
error in how the number of measurable frames was tabulated
when masked pixels were encountered for those sources.
 |
 |
| Figure 10 | Figure 11 |
i. The e_score and g_score Limits
Candidate sources for the All-Sky Data Release XSC are required to have:
The Extended Source WDB contains candidate objects selected to be extended with respect to the observed point-spread function within a Tile. These candidates are a combination of resolved objects, galaxies and nebulae, and "false" extended objects, primarily close multiple stars. As discussed in Section IV.5, further classification of objects in the Working Database using an "Oblique Decision Tree" (IV.5) which incorporates three radial extent attributes, three symmetry attributes and four photometric attributes, assigns a confidence score to each band for a source. The final scores are SNR-weighted average of the three wavelength band scores, the e_score and g_score. The e_score is tuned to finding any resolved sources, and the g_score is optimized to identify galaxies among the candidates, using color information. A point source has e_score=2.0, while a clearly resolved source has e_score=1.0.
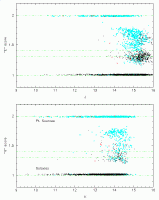
The upper panel of Figure 12 shows the e_score for extended source candidates from the Working Database plotted as a function of the integrated J magnitude The classification of each source in this figure was determined using either visual inspection of optical or non-2MASS infrared imaging data, or with spectroscopy. Verified galaxies are denoted by filled white circles, double stars by red triangles and higher multiples of stars by cyan cross symbols. Galaxies cluster in two places, either at an e_score of 1.0 or around 1.1 - 1.4 at the faint end (J~14, Ks~13 mag). The galaxy clustering is due to the weighted averaging; the score value jumps from 1 if all three bands agree, to an intermediate value of about 1.3, if the source failed in one band. "False" galaxies are predominantly located at 2.0, with clustering around 1.5 to 1.8. The lower panel of Figure 12 shows the g_score for extended source candidates from the Working Database, plotted as a function of the integrated Ks magnitude. Verified galaxies tend to have a g_score that ranges from 1.0 to 1.4. This score does a slightly better job of discriminating galaxies from non-galaxies than does the e_score.
 |
| Figure 12 |
As discussed in Sections IV.5 and IV.7, spurious detections of and real source detections affected by optical artifacts of bright stars are identified during scan pipeline processing and in the Catalog Generation phase (V.5). For inclusion in the PSC and XSC, sources must not be identified as artifact detections in that processing. Sources which are believed to be real astrophysical objects, but which may have positions and/or photometry affected by nearby artifacts, are passed to the Catalogs and are flagged as possibly corrupted using the "cc_flg" (cf. II.2a and II.3a).
[Last Update: 2003 March 8, by R. Cutri, T. Jarrett and T. Chester]