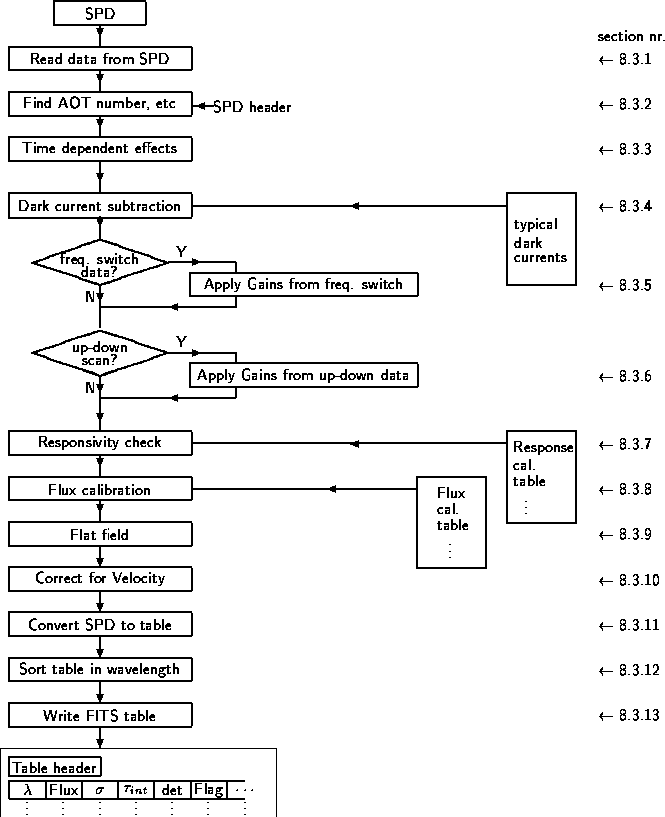
Figure 8.2: Auto-Analysis flow-diagram
Auto-Analysis (AA) is the processing stage that starts from SPD, corrects for all instrumental effects lasting longer than one second and generates sets of fluxes against wavelength (spectra). These spectra are generated irrespective of the observation specifications. Figure 8.2 gives an overview of AA processing. Most of the SWS AA processing steps are independent of AOT number as most of the special options (e.g. the reference scaning , see table 4.1) are used in several different AOT's and thus are implemented as part of the main processing flow.

Figure 8.2: Auto-Analysis flow-diagram
These steps are described in more detail in the following pages.
The data and header information are read from the input SPD. Errors occur when e.g. SPD does not exist or cannot be read etc.
The AOT number, needed for the further processing of the data, is determined from the EOHAAOTN keyword in the SPD FITS header. The velocity of the spacecraft with respect to heliocentric is similarly obtained, and for AOT SWS01 the speed is also obtained.
The detector data may need to be corrected for time dependant effects such as detector hysteresis.
Currently, only a number of readouts at the beginning and end of dark currents are rejected.
For every block of dark current data, the median of valid dark current data is calculated for each detector. The reset interval is computed from the reset pulses (extracted from the status code) and the gain is extracted from the detector flag.
Whenever possible a (linearly) interpolated dark current is subtracted from each non-dark current scan. The interpolation is done over the dark current directly preceding the scan and the nearest dark current following the scan. This means the dark currents must have the same reset time and gain as the scan. The interpolation is performed in time and the beginning and end of the interpolation are taken as the last frame of the first dark current and the first frame of the second dark current.
If there is no dark current preceding a scan, the dark current after the scan is subtracted or the mean of all dark current in the spd with the same reset and gain as the scan.
For the PHOTOMETRIC CHECKS only the dark current preceding the measurement is subtracted. No interpolation is done.
The calculated dark current values are also subtracted from the dark current frames themselves.
If there is no valid dark current point in a block, either the next useful dark current is used or the mean value of all dark dark current in the AOT with the same gain and reset.
Each calculated dark current is compared against the value in the calibration file (CAL21_*) and the limits for the dark current therein. If the calculated dark current is outside the defined limits a warning is issued. The calculated dark current is however subtracted.
If no dark current can be found for a specific detector, the data are flagged invalid.
It is implicitly (most likely incorrectly) assumed that the dark current data have not been affected by (or are completely corrected for) detector memory effects.
The detector gains are determined using reference scan data, see section 4.6.2. Reference scan data are obtained by going to a fixed grating angle every few seconds during a scan, see section 4.6.2. The data taken at this fixed grating angle, hence at the same wavelength, should give the same detector response (per detector). Thus variations in the output at the level of the reference scan data reflect variations in the detector responsivity and/or sensitivity.
From OLP V6 this module was disabled as it was resulting in erroneous fluxes (see Caveats).
Currently nothing is done here.
The responsivity check term ![]() (see equation 7.3) is
determined and applied.
(see equation 7.3) is
determined and applied.
Data obtained with the internal stimulator are collected and averaged. The values are compared with those in a calibration table, and the ratio of the two is applied to all data. To do this properly the resolution of the various AOTs and scanning speeds needs to be known to the OLP algorithms, so that the resolution of the Grating Relative Spectral Responsivity function can be reduced to the resolution of the observation. Cal-G files 25_x are reduced to the resolution set out in Cal-G file 19 .
Prior to OLP V6.0, all the data from the photometric check not containing a glitch was averaged. This was found to cause problems with the next stage of the OLP pipeline so from V6.0 onwards all slopes of the first photometric check data are used. A three point median filter is run on this data and from this the median used for flux calibration is computed. Refer to 8.4 where it is described in detail.
The detector responses are converted from ![]() V/sec to Jy by applying
the wavelength dependent part of the gain
V/sec to Jy by applying
the wavelength dependent part of the gain ![]() (see
equation 7.3).
(see
equation 7.3).
For each frame the detector slopes are divided by the responsivity appropriate for the given detector, AOT band and scanner position.
Currently nothing is done here.
The velocity component (V) in the line of sight towards the target, due to the combined motions of the spacecraft and of the earth is corrected for in this module. This then ensures that the AAR wavelength is heliocentric.
All good data (wavelength, fluxes etc.) are transferred to internal arrays. Data for which no wavelength was assigned in Derive-SPD are skipped.
Prior to OLP V6 dark current and photometric check data were transferred into the internal arrays and a therefore present in the AAR. From OLP V6 this is not the case.
The internal table of wavelengths, fluxes etc. is sorted by wavelength using an appropriate sort algorithm.
The table containing wavelength and flux calibrated data is written to a FITS AAR file. For a definition of this file see section 9.4.1.