Appendix 4. 2MASS Calibration Scan Working Databases and Atlas Images
2. General Properties of the Calibration Scan Products
a. Scope of the Calibration Scan Atlas and Working Databases
- Range of dates over which calibration scans were acquired:
- Northern observatory: 1997 June 7 - 2000 December 1 UT
- Southern observatory: 1998 March 18 - 2001 February 15 UT
- Total number of fully or partially photometric nights represented in the release:
- Northern observatory: 691
- Southern observatory: 750
- Number of calibration scans from which image
and source data were extracted:
- Northern observatory: 33,456
- Southern observatory: 39,774
- Southern observatory: 1,542 (LMC/SMC)
- Total: 74,772
b. Calibration Field Properties
Table 1 - Calibration Field Scan and Data Properties
| Tile1 | Center2 | Coverage Limits3 | Scan Footprints4 | All-Sky PSC Comparison |
| RA_J2000 (deg) | Dec_J2000 (deg) | RAmin(deg) | RAmax(deg) | Decmin(deg) | Decmax(deg) | RA_bias5 | Dec_bias5 | Photom.6 |
| 90021 | 6.10619 | -1.97294 | 6.026 | 6.210 | -2.475 | -1.465 | X | X | X | X |
| 90294 | 8.31622 | -39.40154 | 8.216 | 8.429 | -39.921 | -38.886 | X | X | X | X |
| 90299* | 11.25260 | -70.58353 | 11.024 | 11.483 | -71.079 | -70.088 | X | X | X | X |
| 90004 | 28.66074 | +0.71693 | 28.569 | 28.767 | +0.195 | +1.240 | X | X | X | X |
| 90301 | 51.72678 | -39.84268 | 51.627 | 51.835 | -40.340 | -39.323 | X | X | X | X |
| 90247 | 53.01617 | +37.34386 | 52.912 | 53.144 | +36.802 | +37.887 | X | X | X | X |
| 90533 | 55.26392 | +6.93647 | 55.173 | 55.373 | +6.414 | +7.457 | X | X | X | X |
| 90191 | 66.58918 | +3.62342 | 66.509 | 66.681 | +3.102 | +4.141 | X | X | X | X |
| 90400* | 74.90247 | -65.73341 | 74.720 | 75.085 | -66.228 | -65.237 | X | X | X | X |
| 90401* | 78.62001 | -71.00065 | 78.385 | 78.851 | -71.496 | -70.505 | X | X | X | X |
| 90013 | 89.28447 | +0.01890 | 89.200 | 89.378 | -0.523 | +0.562 | X | X | X | X |
| 90402* | 93.56589 | -69.66665 | 93.347 | 93.781 | -70.162 | -69.171 | X | X | X | X |
| 90121 | 97.37444 | -59.65713 | 97.226 | 97.526 | -60.154 | -59.159 | X | X | X | X |
| 90161 | 105.22232 | +48.48935 | 105.100 | 105.374 | +47.985 | +49.010 | X | X | X | X |
| 90312 | 126.40319 | -39.09847 | 126.304 | 126.508 | -39.628 | -38.564 | X | X | X | X |
| 92026 | 128.12790 | -1.57084 | 128.047 | 128.212 | -2.395 | -1.054 | X | X | X | X |
| 90067 | 132.81203 | +11.84773 | 132.724 | 132.899 | +11.316 | +12.380 | X | X | X | X |
| 90091 | 145.75214 | +59.06160 | 145.591 | 145.933 | +58.542 | +59.579 | X | X | X | X |
| 92397 | 170.45775 | -13.22047 | 170.372 | 170.555 | -13.751 | -12.686 | X | X | X | X |
| 90217 | 180.44070 | -50.05148 | 180.321 | 180.572 | -50.582 | -49.519 | X | X | X | X |
| 90266 | 183.61047 | +35.59855 | 183.513 | 183.729 | +35.078 | +36.114 | X | X | X | X |
| 90860 | 185.41757 | -0.12034 | 185.331 | 185.501 | -0.650 | +0.608 | X | X | X | X |
| 90867 | 220.24529 | -0.45767 | 220.166 | 220.340 | -0.965 | +0.317 | X | X | X | X |
| 90273 | 224.21932 | -44.81900 | 224.110 | 224.347 | -45.349 | -43.936 | X | X | X | X |
| 90272 | 224.64303 | +37.14173 | 224.541 | 224.747 | +36.622 | +37.660 | X | X | X | X |
| 90868 | 225.11368 | -0.65787 | 225.035 | 225.198 | -1.441 | +0.122 | X | X | X | X |
| 90565 | 246.68168 | +5.87185 | 246.601 | 246.793 | +5.097 | +6.510 | X | X | X | X |
| 90009 | 246.80780 | -24.68901 | 246.722 | 246.902 | -25.219 | -24.156 | X | X | X | X |
| 90330 | 247.89420 | +30.14552 | 247.800 | 247.988 | +29.388 | +30.652 | X | X | X | X |
| 90279 | 267.09736 | -45.42783 | 266.986 | 267.230 | -45.958 | -44.894 | X | X | X | X |
| 90182 | 279.89627 | +49.09363 | 279.771 | 280.036 | +48.578 | +49.611 | X | X | X | X |
| 90547 | 282.82780 | -4.27488 | 282.742 | 282.906 | -5.061 | -3.493 | X | X | X | X |
| 90808 | 285.48438 | -4.48794 | 285.366 | 285.595 | -5.303 | -3.700 | X | X | X | X |
| 90234 | 307.83812 | -49.64775 | 307.720 | 307.980 | -50.167 | -49.132 | X | X | X | X |
| 90813 | 310.27504 | -5.06339 | 310.153 | 310.381 | -5.881 | -4.159 | X | X | X | X |
| 92409 | 330.11998 | +20.84962 | 330.033 | 30.185 | +20.331 | +21.369 | X | X | X | X |
| 92202 | 331.40247 | -11.07477 | 331.316 | 331.511 | -11.862 | -10.172 | X | X | X | X |
| 90893 | 349.54575 | +0.54857 | 349.458 | 349.653 | +0.028 | +1.072 | X | X | X | X |
| 90290 | 352.64369 | +38.31591 | 352.538 | 352.773 | +37.797 | +38.841 | X | X | X | X |
| 90298* | 356.63061 | -74.50079 | 356.345 | 356.916 | -74.995 | -74.006 | X | X | X | X |
Notes to Table 1
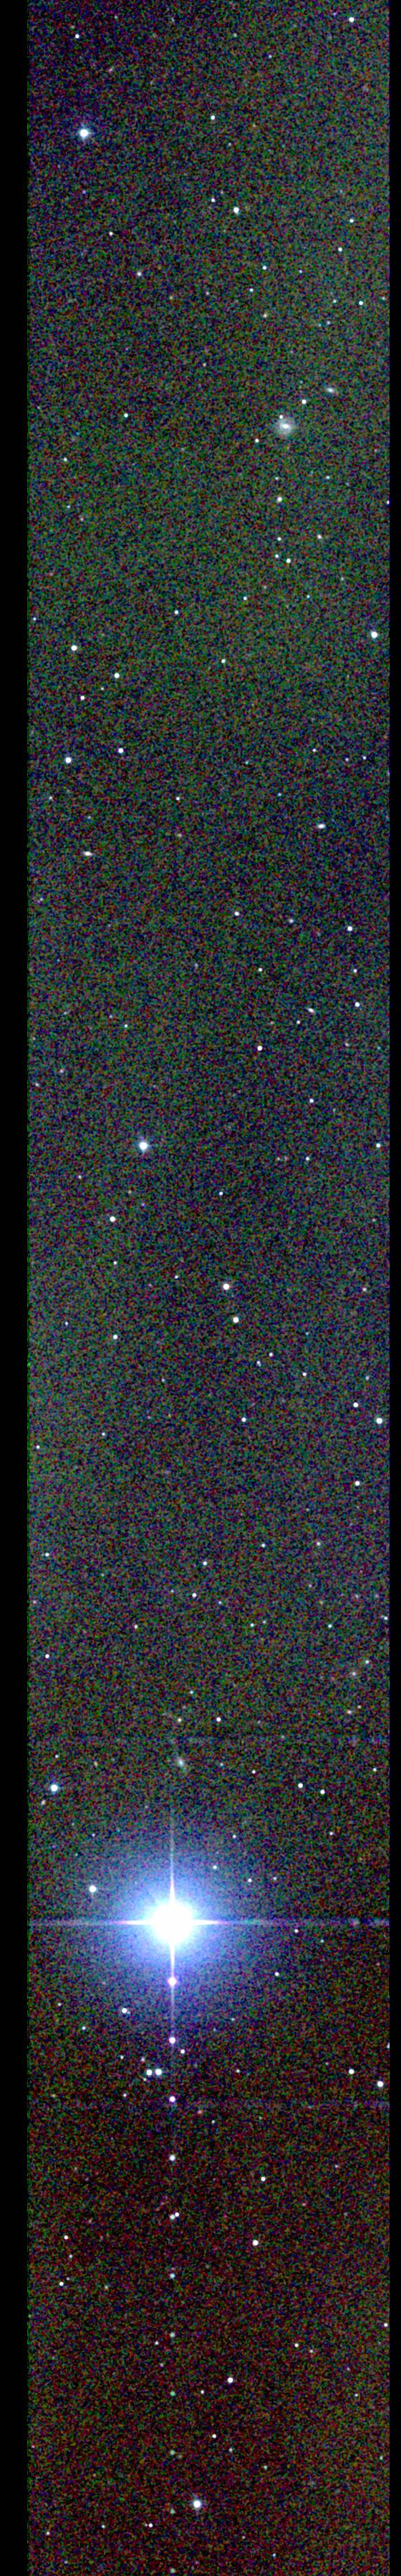
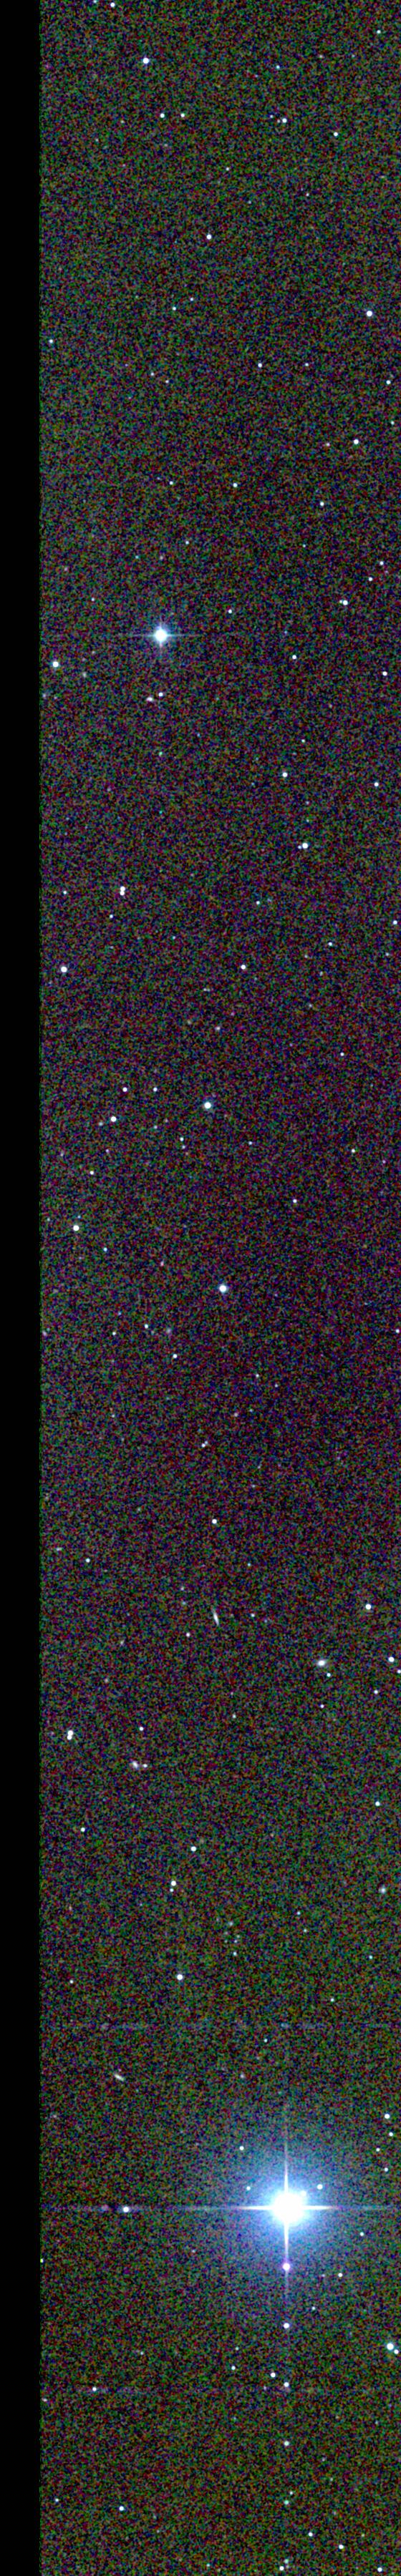
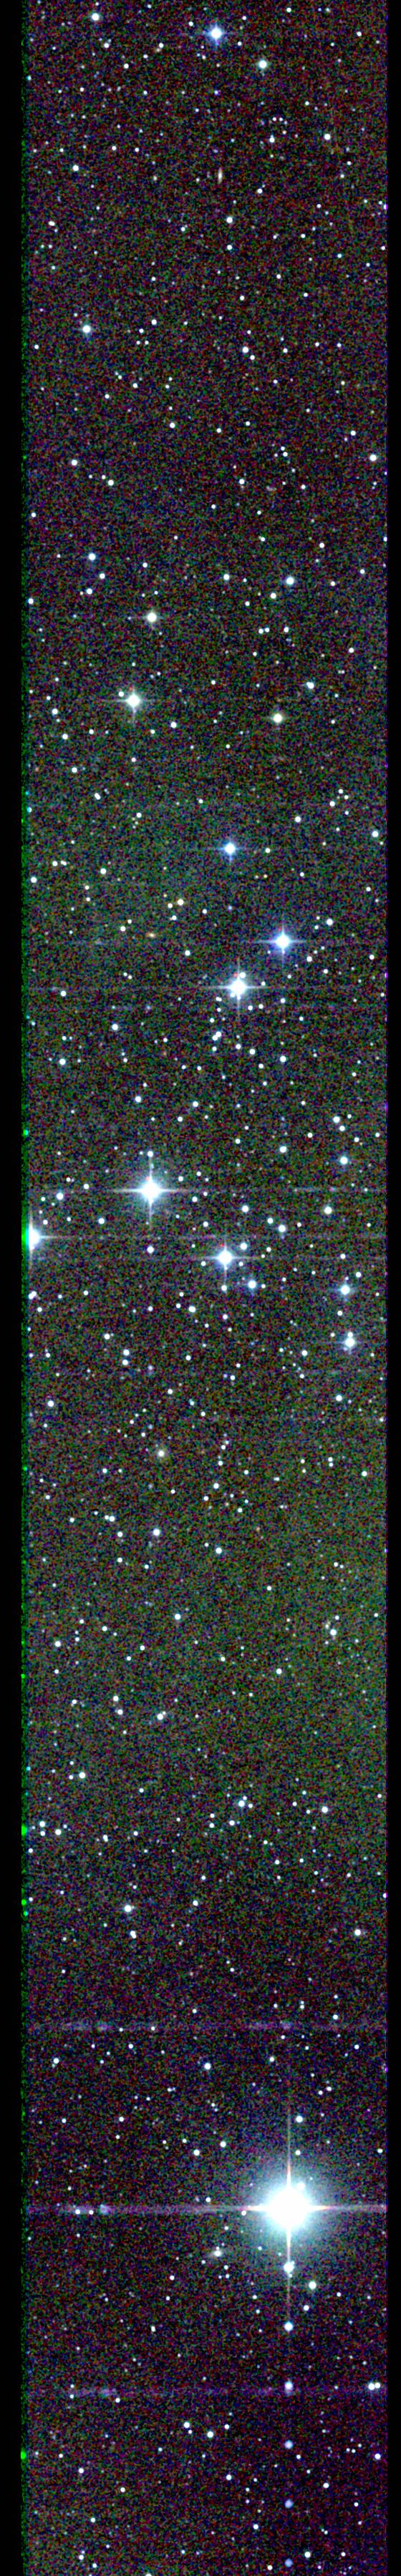
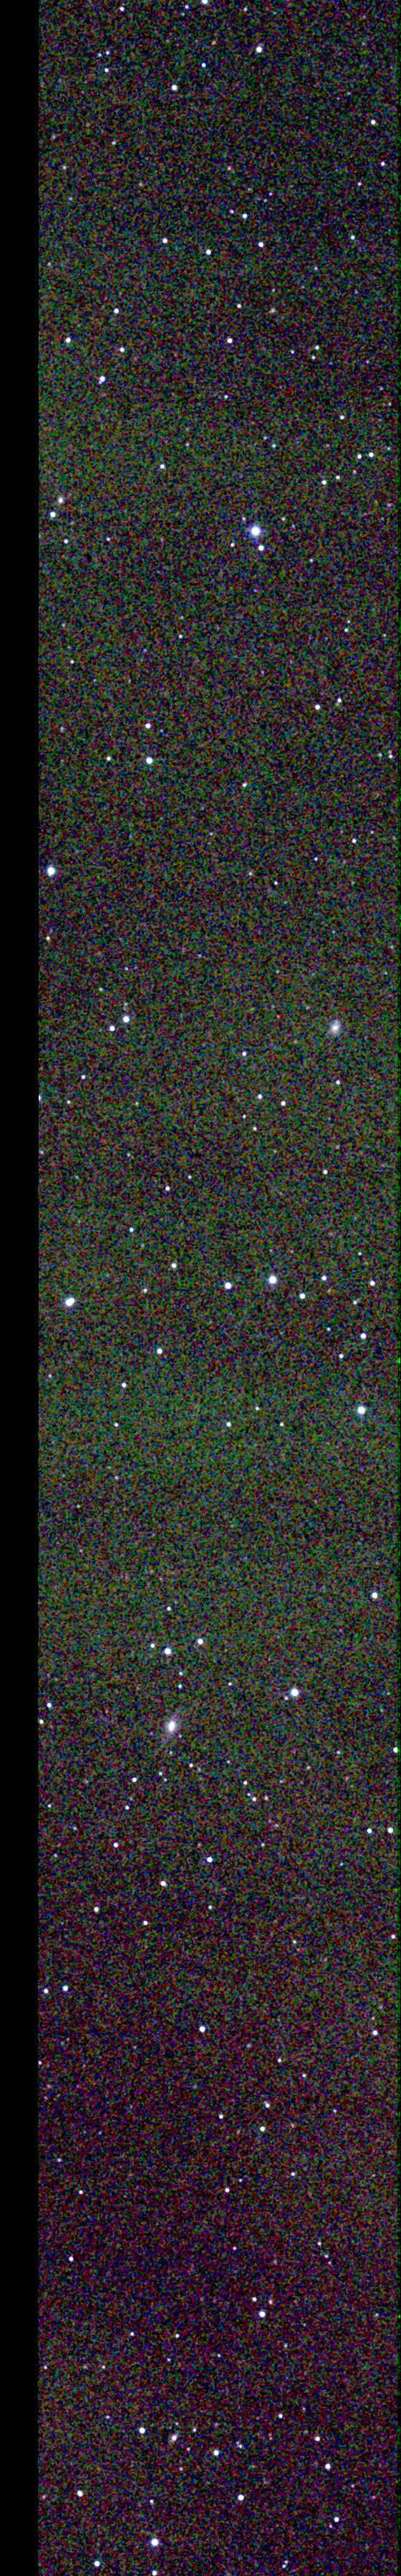
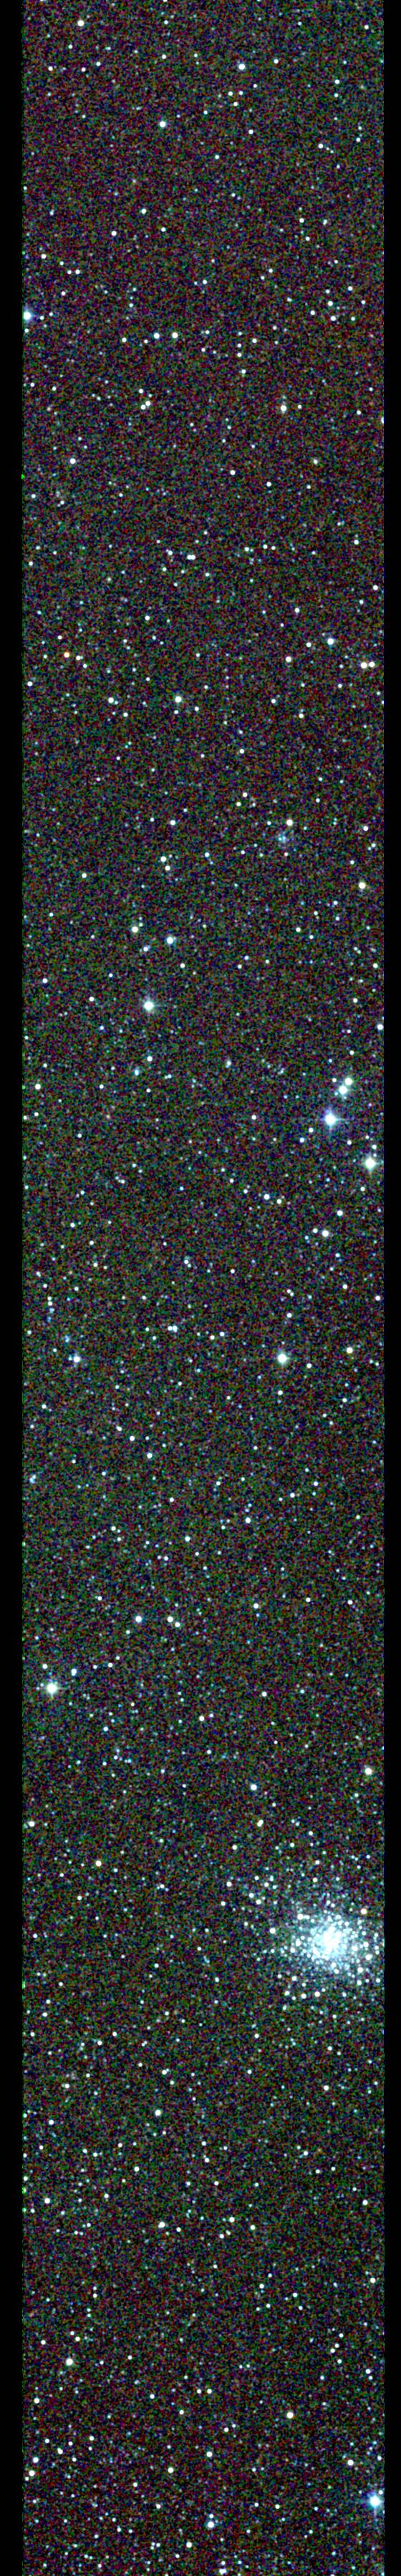
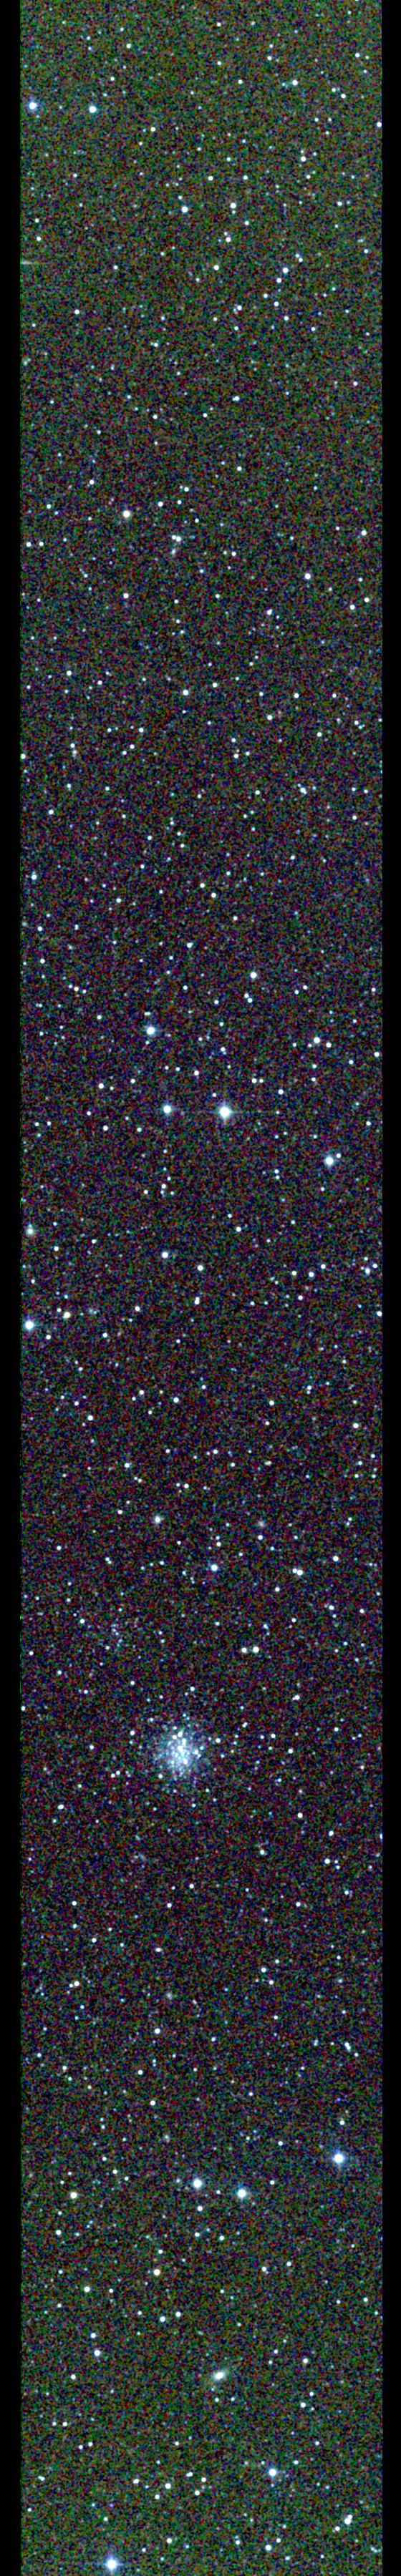
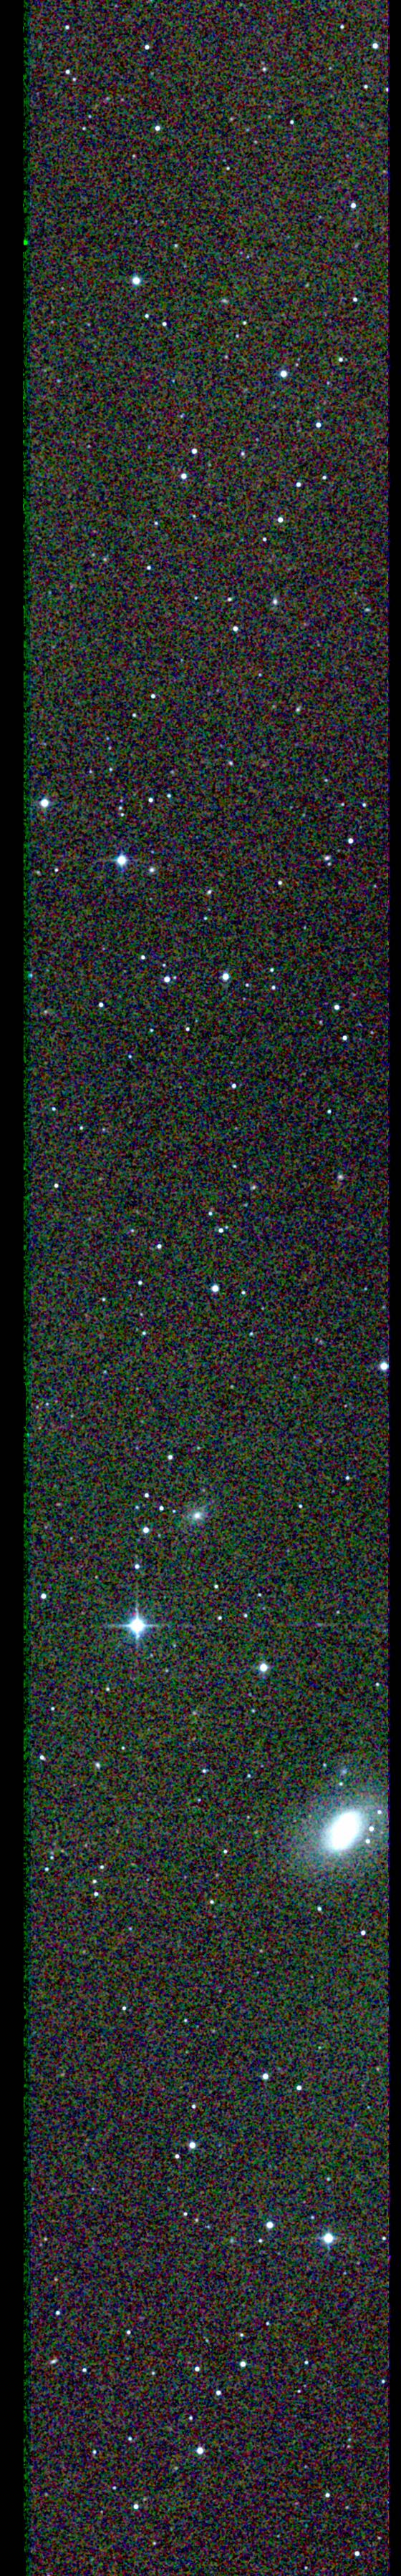
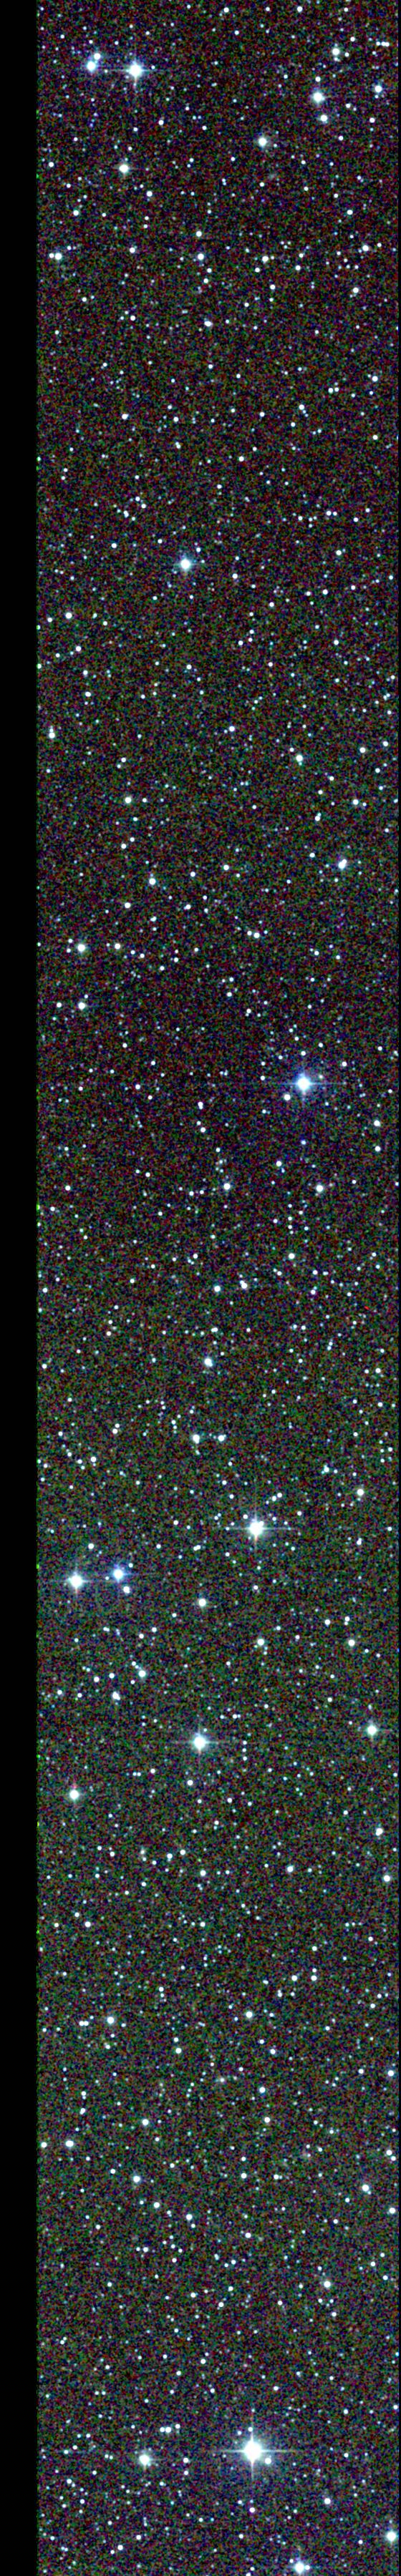
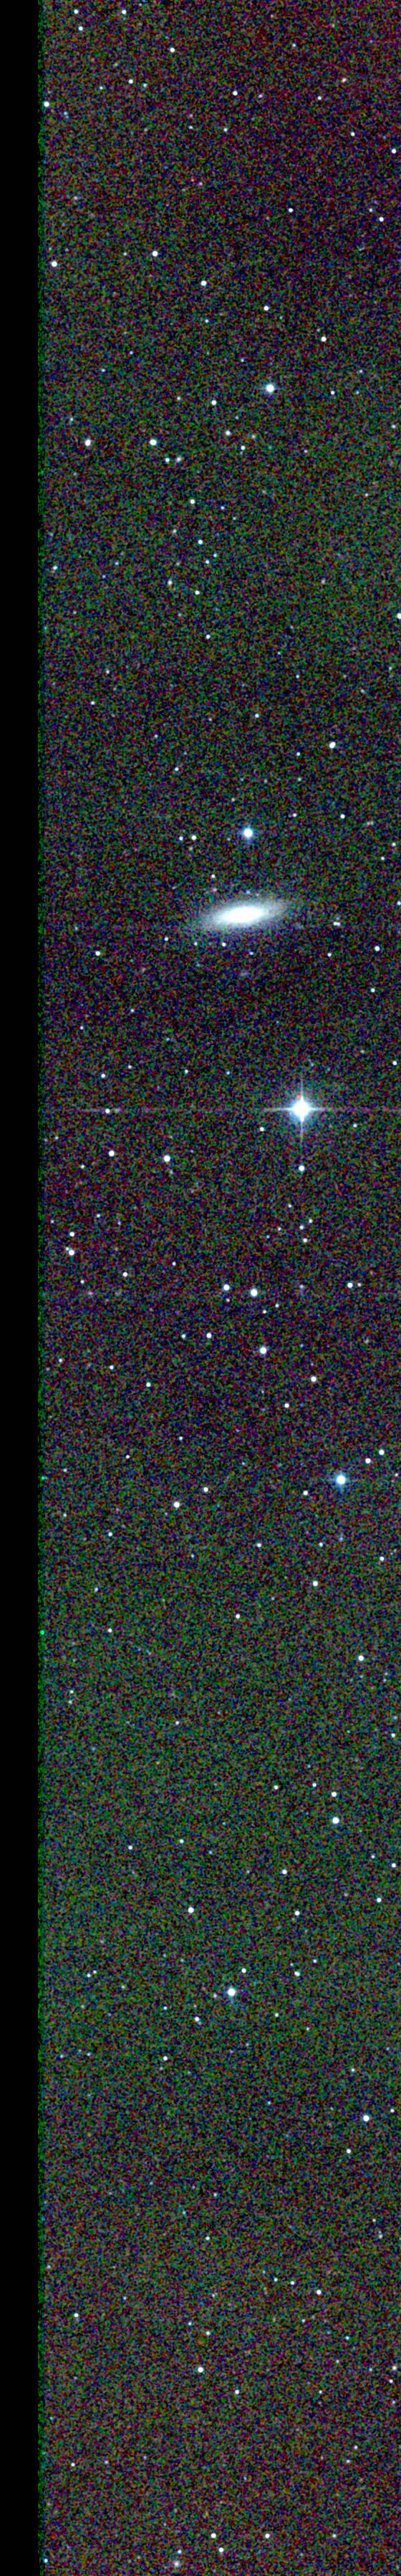
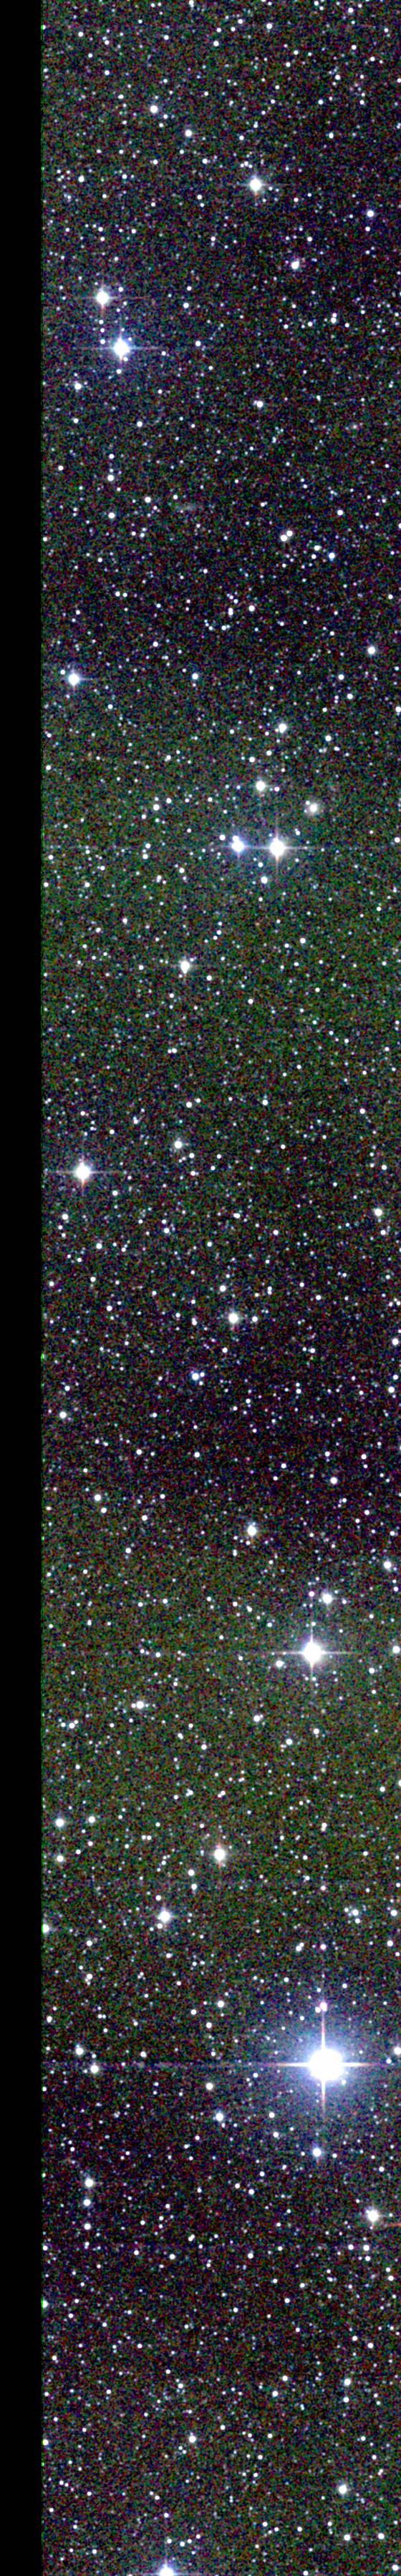
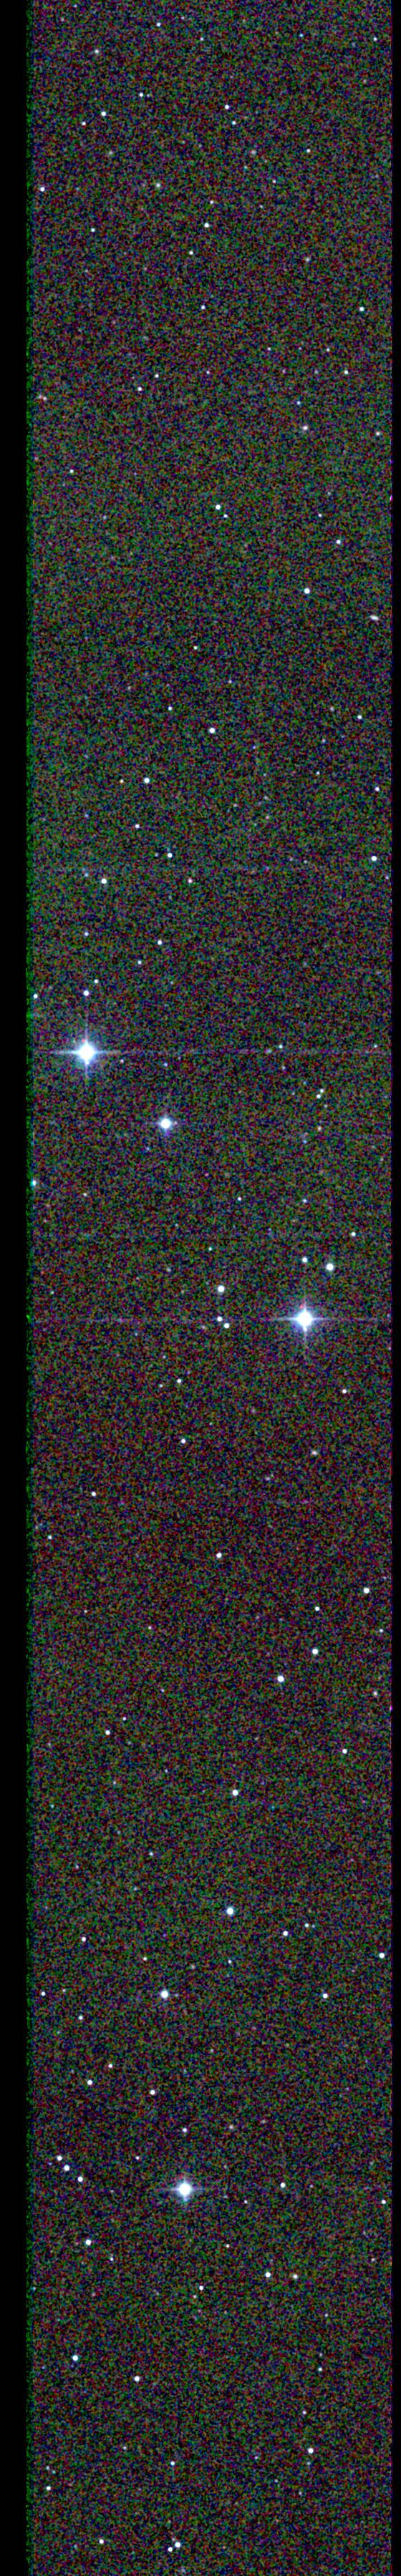
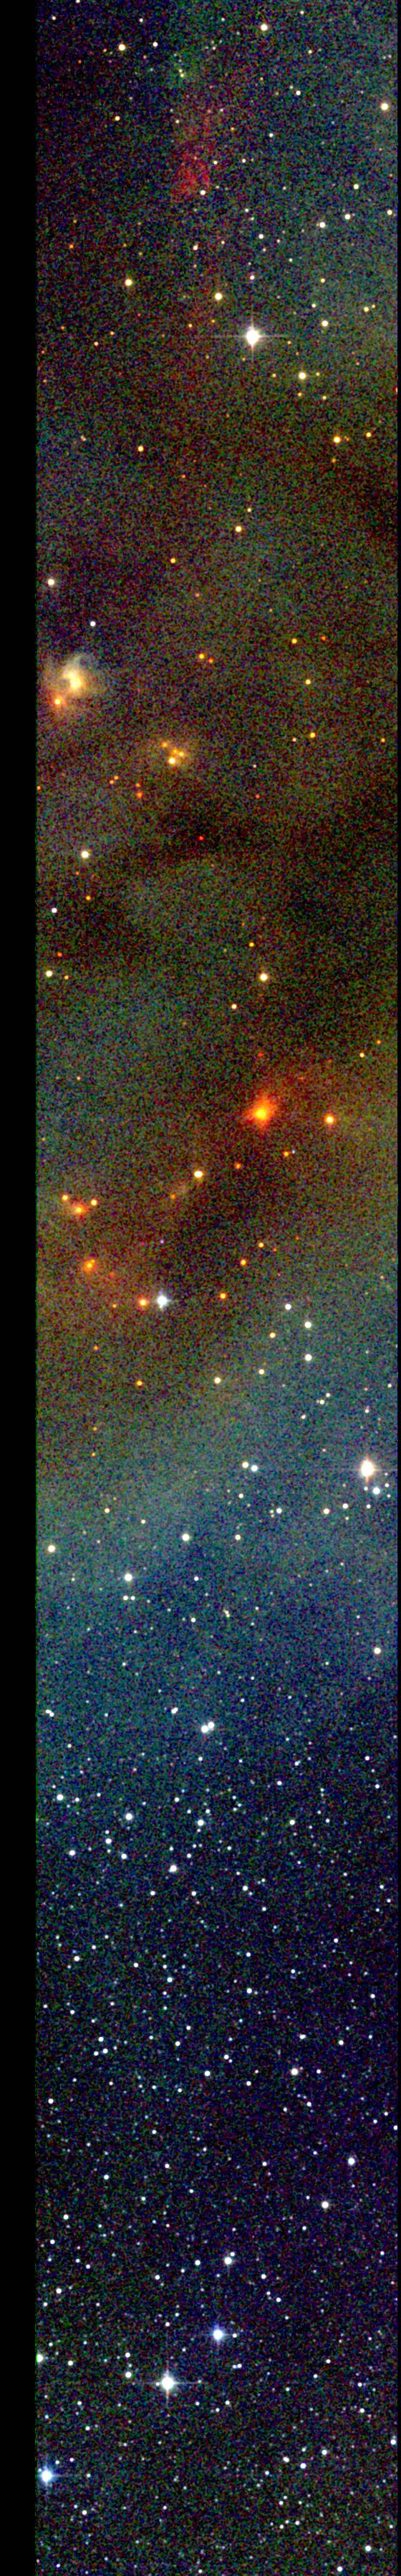
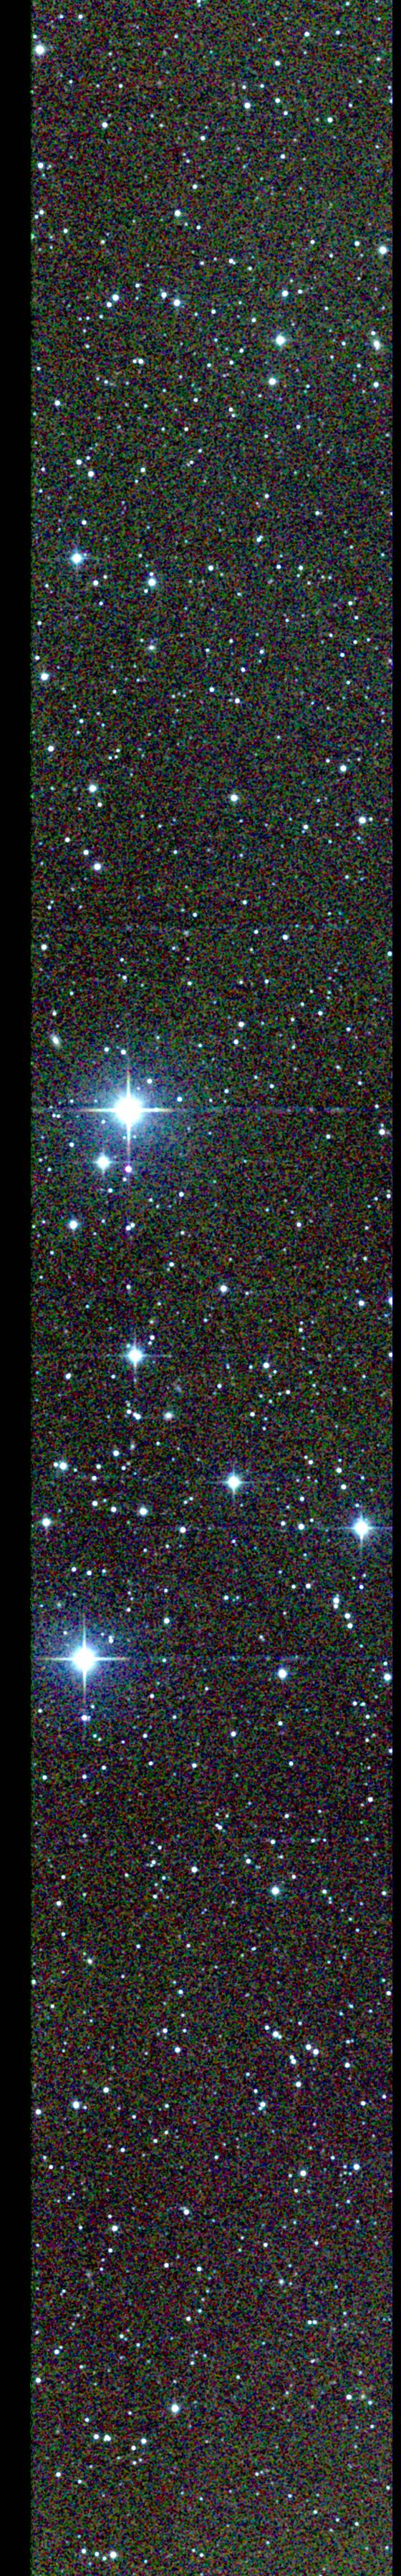
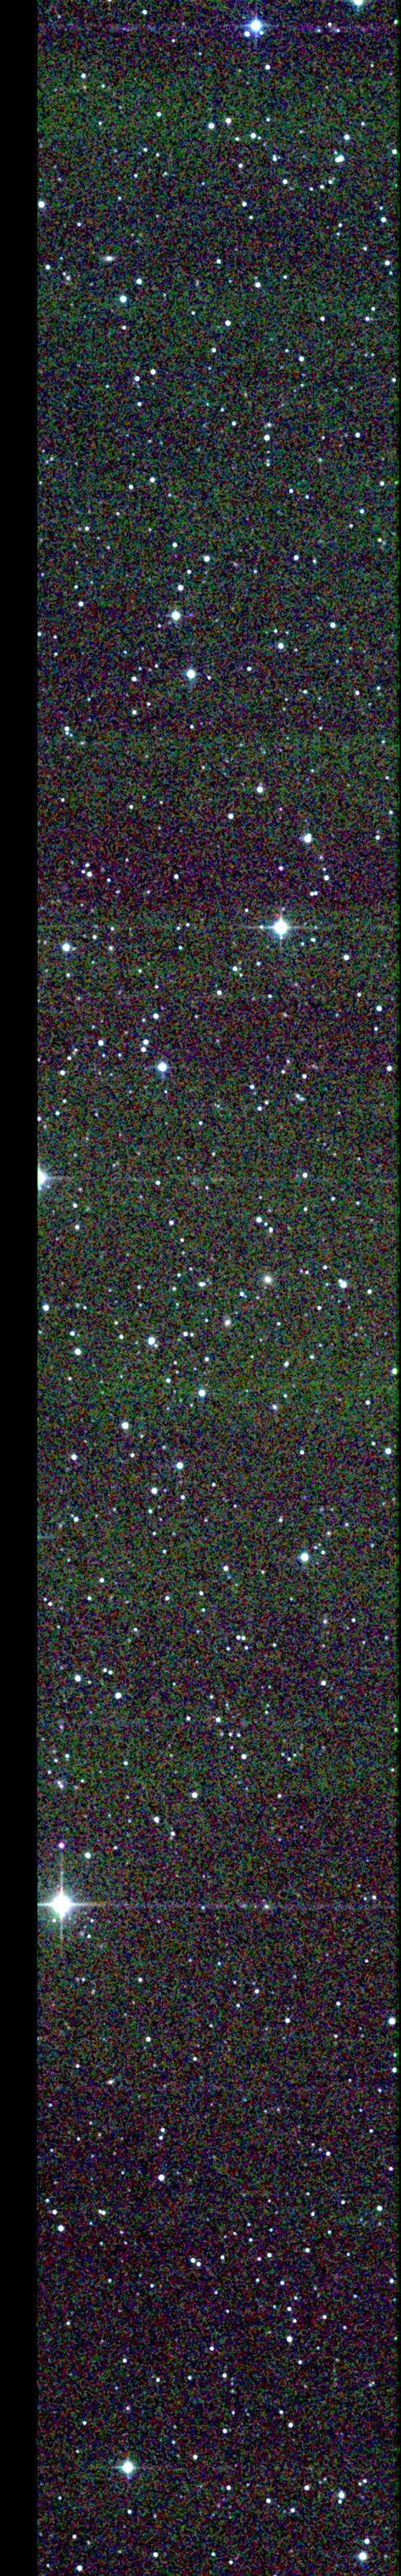
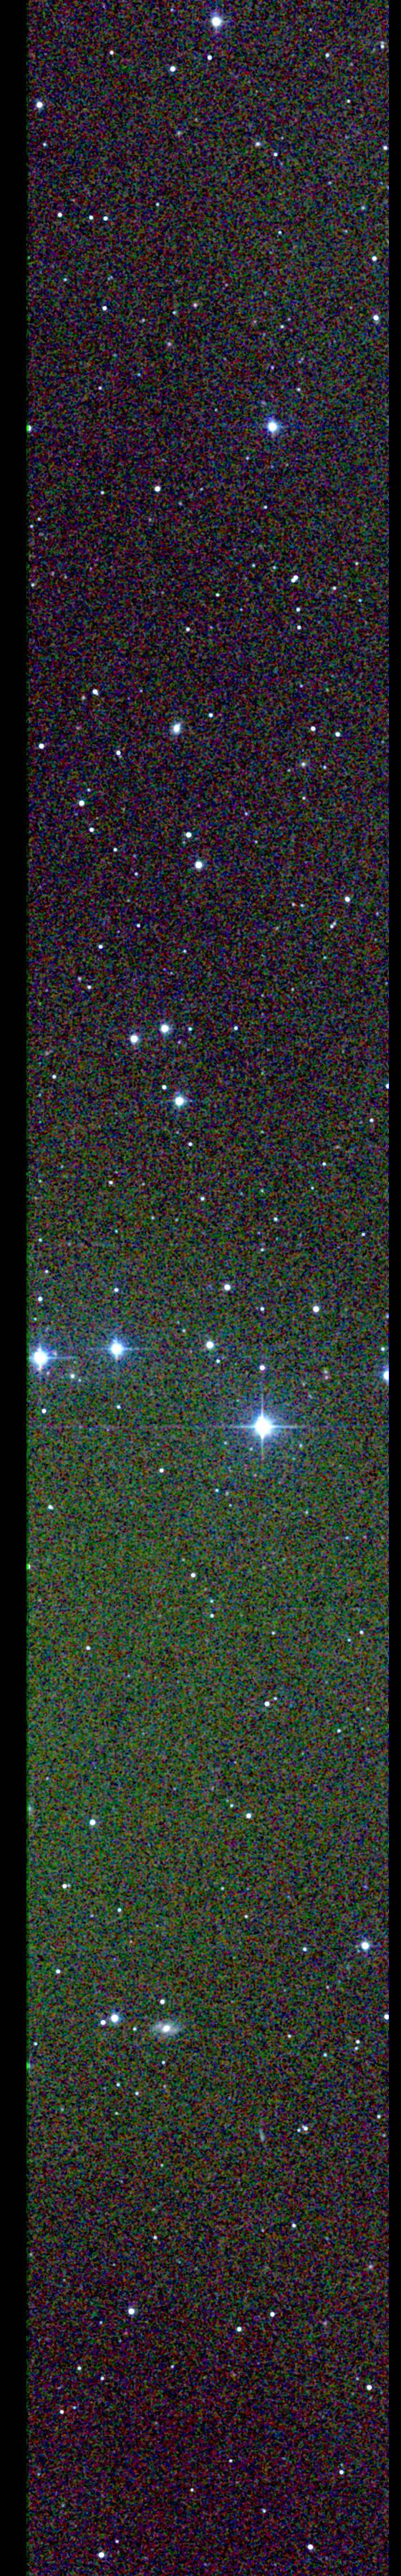
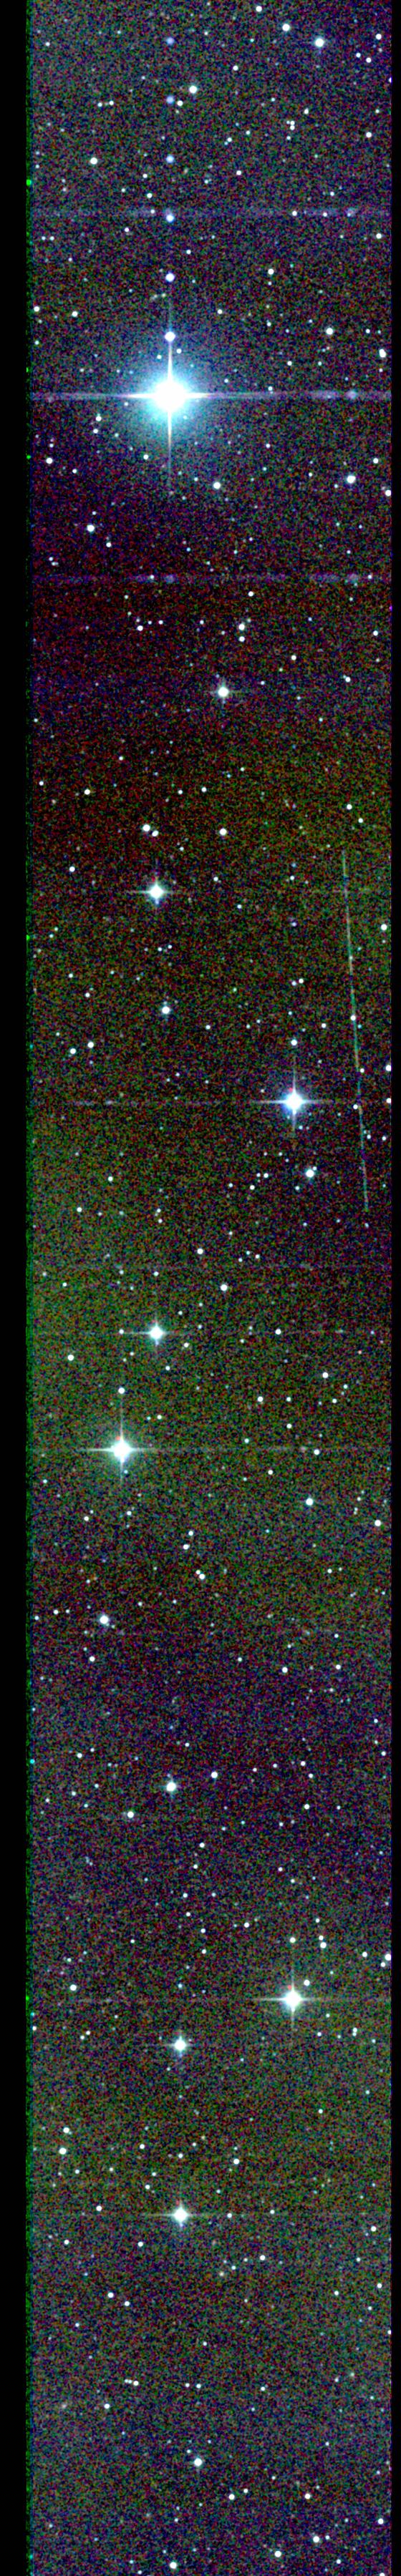
- Click on the Tile number to see a 3-color J,H,Ks composite
image of the field from one representative scan. An asterisk denotes LMC/SMC
calibration tiles.
- Average central coordinates of all scans of a field. This may
not coincide with the mean geometric area because some fields have
a few outlying scans.
- Approximate coordinate boundaries of the smallest simple rectangle that
encloses all scans of each field. These do not define precisely
the coverage area of each field which can be irregular.
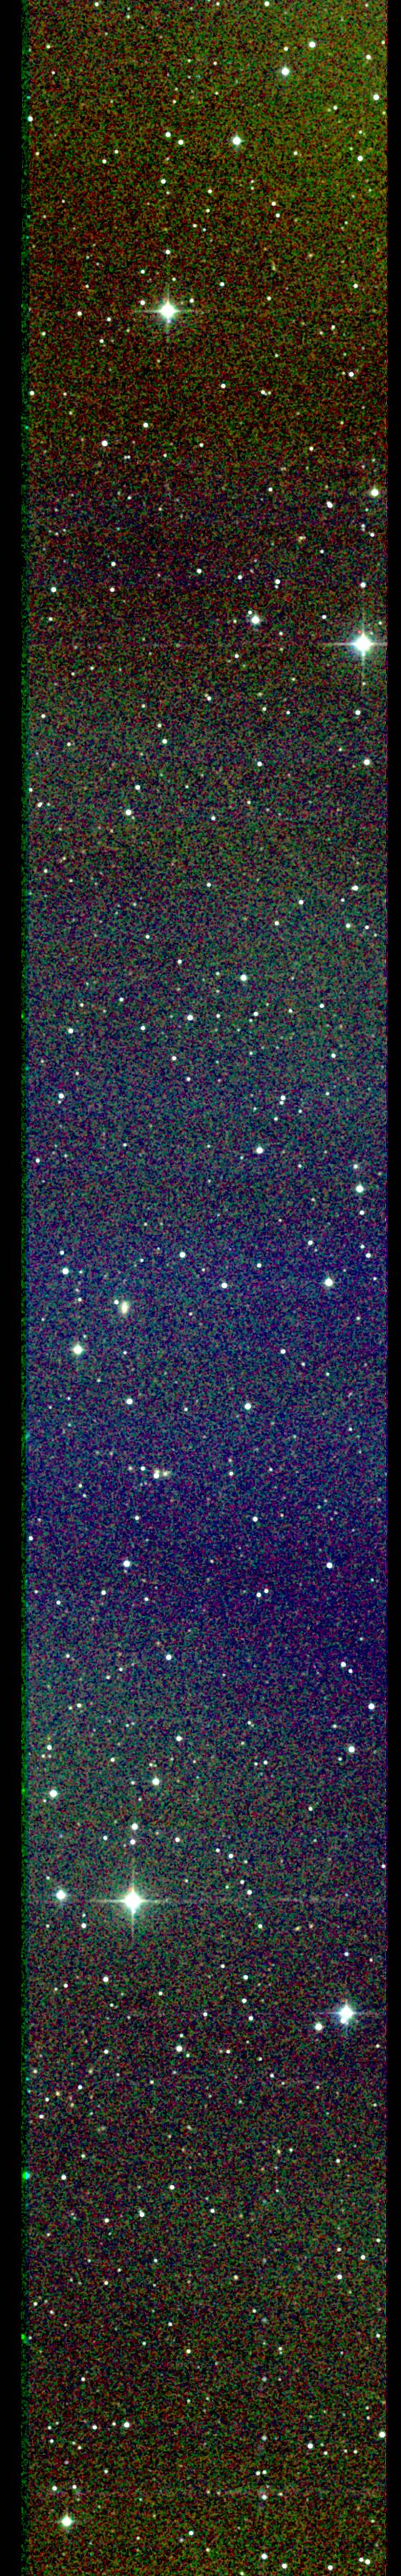
- Sky maps showing the outlines of all scans covering each calibration
field. The maps show a 1°x2° area in cartesian projection
with the RA scale exaggerated to emphasize the scan cross-stepping.
- RA and Dec offsets between average Cal_PSWDB positions and
All-Sky PSC positions, plotted as a function of RA and Dec
within each calibration field. Average Cal-PSWDB positions are taken
from the Merged Calibration PSWDB
- Photometric residuals between average Cal-PSWDB point sources
and All-Sky PSC, plotted as a function of source magnitude. The
average Cal-PSWDB magnitudes are taken from the
Merged Calibration PSWDB
i. Calibration Tiles and Sky Coverage
2MASS calibration observations cover
approximately 6 deg2, distributed in 40 separate fields,
or tiles.
The calibration field tile number listed in the first
column of Table 1 is the unique
identifier given to each field on the sky. For the main survey calibration
tiles, the tile number is derived from the primary calibration star(s)
in each field
(see III.2.d). Magellanic Cloud calibration tile
numbers (A3.4.c), denoted with
"*" in Table 1, were set arbitrarily to 90298 and 90299 for the SMC fields,
and 90400-90402 for the LMC fields. The tile number is contained in the
Calibration Scan Information Table,
to provide a simple way to search metadata for individual
calibration fields.
Each calibration scan swept over an area 8.5' wide in RA
and 1° long in declination. The first scan of the six comprising
a calibration observation was centered on the nominal tile
position. The 2MASS telescopes were cross-stepped
5" east in RA between each subsequent scan of the observation set
to minimize pixelization effects. So an area of approximately
0.15 deg2 was covered by each observation.
The footprint of all scans covering each calibration field can be seen by
clicking on the Scan Footprint links in Table 1.
In most fields, the observations were well-registered,
resulting in consistent coverage patterns such as those seen in
90182 or
90234.
A small fraction (<5%) of the scans in 10 fields were displaced
from the nominal position due to occasional telescope commanding errors
or small pointing variations. This produced more irregular coverage
patterns such as those seen in
90813
and 92202.
The Center RA and Dec listed in Table 1 are the average
of the reconstructed center positions of all scans of each field.
This may not correspond to the exact geometric center of coverage
because of irregular coverage in some fields
(e.g. 90273).
The Coverage Limits columns in Table 1 give the approximate
coordinates of the smallest rectangular region that contains
all the scans of each field. These limits can be used to select
source extractions from a individual fields when querying
the calibration Working Databases. Because of the irregular coverage,
the depth of coverage within these limits can range from zero at the
extreme boundaries, to hundreds or thousands near the field centers.
ii. Photometric Properties
The 2MASS calibration observations were taken with the same
exposure time and scanning method as the main survey observations,
and photometry was extracted using the same reduction
software. As a result, the photometric accuracy
and precision achieved by the calibration scan data are
very similar to the levels achieved for the All-Sky PSC and XSC.
Because of this similarity, much of the characterization and validation
of the main survey photometric performance described in sections
VI.1, VI.2 and
VI.3 are based on analyses of the calibration
scan point source photometry.
The average SNR=10 sensitivity
level achieved for point source
photometry in the 2MASS calibration scans is J=16.3, H=15.4,
Ks=14.8 mag. However, the sensitivity achieved
in all scans of a given field may span a range of up to 1 mag
because of varying atmospheric conditions.
Direct measurements of the photometric sensitivity were
obtained for every 2MASS calibration observation using the repeatability
of point souce photometry within the six scans comprising the observation.
Figure 1 shows the measured root variance in brightness plotted as a function
of the mean point source magnitude of each source detected in at least five
of the six scans in one observation of the 90249 calibration field.
The magnitude at which the root variance distributions intersect the horizontal
line at  =0.1086 mag is the
SNR=10 sensitivity level for the observation. This metric
was measured for every 2MASS calibration observation taken under
a wide variety of observing conditions, which made possible the
derivation of the empirical relationship between achieved
photometric sensitivity and atmospheric transparency, seeing and background
levels described in VI.2.
=0.1086 mag is the
SNR=10 sensitivity level for the observation. This metric
was measured for every 2MASS calibration observation taken under
a wide variety of observing conditions, which made possible the
derivation of the empirical relationship between achieved
photometric sensitivity and atmospheric transparency, seeing and background
levels described in VI.2.
Figure 2 shows the distributions of the SNR=10 magnitudes
for all northern and southern observatory calibration scans computed
using the relationship
in VI.2. The peaks of the
distributions occur near J=16.4, H=15.4 and Ks=14.7 mag.
The distributions in each band have an extent of nearly one magnitude,
so the calibration observations of any one field can span a large
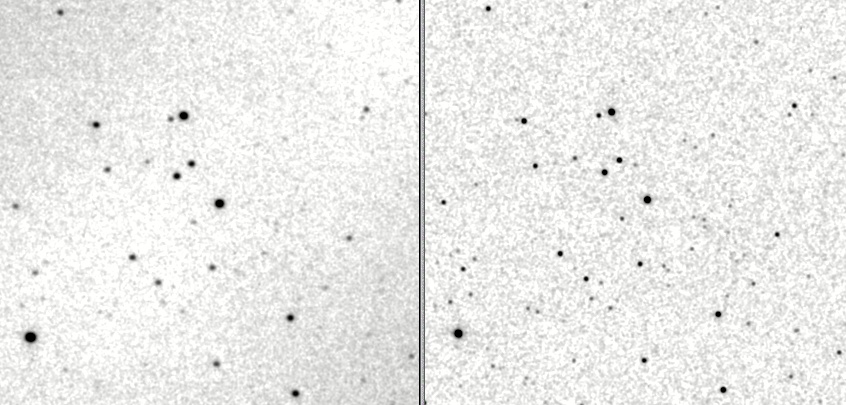
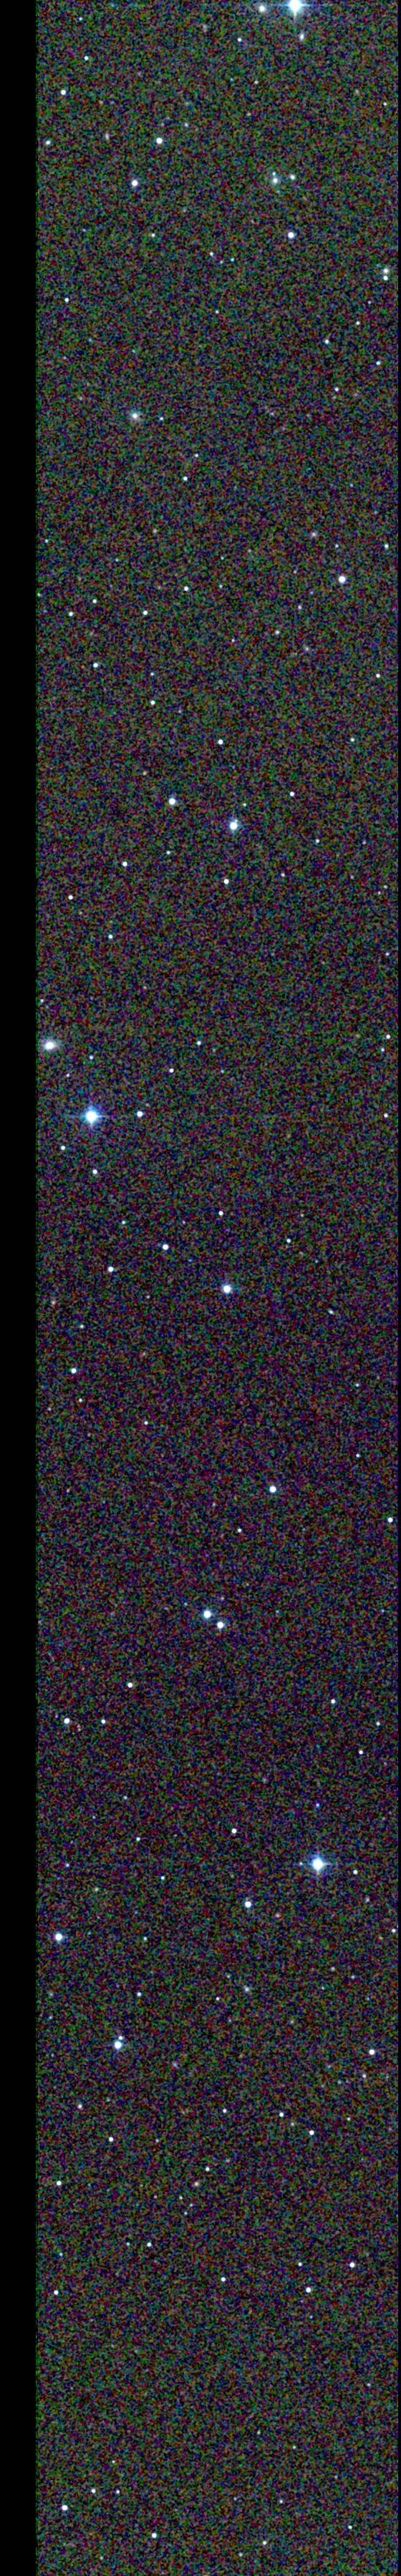
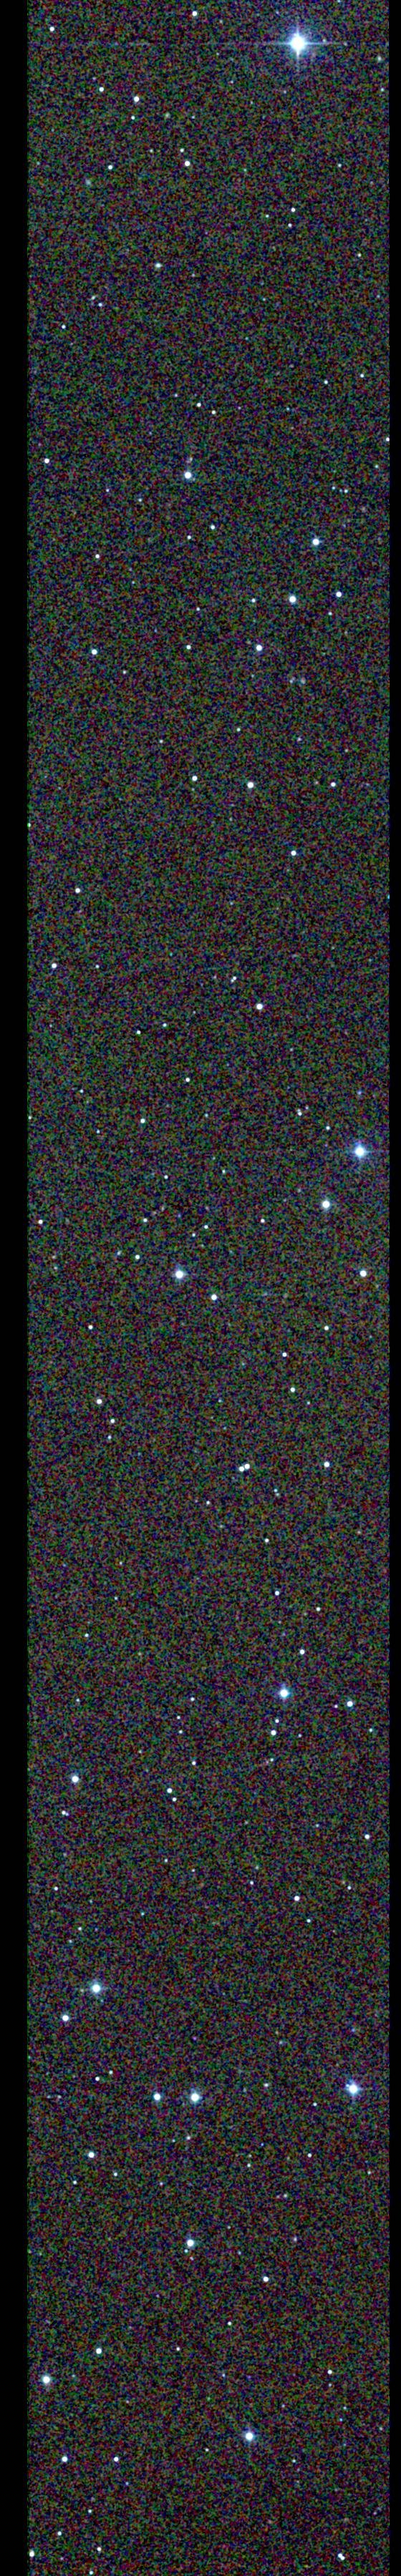
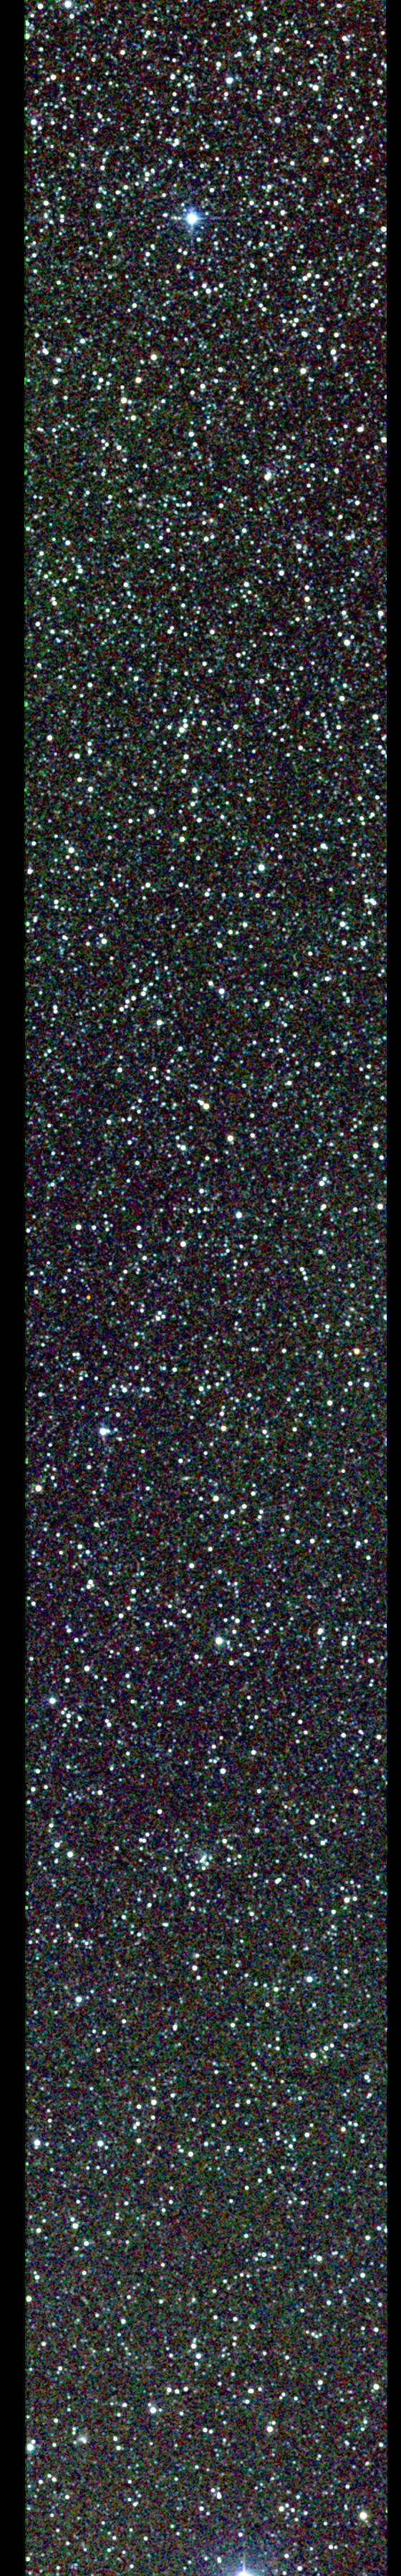
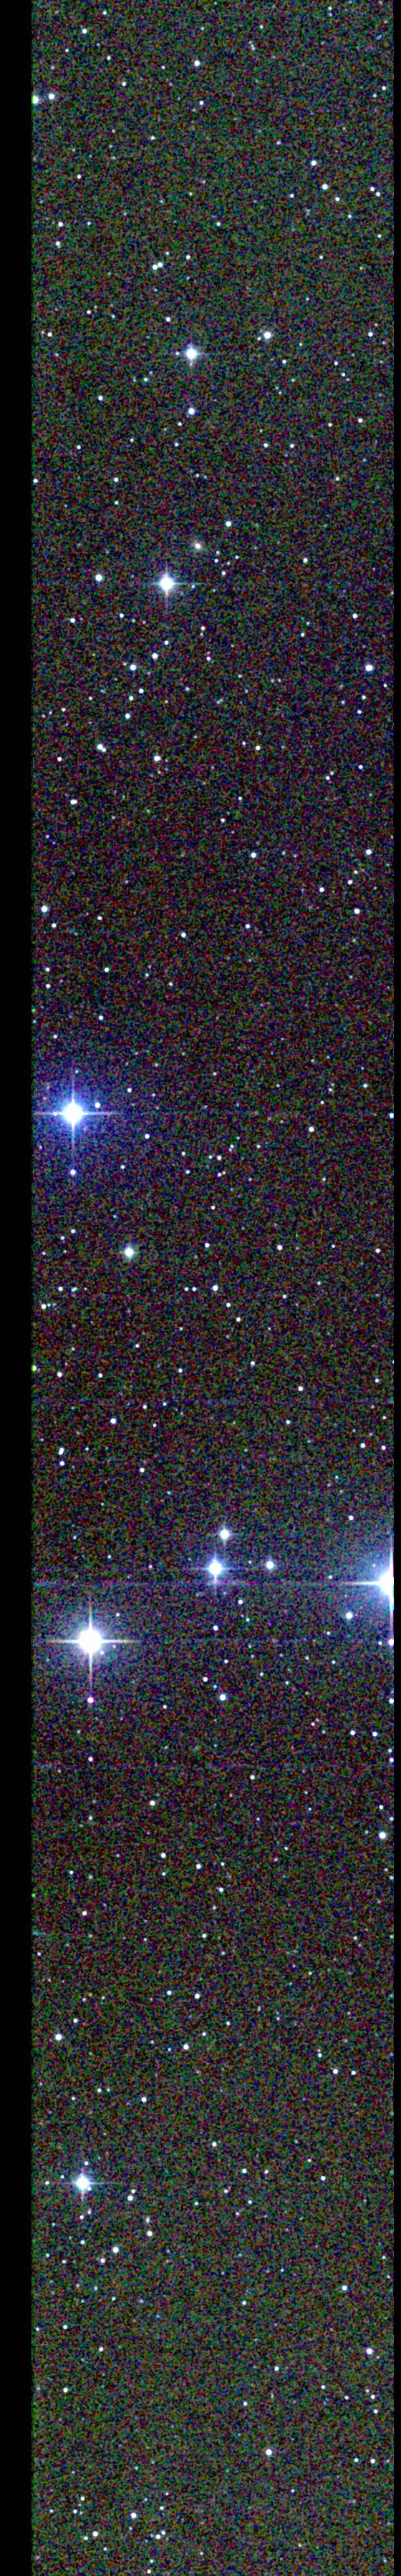
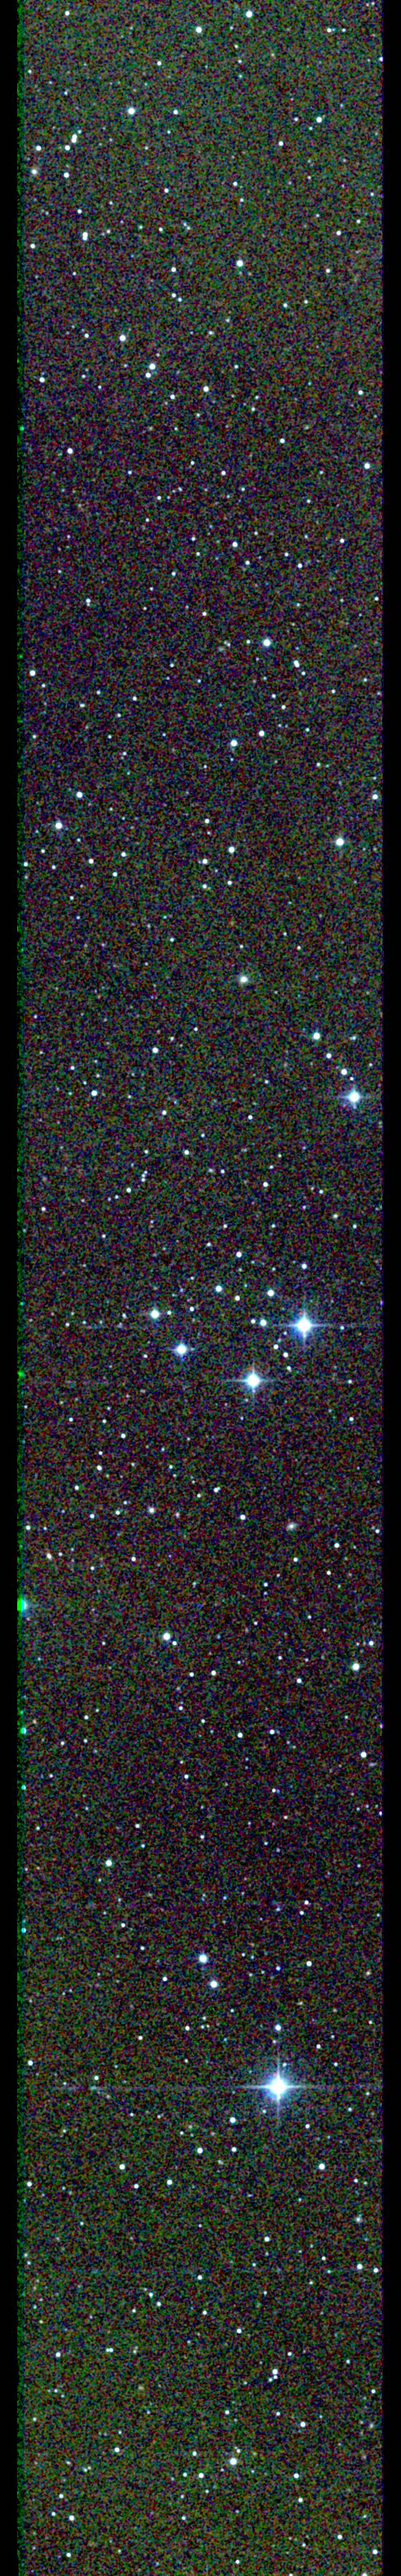
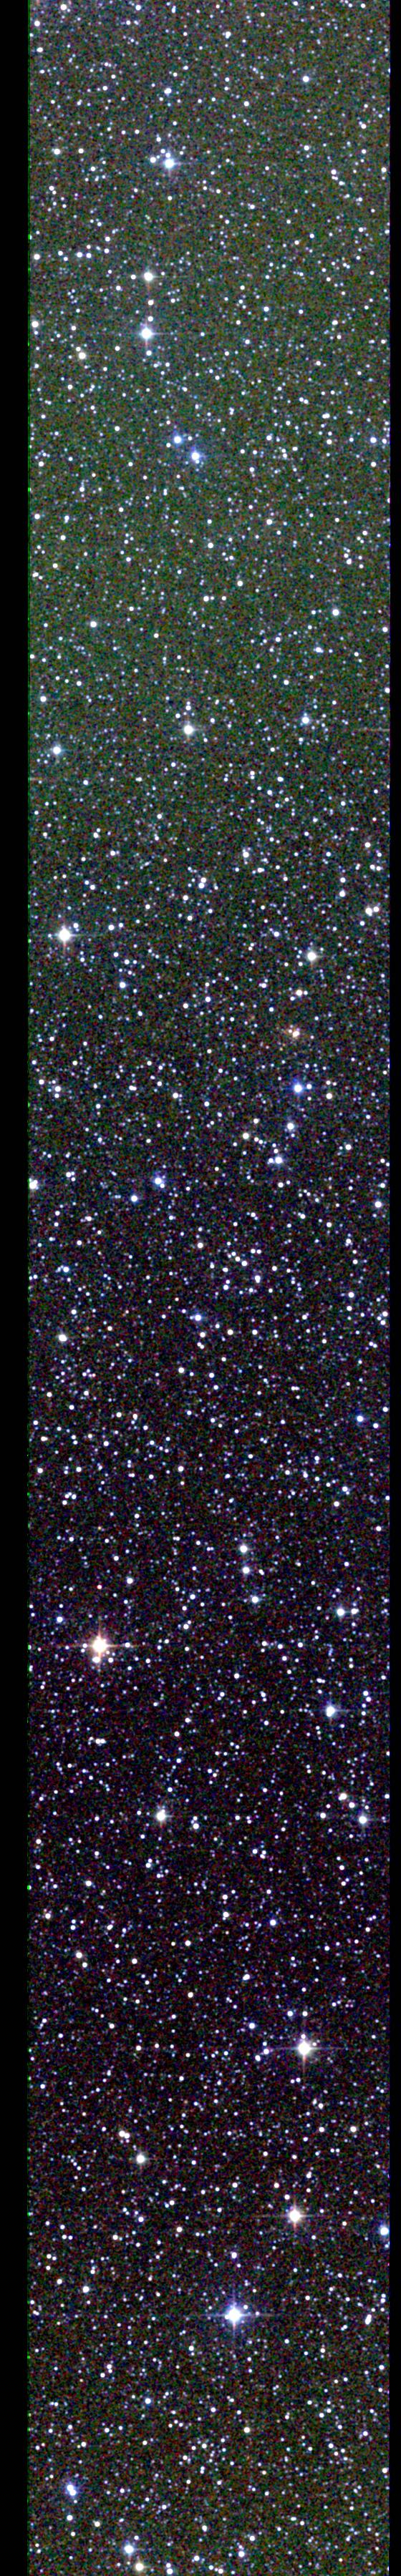
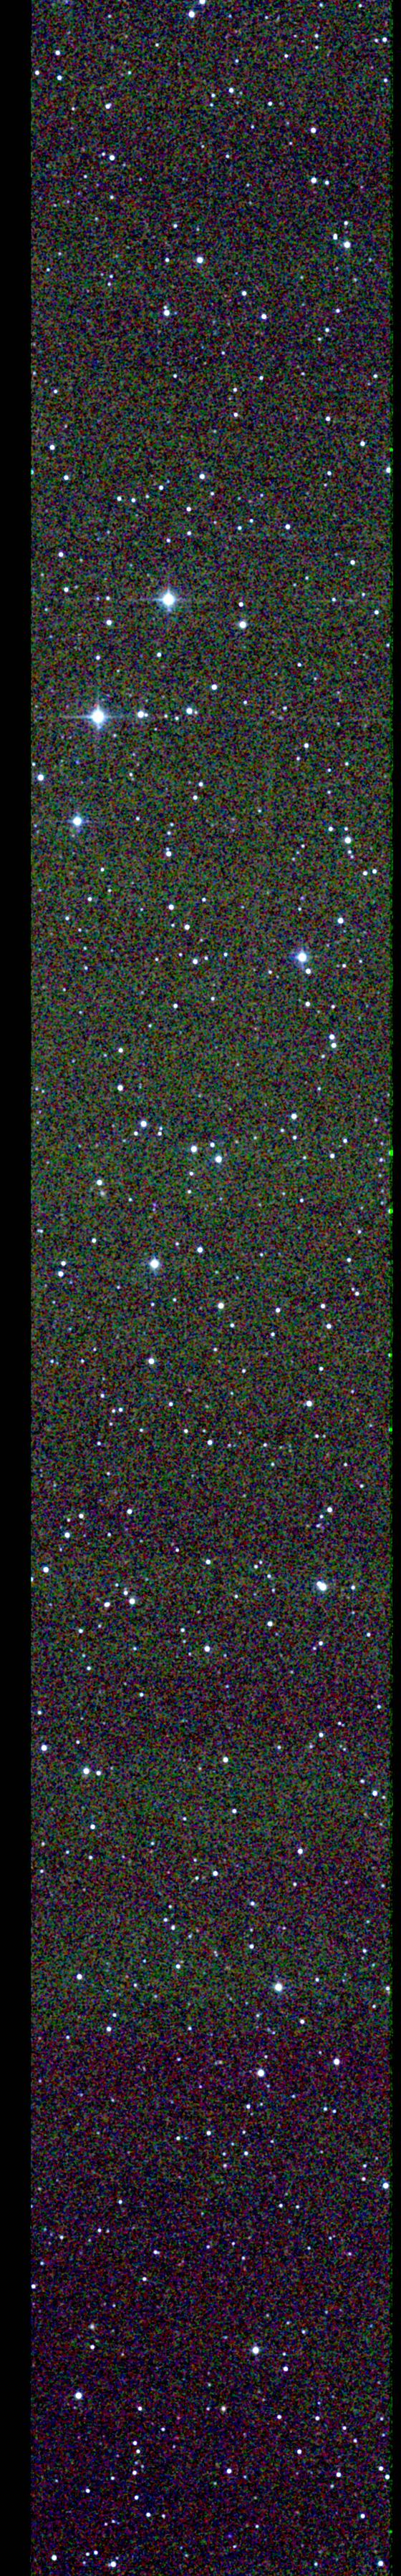
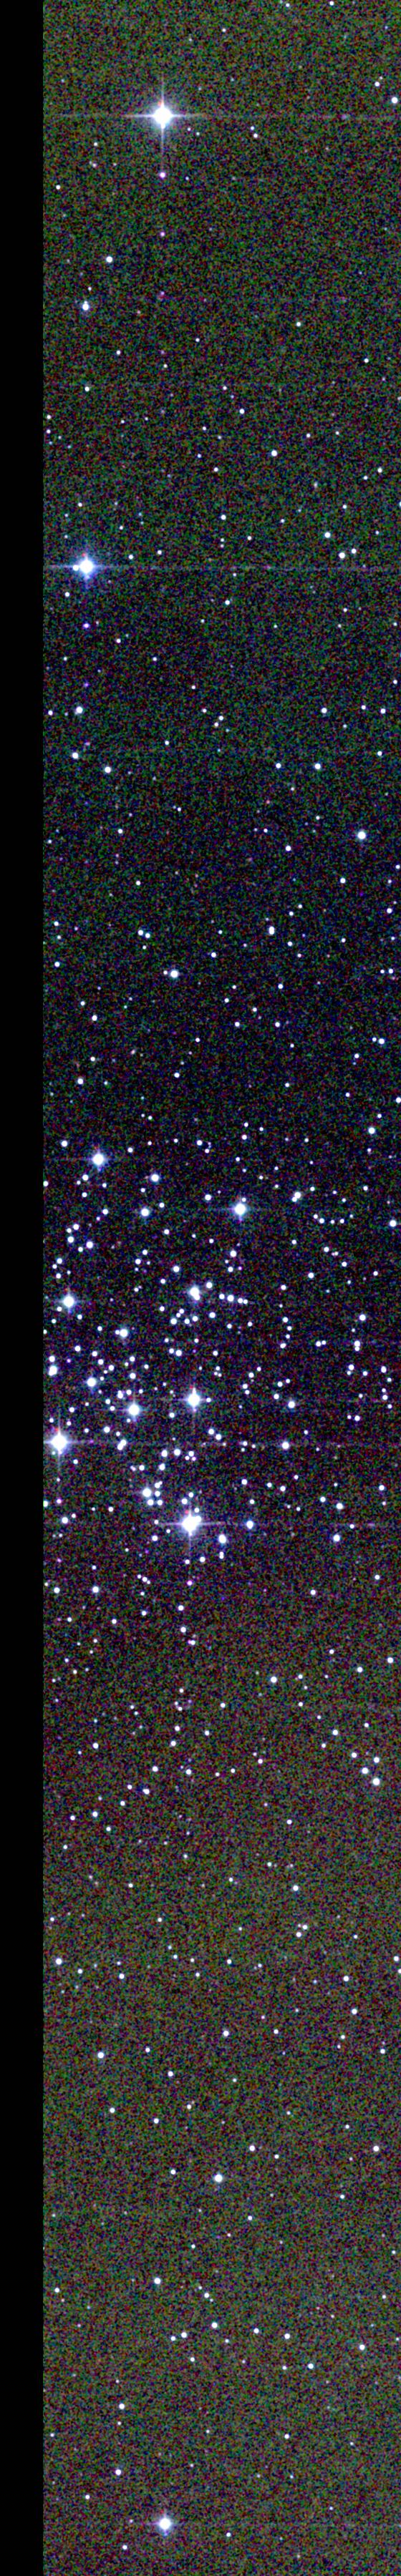
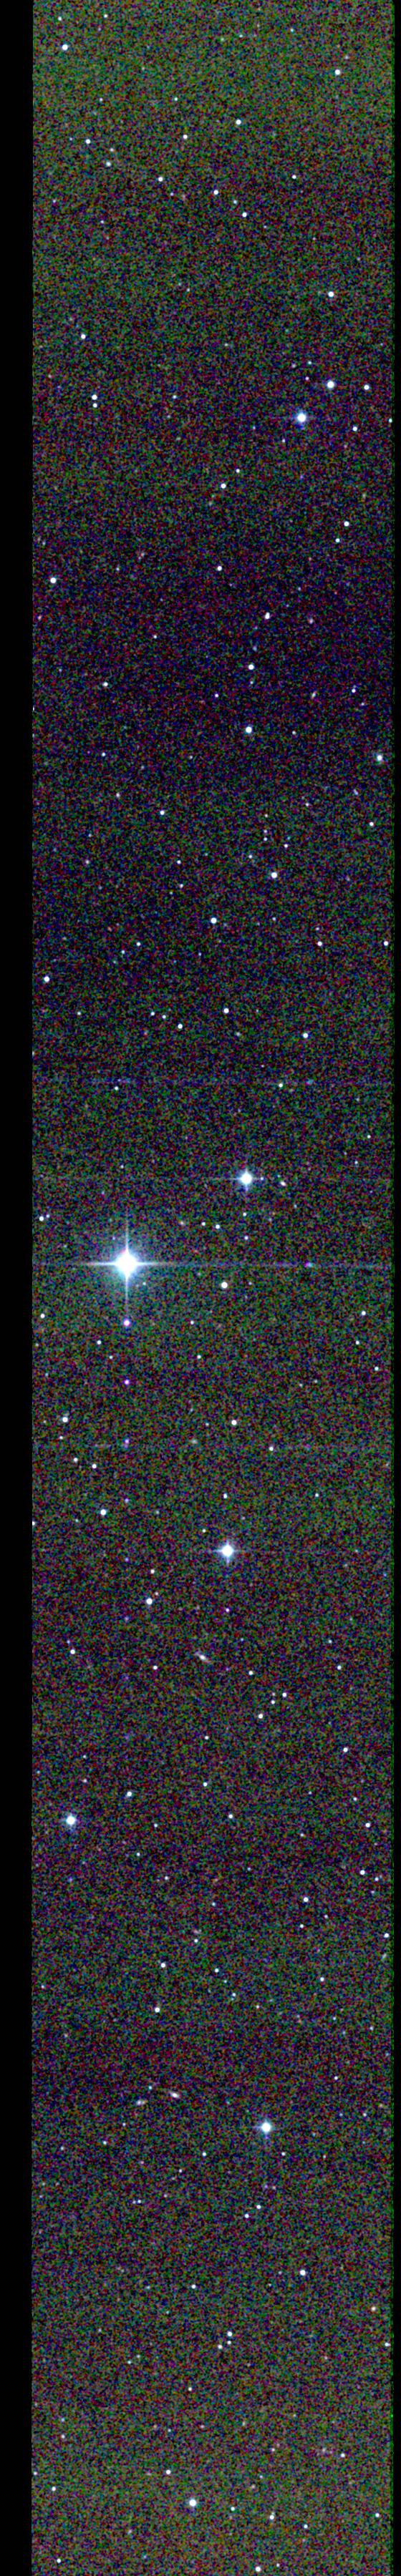
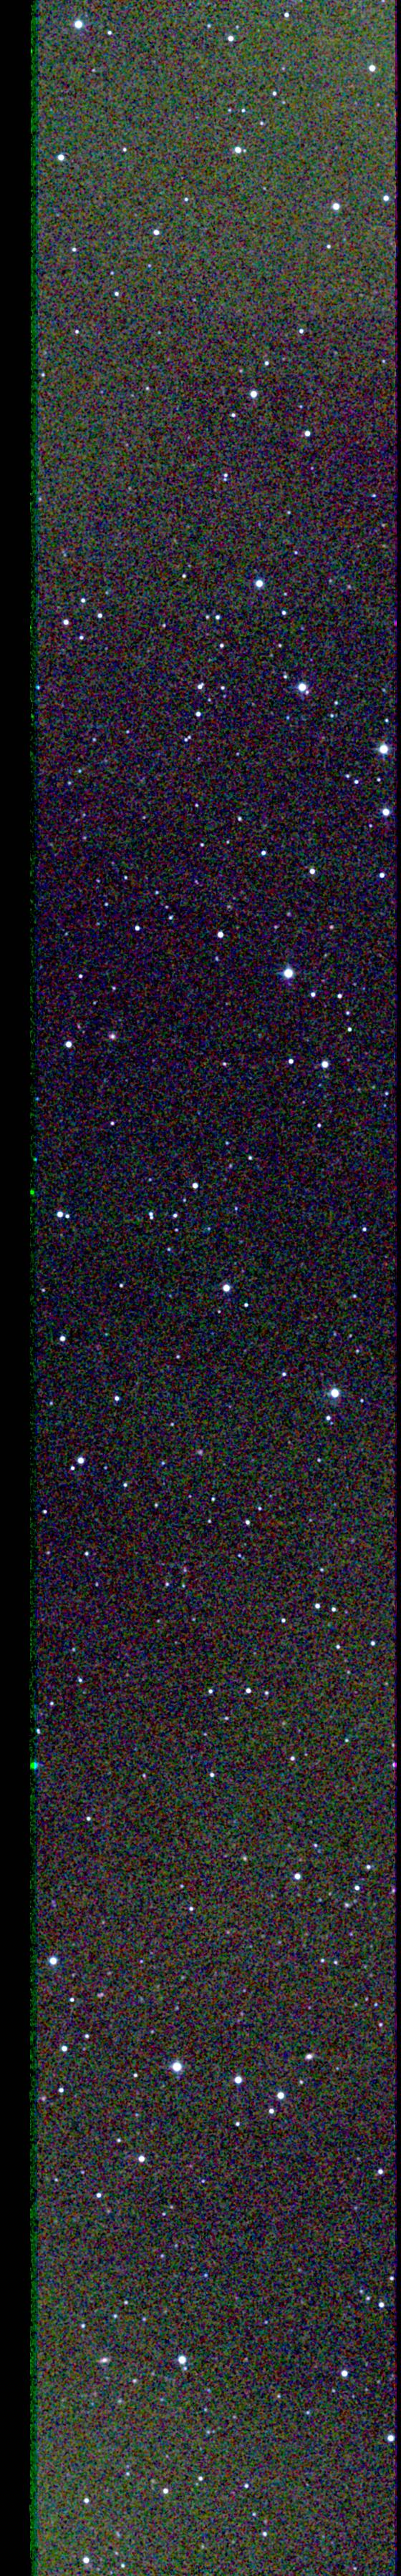
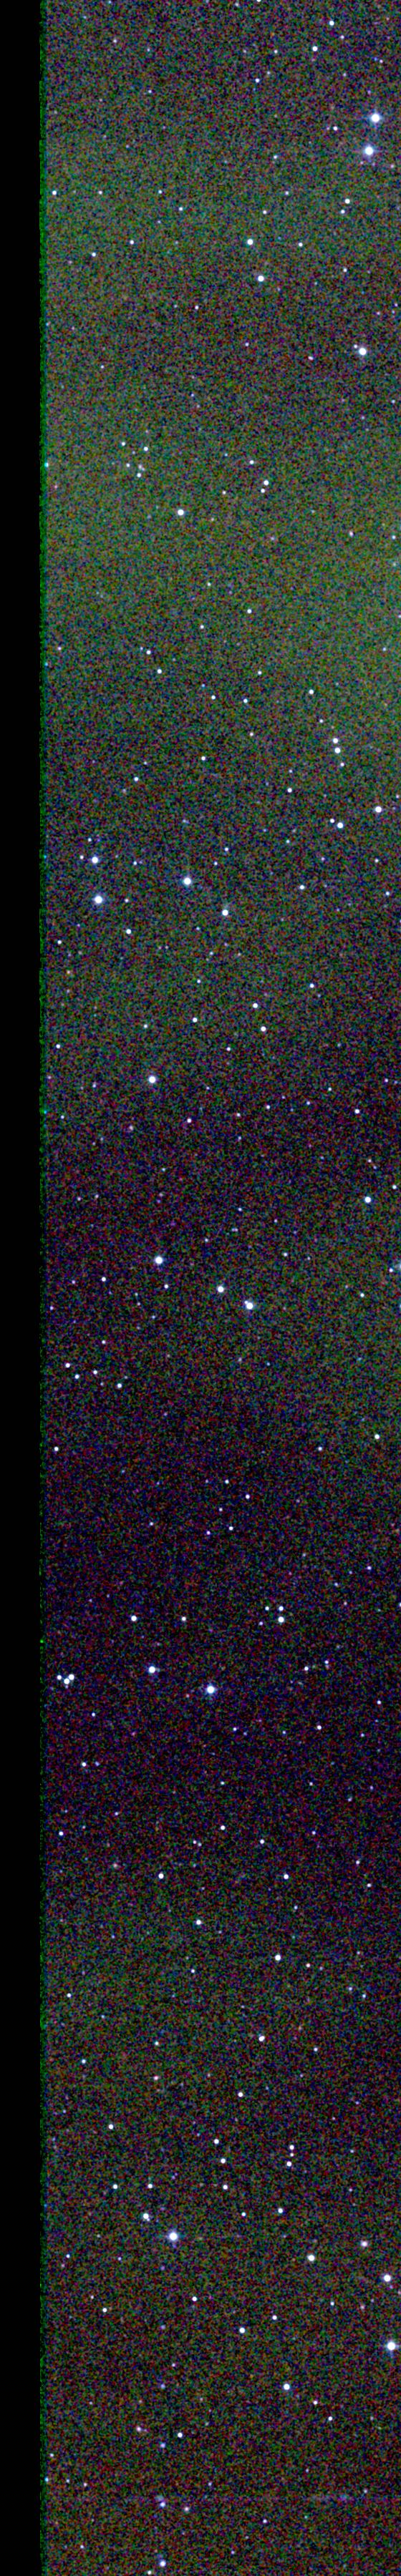
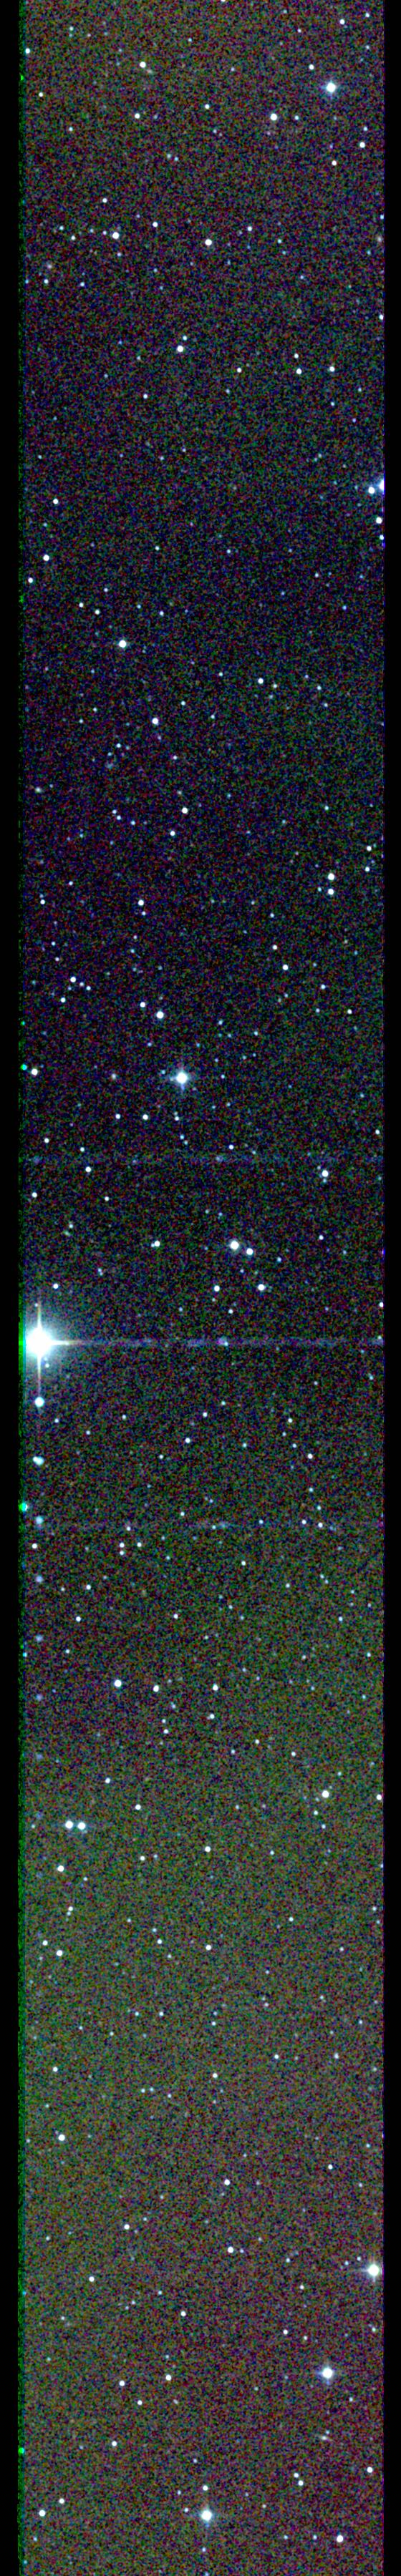
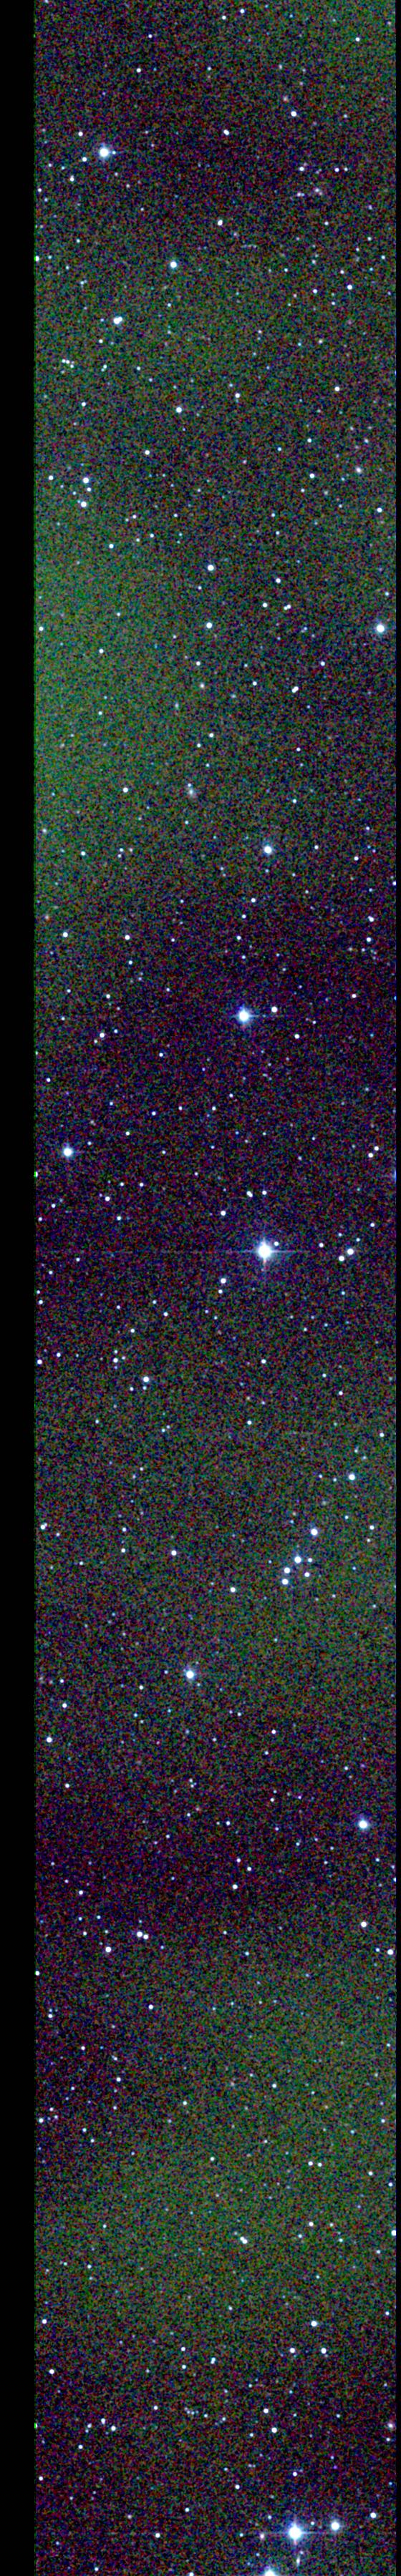
range of sensitivity. Ks-band images from the two scans of
the 90013 calibration field that have the worst and best estimated
sensitivities are shown in Figure 3. Note the differences
in image quality due to seeing and background structure.
The SNR=10 levels of the two images differ by ~0.8 mag.
The distributions in Figure 2 are qualitatively similar to those for the
main survey. Both
have comparable average and maximum sensitivity levels.
However, the calibration data include scans with sensitivities that
extend to lower levels than the survey scans because the calibration
data were not required to meet the survey's
sensitivity specifications.
11.5% of all calibration scans achieved SNR=10 levels at magnitudes
brighter than the survey's required levels (J=15.8, H=15.1,
Ks=14.3 mag). The low sensitivities most commonly occur
in the H-band (10.3% of the total) because of atmospheric OH airglow emission.
 |
 |
| Figure 1 - Point source photometric repeatability as a function
of mean magnitude measured in 6 scans of the 92409 field
on the night of 11/16/1997 UT. Black crosses are the root variances
for individual stars detected multiple times. The
green points are the average RMS levels measured in 0.5 mag wide bins.
The horizontal dashed line marks the SNR=10 (=0.1086 mag) levels. The vertical dashed lines represent the
SNR=10 levels required for the main survey.
|
Figure 2 - Distribution of SNR=10 point source sensitivity levels
achieved in all 2MASS calibration scans, estimated using atmospheric
transparency, seeing and background levels. These sensitivity levels
do not take into account the limitations of confusion. |
 |
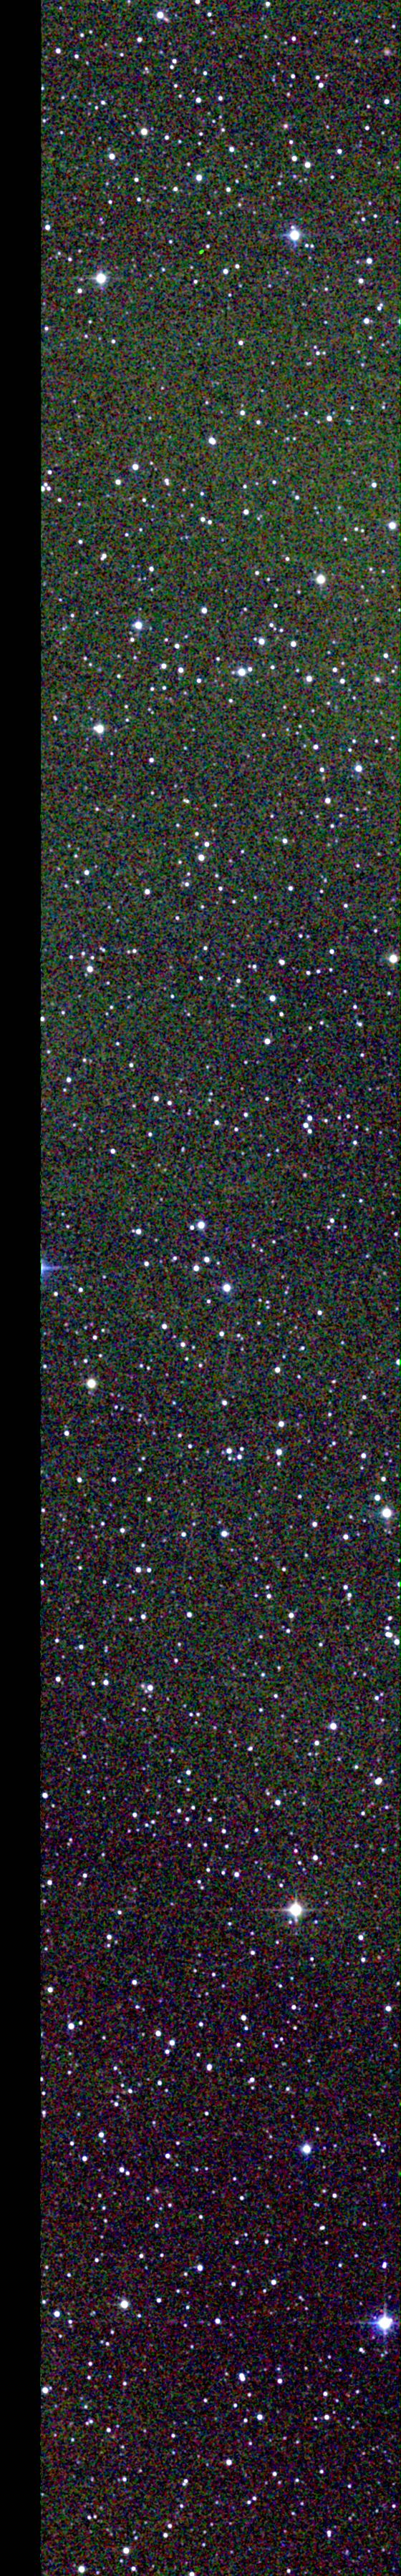
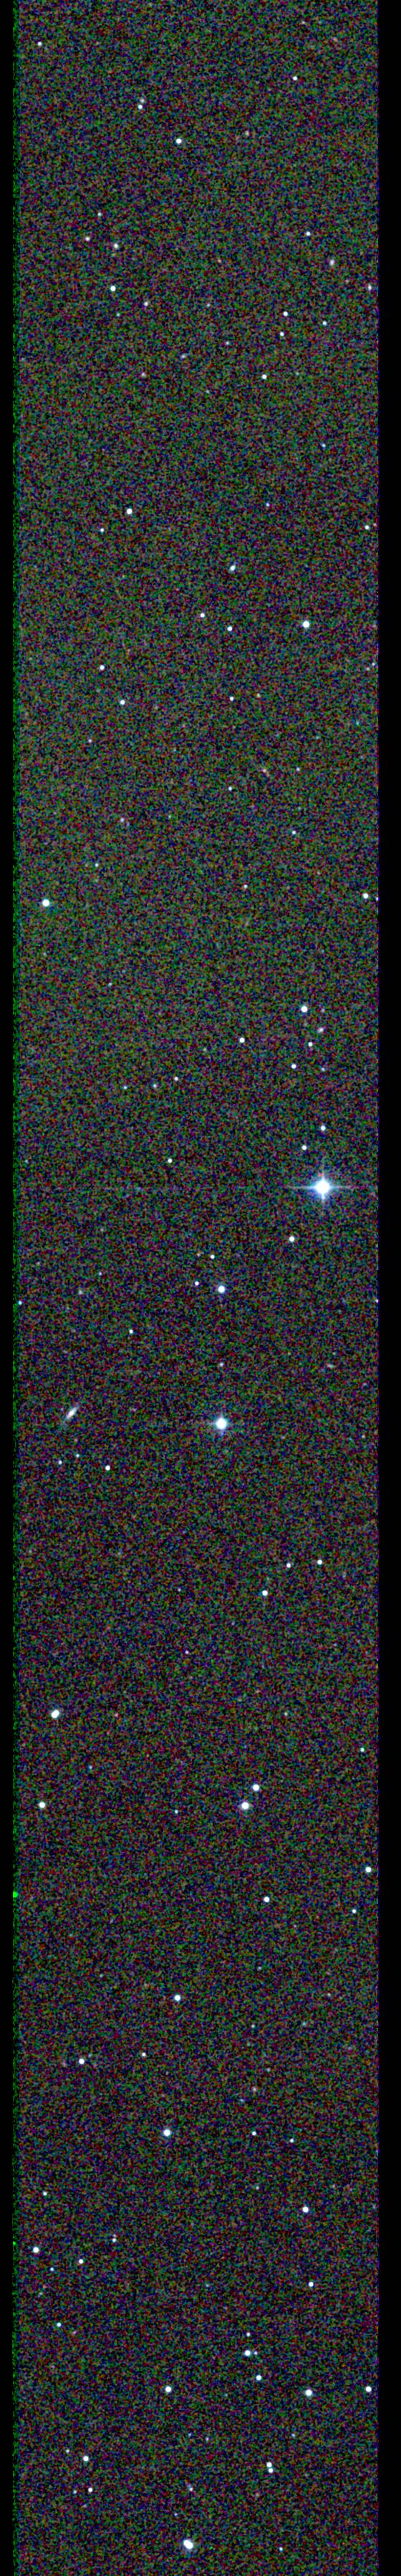
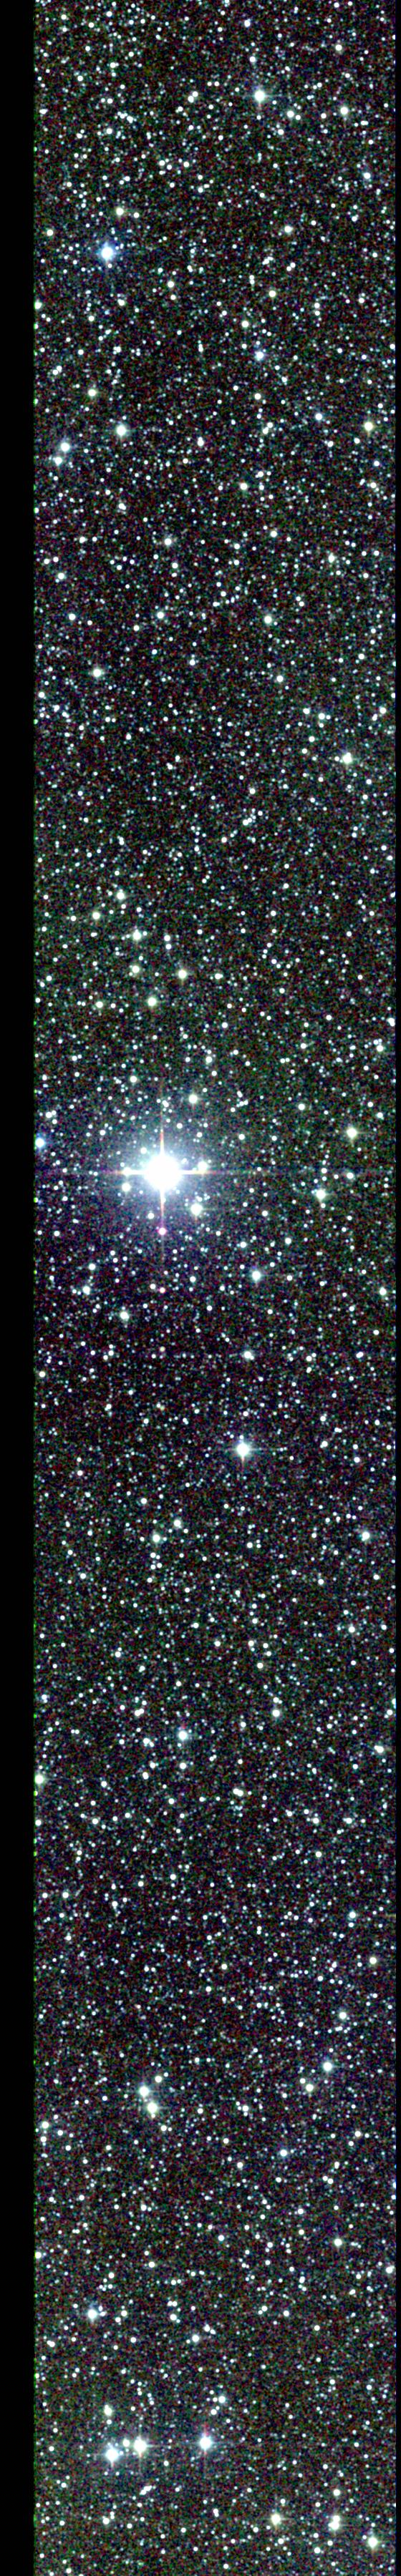
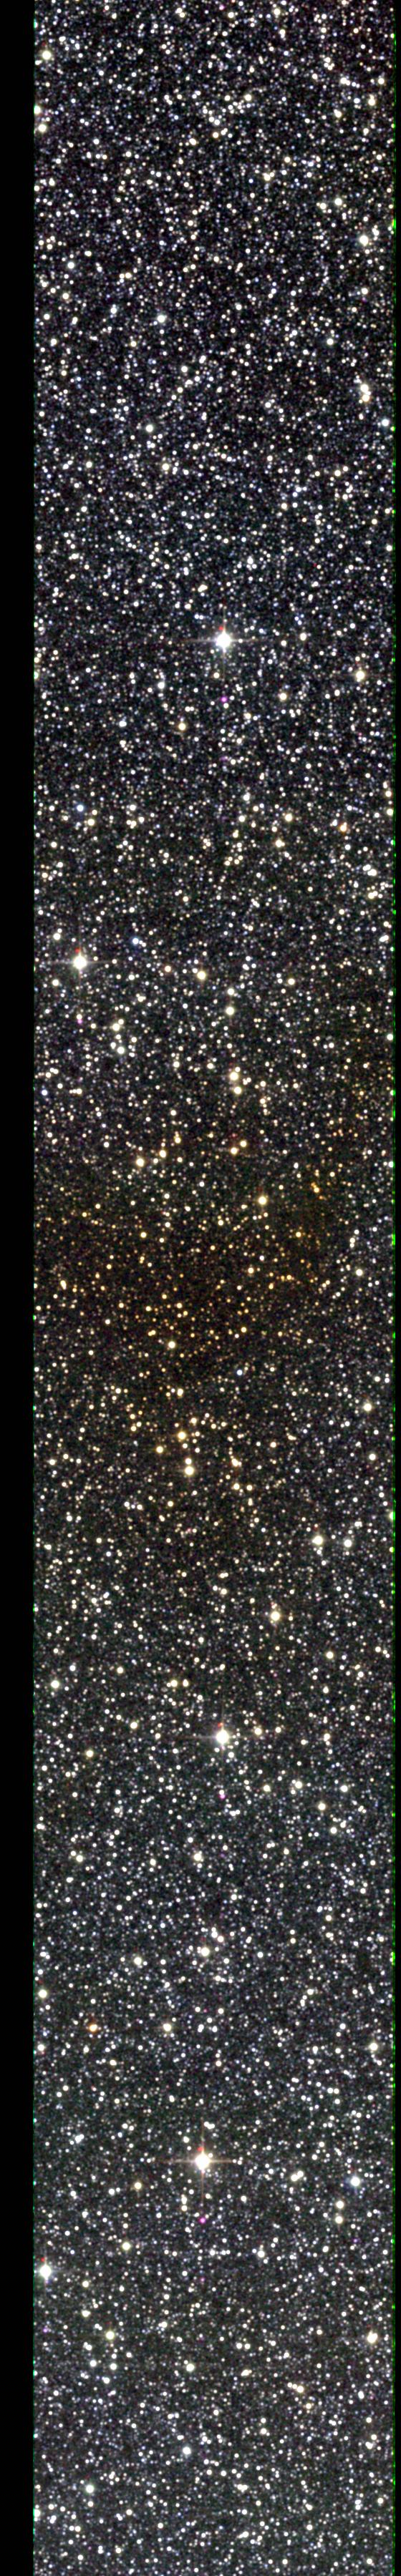
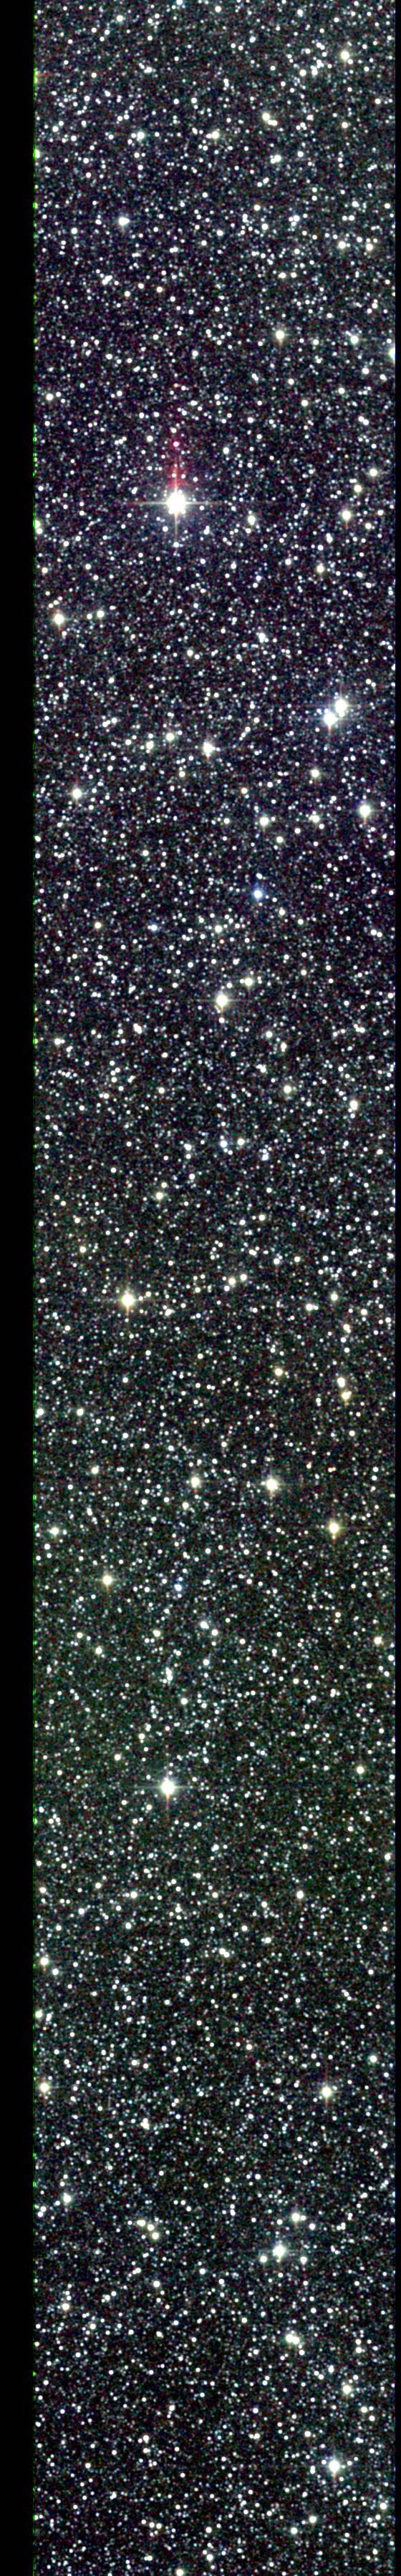
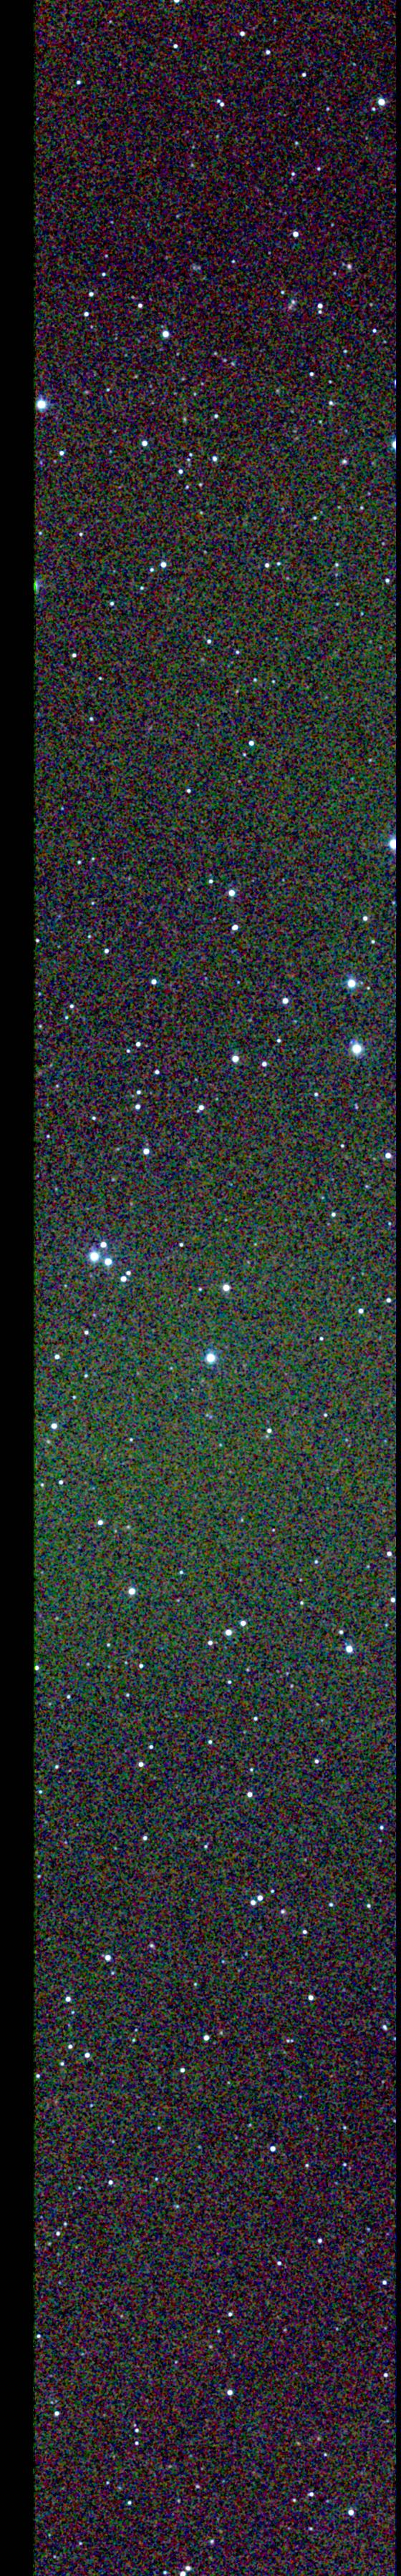
Figure 3 - Ks images showing the same 7'x7'
region in the 90013 calibration field from two scans with significantly
different achieved sensitivities. (left) Scan 37 from
12/07/1998 UT, SNR=10 @ 14.23 mag. (right) Scan 95 from 11/29/1999 UT,
SNR=10 @ 15.05 mag. |
There is no measurable bias between Calibration and Survey observation
photometry.
The links in the "All-Sky PSC Comparison/Photom." column in Table 1
lead to plots that compare point source photometry from the Cal-PSWDB and
the All-Sky PSC for each calibration field. The average Cal-PSWDB
point source brightness is used for these plots, and is taken from
the subset of Merged Cal-PSWDB sources detected
at least 500 times. Figures 4 shows the Cal-PSWDB/All-Sky PSC residuals
for all of the calibration fields on a single plot. The Cal-XSWDB/All-Sky XSC
residuals for extended sources detected at least 300 times
in all calibration fields are shown in Figure 5. Extended source residual
plots for the individual fields
are not provided because there are so few galaxies in the small areas
covered by each.
There are no systematic biases between photometry derived
from the calibration observations and the survey scans. This agreement is
more of a confirmation of the survey calibration effectiveness rather
than the accuracy of the calibration scan photometry, though.
Calibration scan photometry has slightly better calibration accuracy
than scans in the main survey because the calibration scans were
photometrically calibrated using the in situ measurements of
standard stars in each field (A4.4.a).
As a result, calibration scan zeropoint adjustments are
less affected by short timescale atmospheric transparency variations
and errors in fitting the nightly zeropoint solutions.
 |
 |
| Figure 4 - Differences between the average 2MASS Cal-PSWDB magnitude
of sources detected at least 500 times and magnitudes of the same sources
in the All-Sky PSC, plotted as a function of the average Cal-PSWDB magnitude.
Individual points represent the differences between the average source
magnitudes from the Merged Cal-PSWDB and All-Sky PSC. Contours trace
the density of points. |
Figure 5 - Differences between the average 2MASS Cal-PSWDB 7" circular
aperture magnitudes of sources detected at least 300 times and the
magnitudes of the same sources in the All-Sky XSC, plotted as a function
of the average Cal-XSWDB magnitude. Solid points represent the
photometric differences for non-confused merged groups. Open circles
are confused merges. The bright
Ks-band only confused
sources are detections of very red nebulosity in the
90009 calibration
field in rho Ophiuchus. |
Photometric measurements of bright,
non-saturated sources in the 2MASS
Cal-PSWDBs and Cal-XSWDBs have an internal precision of 1.5-2.0%.
The intrinsic measurement scatter increases monotonically
with decreasing brightness for J>13, H>12.5 and Ks>12 mag.
The repeatability of Cal-PSWDB and Cal-XSWDB photometry is
demonstrated in Figures 6-8 and 9-11, respectively. These diagrams
show the root variance flux (RMS) of the large number
of independent measurements of sources in the two WDBs
plotted as a function of the mean source brightness. The RMS values
are computed using statistics accumulated during the generation of the
Merged Calibration PSWDBs and XSWDBs. For
point sources, the combined default magnitude is used:
[JHKs] RMS = [jhk]_mstdev * sqrt([jhk]_n-1), where
[jhk]_mstdev
is the standard deviation of the mean
flux and [jhk]_n is the
number of detections going into the calculation of the
mean in each band. The combined fluxes in 7" circular apertures
are used for extended sources:
[JHK]7 RMS = [jhk]_mstdev_7 * sqrt([jhk]_n_7-1).
The distributions each show a well-behaved locus of points that
has an approximately constant RMS value of 0.015-0.020 mag for bright
but non-saturated sources, and that rises systematically towards
fainter flux levels. The photometric dispersions are larger for
the flux estimates of fully saturated sources (J<5.5, H<5 and
Ks<4.5). There is also small population
of sources at all non-satured flux levels that extend to higher RMS values
than the main loci.
The constant RMS value for bright sources
corresponds to the fundamental precision limit to individual
2MASS measurements in the non-photon noise-limited regime dictated
by PSF undersampling effects due to the
large 2MASS detector pixels.
The dispersion increases for fainter sources approximately as the
inverse square root of the source brightness,
as expected from photon statistics. Although it is not apparent from
these diagrams, the growth of the point source RMS values flattens slightly
faintward of J>16.2, H>15.6 and Ks>14.8. This slope
change occurs because the merged source statistics include only detections
in each band. Low SNR sources fainter than the completeness limits
are detected preferentially when noise drives up their apparent
brightness, resulting in an overestimate in flux and underestimate
in measurement dispersion.
 |
 |
 |
| Figure 6 - J-Band | Figure 7 - H-Band | Figure 8 - Ks-band |
| Root variance (RMS) flux for all
sources in the Cal-PSWDB detected at least 500 times, plotted as a function
of the average brightness. The average magnitudes and RMS values are
taken from the Merged Cal-PSWDB:
[JHKs] RMS = [jhk]_mstdev*sqrt([jhk]_n-1). The small
red points represent individual merged sources. Black contours trace the
surface density of the points. |
 |
 |
 |
| Figure 9 - J-Band | Figure 10 - H-Band | Figure 11 - Ks |
| Root variance (RMS) flux in 7" circular apertures for all
sources in the Cal-XSWDB detected at least 300 times, plotted as a function
of the average brightness. The average magnitudes and RMS values are
taken from the Merged Cal-XSWDB:
[JHKs] RMS = [jhk]_mstdev_7*sqrt([jhk]_n_7-1).
The solid red points are from non-confused merged groups. Open circles
are from confused groups. |
The elevated measurement dispersion seen for some objects in
Figures 6-11 may be caused by a number of effects, the most interesting
of which is true flux variability. However, large measurement scatter
is most frequently the result of measurement contamination due to
confusion
with one or more nearby objects or nearby
image artifacts.
PSF-fit measurements in the Cal-PSWDB of objects that are actually
extended or marginally resolved will also exhibit artificially large
measurement dispersions because of centroiding uncertainties and the
poor match between the PSF and true source profile. Similarly,
measurements in the Cal-XSWDB of extended "sources" that are actually
detections of galactic
nebulosity or compact groups of point sources will not repeat
consistently because of centroiding variations and source
characterization difficulties. For example, most of the
confused extended sources with large photometric scatter
seen only in the Ks-band are detections of red
nebulosity in the 90009
calibration field in rho Ophiuchus. The few non-confused sources with
larger photometric dispersion in the Merged Cal-XSWDB are
actually detections of a compact, embedded clusters in the
low latitude 90312
calibration field, not galaxies.
The Merged Calibration Point and Extended Source WDBs
contain several cautionary flags
that indicate if any of the conditions are present
that may lead to artificially large photometric dispersions.
These "Merge Quality" flags
and their use are described in A6.2.v.
To identify measurements of objects in the Cal-PSWDB and Cal-XSWDB
that have the least likelihood of contamination, select
entries that are associated with groups in the Merged Cal-WDBs
that have:
- gcnf = 0
- n_galcontam = 0 (for point sources only)
- ce_flg = 0 (for point sources only)
Use of the merge photometry caution flag
(ce_flg) constraint is very conservative, and may
result in the rejection of uncontaminated groups. This
is particularly true for the calibration WDBs because with thousands
of independent measurements the probability is relatively high
that one or more measurements may be affected by the
conditions
tracked by ce_flg.
Figure 12 shows the flux
chi-squared statistic distributions for all objects in the Merged
Cal-PSWDB that satisfy the above criteria and that were detected at least
80% of the time they were observed (to insure reliability).
Objects with large flux chi-squared
values in this clean sample have the highest probability of being
true flux-variable point sources. J-band light curves of three
representative objects in the 90067 (M67) calibration field drawn
from the individual measurements in the Cal-PSWDB are shown in Figure 13.
The measurement distribution of the first of these objects,
2MASS J08512240+1151291, shown in the top panel, has a small RMS and
low chi-squared value consistent with the majority of objects
in Figures 6 and 13. Its lightcurve shows no evidence for variability.
The second and third objects, 2MASS J08510483+1145568 and
2MASS J08512530_1202563, have larger RMS and chi-squared values than
the main locus of points in Figures 6 and 13, and the spread
in their lightcurves is larger than that of 2MASS J08512240+1151291.
Both of these are previously
known variable stars. The former is a W UMa variable contact binary
identified in the M67 by
Stassun et al. 2002, and the latter is the peculiar spectroscopic
binary AG Cnc (e.g. van den Berg et al. 2002).
 |
 |
| Figure 12 - Flux chi-squared distributions for sources in the
Merged Cal-PSWDB that have gcnf=0,
ce_flg=0, and n_galcontam=0, >80% detection rate, and
>100 detections per band. Lightcurves for the three objects
denoted by the magenta circles in top panel are shown in Figure 13. |
Figure 13 - Lightcurves of three representative sources selected from the
"clean" subset of the Merged Cal-PSWDB in the 90067 calibration field.
2MASS source designations are from the All-Sky PSC.
Shown in the top panel is an example of a source with a low RMS,
low chi-squared flux distribution. The middle and bottom panels
are objects selected to have distributions with larger RMS and
chi-squared values. These are both previously known variable stars:
(center) P=0.36d W UMa variable, and (bottom) AG Cnc - a
P=2.8d peculiar spectroscopic binary.
|
iii. Astrometric Properties
Source positions in the 2MASS Cal-PSWDBs and Cal-XSWDBs are reconstructed
with respect to the
USNO-A2.0
catalog. Because the
Tycho 2
catalog was used as the astrometric reference for the main survey,
positions in the Calibration scan products exhibit systematic offsets of up to
approximately 0.6" with respect the the All-Sky PSC and XSC.
Position reconstruction for sources detected in the 2MASS Calibration
observations was carried out using the
USNO-A2.0
catalog as the primary astrometric reference rather than
Tycho 2 which was used
for the main survey (A4.4.b).
Because of small, systematic offsets between
these two reference catalogs, similar biases exist between
the Cal-WDB positions and those in the All-Sky PSC and XSC.
The "RA_bias" and "Dec_bias" columns in Table 1 contain links
to diagrams that show the RA and Declination offsets between the
mean position of sources detected multiple times in the Cal-PSWDB
and the position of those sources in the All-Sky PSC for
the individual calibration fields. The astrometric biases are
position-dependent within the calibration scans, and they differ
in amplitude and structure between calibration fields. However,
they are consistent among all scans of a given calibration field
Figures 14 and 15 show the RA and Dec Cal-PSWDB/All-Sky PSC position
residuals for all calibration fields on the same diagram.
The grouping of points in RA and Dec corresponds to the location
of individual calibration fields. The vertical scatter among
the points for each field can be as large as 0.2-0.3", and is
indicative of the systematic behavior of the astrometric bias
within the fields.
Because of the astrometric biases in the Cal-PSWDB and Cal-XSWDB,
users should defer to the absolute position of objects given
in the All-Sky PSC and XSC whenever possible.
 |
 |
| Figure 14 - Average declination offset between stars in
the Cal-PSWDB and All-Sky PSC, plotted as a function of declination.
The discrete groups of points correspond to the individual calibration
fields. Average Cal-PSWDB positions taken from the Merged Cal-PSWDB. |
Figure 15 - Average right ascension offset between stars in
the Cal-PSWDB and All-Sky PSC, plotted as a function of right ascension.
The discrete groups of points correspond to the individual calibration
fields. Average Cal-PSWDB positions taken from the Merged Cal-PSWDB. |
2MASS Cal-PSWDB source positions have an average
internal radial repeatability of 60 mas over the
range 9<Ks<13.5. The scatter in position measurements
for fainter sources increases
monotonically with decreasing source brightness.
The consistency of position reconstruction in the Cal-PSWDB is
illustrated in Figure 16 which shows the average radial separations
between individual positions and the mean position of objects
detected >100 times in the Cal-PSWDB
plotted as a function of the mean source Ks brightness.
This diagram
is constructed using the sep_avg
parameter in the Merged Cal-PSWDB Information Table.
The positions of sources in the 9<Ks<13.5 mag
range are repeatable to ~60 mas radially.
Brighter sources that are measured in the 51 ms READ1 exposures
exhibit slightly larger position residuals because
of the effects of seeing on the short exposures. Position residuals
increase with decreasing source brightness for objects fainter
than Ks>13-14 mag. This positional repeatability is
comparable to that of the All-Sky PSC
(II.2.f).
The green circles in Figure 16 correspond to
several nearby M-dwarf stars that are the primary photometric standards
in several of the calibration fields: BRI0021-0214 in 90021, LHS191
in 90191, LHS2026 in 92026, LHS2397a in 92397, TVLM 868-53850 in 90868,
and BRI2202-1119 in 92202). These objects all have significant
proper motions (200-1000 mas/yr), and each stands out clearly as
having large average radial separation parameters for their
brightness.
The astrometric dispersion for objects in the
Cal-PSWDB and Cal-XSWDB may be artificially elevated by the same confusion
and resolution effects discussed above
that result in degraded photometry.
As with the photometric precision, the sources least likely
to have contaminated position reconstruction will be those that
correspond to unconfused groups in the Merged Cal WDBs (gcnf=0).
An important caveat to this is that high proper
motion objects that move farther than 2",
the correlation radius used to
merge the Cal-PSWDB, during the time covered by the 2MASS observations,
may be split into multiple, confused groups. For example, the
individual detections of LHS191 (mu = 1049 mas/yr)
is split into three groups,
and would be missed in a selection of sources limited to groups
with gcntr=0.
 |
| Figure 16 - Average radial separation
(sep_avg) from the mean
position of objects detected >100 times in the Cal-PSWDB, plotted as
a function of average source brightness. The red points represent individual
objects and the black contours trace the density of points.
The average separation is taken from the
in the Merged Cal-PSWDB Information table.
Only unconfused groups not identified with extended objects are shown.
The green circles indicate the position of nearby M-dwarf stars in
several calibration fields with large proper motions. |
iv. Completeness and Reliability
The 99% completeness limits of the full Cal-PSWDBs are in the
range 15.5<J<16.5, 14.5<H<15.5 and 14.0<Ks<15.0.
The spread in completeness levels is a result of different
source surface densities in the calibration fields,
and the variation in atmospheric conditions in which each field
was observed.
Average J, H and Ks completeness curves for the
2MASS Cal-PSWDBs are shown in Figure 17.
In these figures, completeness is computed as the ratio of the number
of times a source was detected in a band to the total number
of times it was observed,
[jhk]_n/spos,
using statistics accumulated
in the Merged Cal-PSWDB Information Table.
Although the objective of the 2MASS calibration observations was
to measure the relatively bright standard stars in each field,
source detection thresholds were set to the same low level (SNR~3.5)
that used for the main survey scans. As a result,
the completeness of detections in the calibration scans is
comparable to that achieved in the main survey
observations.
The completeness curves in Figure 17 exhibit nearly one magnitude
of spread in the brightness at which they begin to turn over.
This spread is a consequence of the very different source density
regions sampled by the 2MASS calibration observations, and
the differing atmospheric conditions in which each field was measured.
An approximately constant SNR threshold was used for source
detection during all 2MASS data processing, but the noise estimate
included the contribution of source confusion. Therefore, high
source density fields in which confusion noise is significant
have a brighter detection threshold than sparse fields at high galactic
latitude. As described in A4.2.i,
the achieved sensitivity can vary by nearly one magnitude among
observations of each individual calibration field because of
differing atmospheric seeing, background and transparency conditions.
Source extractions in the Cal-PSWDBs that are not identified as
artifacts are highly reliable for J<16, H<15.5 and
Ks<15 mag. However, the total fractional reliability
of the Cal-PSWDBs is ~20% for the fields with the lowest source
surface density and ~90% for the highest source density fields.
The differential reliability of extractions
in the 2MASS Cal-PSWDBs as a function of magnitude is illustrated
in Figure 18. Reliability here is defined as the ratio
of the number of reliable source detections to the total
number of extractions in all observations of a calibration field.
Cal-PSWDB extractions that are identified as image artifact
detections (cc_flg=[P,C,D or G])
are excluded.
Reliable source detections are identified using the same repeatability
analysis described in A5.2 that
is used to define the reliability scoring criteria for the
Survey, 6x and Calibration PSWDBs.
In addition to the reliable detections of astrophysical sources,
the Cal-PSWDB contains a large number of spurious extractions
of faint noise excursion near and below the reliability limits
shown in Figure 18.
Figure 19 shows the total fractional reliability of each
calibration field plotted as a function of
the surface density of all extractions.
The total fractional reliability is
the ratio of the total number of reliable source detections,
as defined by the reliability criteria discussed in
A5.2, to the total number of extractions
in the Cal-PSWDB. The fractional reliability of the Cal-PSWDB
is highest in the most dense calibration
fields, and lowest in the sparsest calibration
fields. This seemingly counterintuitive dependence, and the
approximately constant number of extractions for the lower
density fields is a consequence of how source detection thresholds were
allowed to adjust dynamically in response to increasing confusion noise
during 2MASS data processing. Detection thresholds were set at
intentionally low SNR levels to maximize completeness
in sparse fields where confusion is least likely to corrupt measurements.
Detection thresholds adjusted to conservative levels in dense fields because
source confusion ultimately limits measurement accuracy.
Because of the large number of spurious extractions
that are present in the Cal-PSWDB and Cal-XSWDB,
all entries are assigned a reliability
score (rel) that is related to the probability that
the extraction is the detection of a real astrophysical source
at the time of the 2MASS observation. Select WDB extractions
that have a reliability flag value of rel="A" to minimize the
number of spurious extractions. Caution should be exercised when using
any Cal-PSWDB or Cal_XSWDB extractions with a lower probability of
reliability.
 |
 |
 |
| Figure 17 - Completeness curves for the 2MASS Cal-PSWDB. Completeness
computed as the ratio of the number of times a source is detected
to the number of times it was observed, [jhk]_n/spos, using statistics
from the Merged Cal-PSWDB. Only merged sources detected >100
times in at least one band are included. |
Figure 18 - Differential reliability as a
function of J, H and Ks magnitude for the
extractions in the 2MASS Cal-PSWDB that are not flagged as artifacts.
Derived using the repeatability analysis described in
A5.2. |
Figure 19 - Total fractionally reliability of extractions in each
2MASS calibration field plotted as a function of the surface
density of all extractions. The fractional reliability is the ratio
of the number of reliable source detections, as defined in
A5.2, to the total number of extractions
in the multiple observations of the field. |
[Last Updated: 2008 February 18; by R. Cutri]
Previous page. Next page.
Return to Explanatory Supplement TOC Page.


