The accuracy of the input coordinates, and of the pointing, have a large impact on the instrumental throughput, of the point source flux accuracy but only a minor impact on the wavelength accuracy of SWS for point sources. ISO's random pointing error can also introduce effects in the data if the target coordinates are incorrect or if the target is in a crowded field.
Normal ISO pointing accuracy (blind pointing) has been improving from about 4'' at the start of the mission to approximately 1'' half way through (See section 3.3 of the ISO Satellite Data Users Manual (ISO DUM ) for a discussion of pointing and improvements through the mission). While any wavelength error is of the order of the quoted accuracy, the flux error due to the pointing may well limit the final flux accuracy.
A star offset from the center of the aperture by 6 '' in the cross-dispersion
direction (y-axis ) loses approximately 40% in throughput
(example taken in the LW, 17 ![]() ). If you have incorrect target coordinates
your derived flux may be off by large factors.
). If you have incorrect target coordinates
your derived flux may be off by large factors.
An offset in the dispersion direction (z-axis ) affects the wavelength calibration, but the effect is not of the same order of magnitude as the effects on flux. A 4'' mispointing in the dispersion direction corresponds to about a 1 LVDT (1/8 grating resolution) wavelength offset, so the maximum possible offset is about 2 LVDT , or about 1/4 of a grating spectral resolution element.
This error is within the quoted wavelength accuracy.
Observers may note what appears to be `noise' in their data. In the AAR this effect manifests itself as sudden flux jumps between adjacent wavelength regions and the up and down scans having different flux levels. Both these effects can be seen in figure 5.9, with the first effect also seen in 5.10.
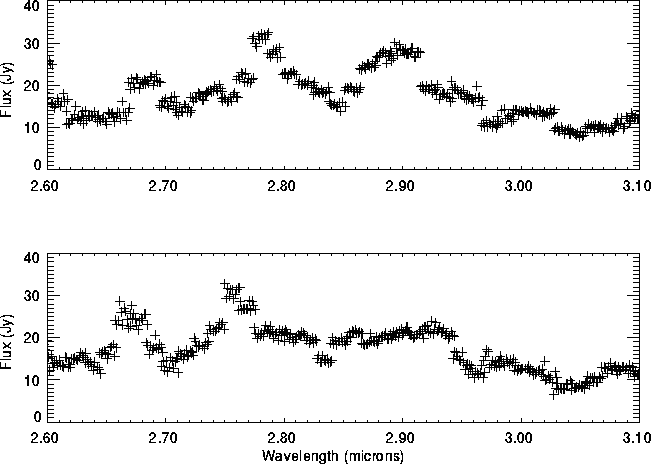
Figure 5.9: Effect of pointing jitter as seen in AAR. Top plot is the
down scan (up in wavelength), bottom plot is the up scan. The difference is
due to pointing jitter.
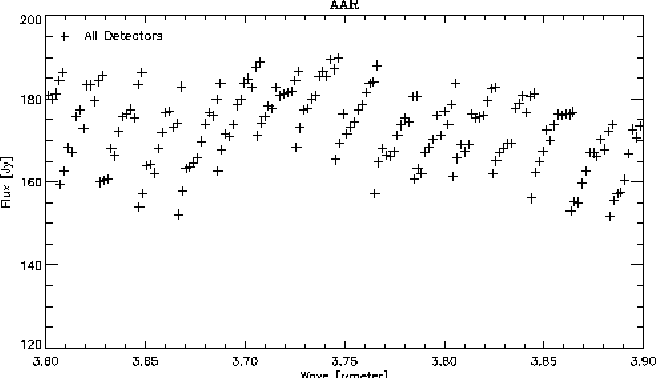
Figure 5.10: Effect of pointing jitter as seen in an up-scan of an
AAR, showing the different illumination of each detector in the band. The
observation was shifted by -2.6'' in the y-axis and 0.46'' in the z-axis.
This `noise' can be seen in the SPD (see figure 5.11) as sudden jumps in the signal levels with time. A careful check of the SPD will show no signs of glitches or signal jumps (such as single detector signal jumps) that could cause this effect. The jumps will not be correlated in the up and down scans.
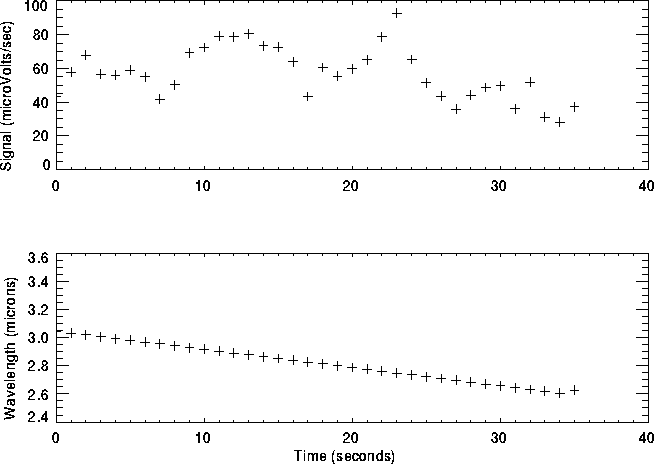
Figure 5.11: `noise' as seen in the SPD. Up scan and wavelength
observed as a function of time
Also, the signals (in either the SPD or AAR) can appear to be much noisier than the signals of other objects with similar flux levels.
Currently this effect is understood to be a function of incorrect positions being given for the observation (or the object studied being in a crowded field), the instrumental beam profile and the pointing jitter of ISO.
![]() As is reported in ISO INFO issue 10
(http://isowww.estec.esa.nl/isoinfo/isoinfo-10/) the pointing jitter was
improved from
As is reported in ISO INFO issue 10
(http://isowww.estec.esa.nl/isoinfo/isoinfo-10/) the pointing jitter was
improved from ![]() 4'' at the start of the mission and is now
4'' at the start of the mission and is now ![]() 1''.
1''.
![]() At the short wavelengths the instrumental beam profile has a
triangular shape in the y (non-dispersion) direction and a top-hat shape in
the z (dispersion) direction. A preliminary reduction of the beam profile data
for band 1D (3.1
At the short wavelengths the instrumental beam profile has a
triangular shape in the y (non-dispersion) direction and a top-hat shape in
the z (dispersion) direction. A preliminary reduction of the beam profile data
for band 1D (3.1 ![]() ) shows that the beam profile goes from 100% to 10%
smoothly going from the centre to
) shows that the beam profile goes from 100% to 10%
smoothly going from the centre to ![]() 15'' away in the y-direction. In
the z-direction however, it goes from 90% to 10% going from 3 to 9'' away -
the beam profile is very steep in this direction.
15'' away in the y-direction. In
the z-direction however, it goes from 90% to 10% going from 3 to 9'' away -
the beam profile is very steep in this direction.
If an object is misaligned from the slit centre in the y-direction then as the pointing jitters the object will move up and down a slowly varying response function. Hence the incident flux seen by the detectors will vary smoothly by small amounts. This will probably not be seen in the data.
If, however, an object is misaligned from the slit centre in the z-direction, slight shifts in the spacecrafts pointing will cause the object to be moved up and down the very steep beam profile. As an example, a misalignment of 5'' in the z-direction in band 1D will reduce the incident flux on the detectors by 50%. The 1 arcsec jitter will then move it from the 70% contour to the 30% one - the incident flux can change by more than a factor of 2 on short time intervals.
Figure 5.12 shows an example of the correlation between flux jumps and pointing jitter. The observation was performed approximately 3 arcseconds off-source in the z-direction. The three figure panels cover exactly the same period of time. The top and the middle panel display the AAR, flux versus wavelength and versus time, respectively, taking only the down-scan. Note that the flux values for the twelve detectors are associated by definition with the start time of the corresponding ramps, which is why in the middle figure flux values are clustered on the x-axis. The bottom panels show the evolution of the pointing jitter dz in the dispersion direction. The vertical lines indicate the start time of each ramp (to better visualize the relation with the middle panel). As can be seen, each increasing flux jump is associated with a sharp decrease of dz to negative values during the ramp measurement, while jumps to lower fluxes are seen in relation with increases of dz to positive values.
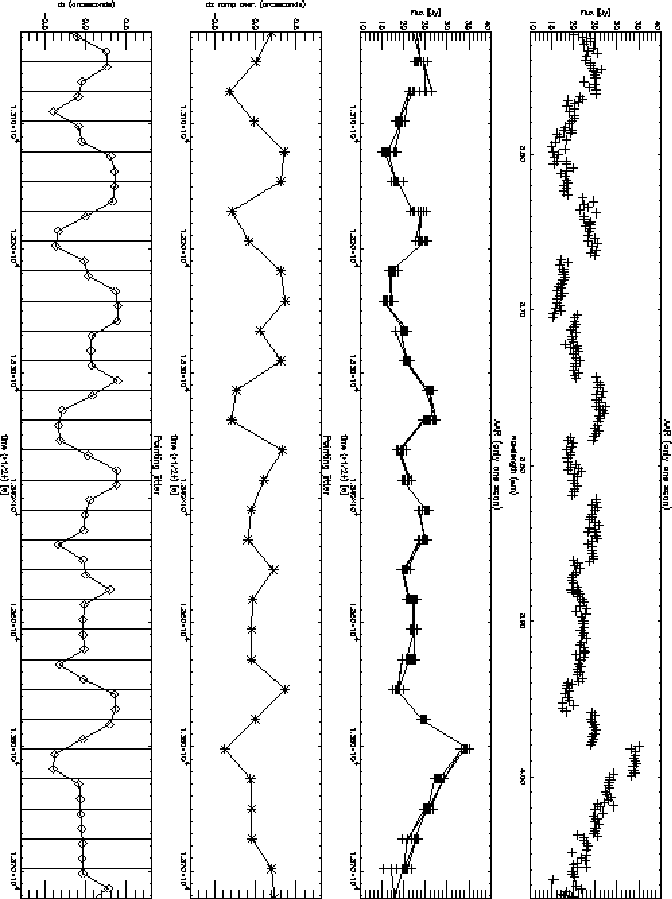
Figure 5.12: Correlation between AAR fluxes and spacecraft
jitter
This reason for the flux jumps also explains the increased noise. Each of the detectors 24Hz readouts (contained in the ERD) are from (slightly) different incident flux levels. This introduces extra noise into the system when the pipeline tries to fit a slope to the 24Hz readout data.
This effect, primarily noticeable at short wavelengths, can happen if:
![]() the entered pointing is incorrect by more than
the entered pointing is incorrect by more than ![]() 4
arcseconds
4
arcseconds
![]() there is another object, with a flux similar or greater than the
target, 4 - 10 arcseconds away in the z-direction. This can happen in crowded
fields. As noted above, since users have no way of knowing what he roll angle
of the spacecraft will be it is best to ensure there are no other objects
within 10'' of the intended target.
there is another object, with a flux similar or greater than the
target, 4 - 10 arcseconds away in the z-direction. This can happen in crowded
fields. As noted above, since users have no way of knowing what he roll angle
of the spacecraft will be it is best to ensure there are no other objects
within 10'' of the intended target.
Any pointing error less than ![]() 4 should not translate into this effect.
Any pointing error larger than
4 should not translate into this effect.
Any pointing error larger than ![]() 20'' (or another object being
this distance away) cannot be rotated into the slit and will result in little
flux falling on the detectors. As users have no way of knowing a-priori what
the roll angle of the spacecraft will be for their observation, and hence do
not know how a slight mispointing in RA and Dec will translate into an offset
in the y and z-directions, coordinates given must be accurate to less than 4''
in both RA and Dec.
20'' (or another object being
this distance away) cannot be rotated into the slit and will result in little
flux falling on the detectors. As users have no way of knowing a-priori what
the roll angle of the spacecraft will be for their observation, and hence do
not know how a slight mispointing in RA and Dec will translate into an offset
in the y and z-directions, coordinates given must be accurate to less than 4''
in both RA and Dec.
We can only urge users to examine all entered pointings to ensure no errors have been made when entering coordinates and to go to catalogues to get the latest coordinates.
If an observer does notice such effects in their data it may be possible at a later date to correct for them, by correcting the data based on the shape of the beam profile with position as given in the IIPH.