Data Reduction Recipe for an LWS01 AOT.
The case of a faint source.
Sergio Molinari
IPAC/Caltech
0. About this recipe...
What this recipe is:
-
A list of checks to be done and procedures to be followed during reduction
& analysis of your LWS01 observation.
-
A place to look for tips about how to deal with the aspects of the data
reduction which are critical for a faint source.
-
.....
What this recipe is not:
-
A tutorial about the use of ISAP
and LIA
-
An exhaustive description of ISAP and LIA functionality (refer to the tutorial
documents).
-
A detailed description of the ISAP and LIA Graphical User Interfaces
-
.....
This recipe is a worked example of real LWS data reduction and analysis;
it covers many of the peculiar instrumental effects that affect the quality
of your data, but certainly not all. In these cases we encourage you to
check the LWS and LIA FAQs; should your
question remain unanswered, please contact us at iso@ipac.caltech.edu
if in the U.S, or helpdesk@iso.vilspa.esa.es
if in Europe.
Recent changes: Sects 3.2 and
3.4.
1. Definitions & Requirements
-
A faint source, for the purpose of this document, has a flux lower than
100 Jy at all wavelengths in the LWS range. Certain steep-spectrum sources
will fall into this category only for a limited portion of their spectrum;
this document is valid for that portion of the spectrum only.
-
This recipe assumes you have a basic knowledge of the LWS instrument and
its main sub-systems: detectors, grating, illuminators.
-
This recipe assumes you are already familiar with ISAP's and LIA's GUIs,
as well as with the main functionality available in those packages.
-
This recipe assumes the following packages are available to you:
-
ISAP Version 1.6 or later. An earlier ISAP version does not have all the
functionality needed to follow all the steps and procedures described in
this recipe
-
LIA Version 7.2 or later
-
This recipe assumes the following files pertaining to your ISO LWS observation
are available to you, and have been obtained with Version 7 of the ESA
automatic data reduction pipeline (OLP):
-
LSPD - Raw science data at an intermediate level of reduction; this will
be the starting point for our data reduction
-
LIPD - Calibration data obtained towards internal
calibration sources during your observation
-
LIAC - File holding the Dark
Current estimates performed by the ESA automatic data reduction pipeline
(OLP)
-
LGIF - File holding the absolute responsivity
correction factors estimated by the ESA automatic data reduction pipeline
(OLP)
-
LSAN - Calibrated science data produced by the ESA automatic data reduction
pipeline (OLP)
-
(IIPH - Pointing history file, contains information about the instantaneous
pointing of the satellite during your observation)
2. Inspecting your Data
A preliminary inspection of your data is useful to get a feeling of what
you have in your hands, and to spot potential problems you will have to
take care of during the data reduction. Let's start by entering ISAP:
-
Change directory where the files containing the data of your observations
are stored
-
Enter ISAP by typing the command isap
at the prompt
-
Load the LSAN file into ISAP
-
Select all Scans, Detectors, and the two scan directions, and plot the
data. Likely, you will see something like this:
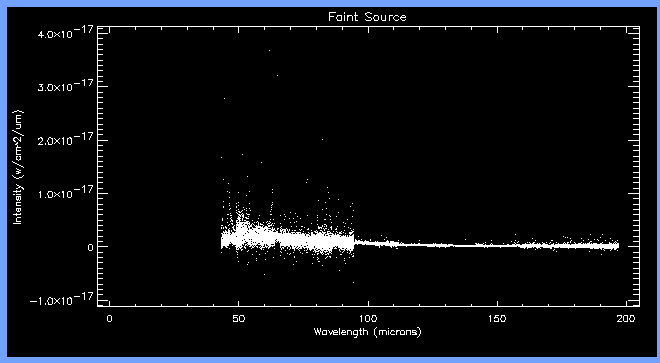 Fig.
1
Fig.
1
This is your calibrated spectrum; not very informative at this stage,
but we can note that the noise of the spectrum is higher in the region
with lambda < 93um, corresponding to the SW detectors. There is nothing
wrong with this observation; infact, this is common for the LWS and
it is due to the combined effect of higher NEPs and narrower spectral
element size for the SW detectors. Let's make a couple of checks for memory
effects and detector intercalibration:
-
Memory effects. There are two different types of memory effects:
-
Effects caused by energetic particles hitting the detectors. This event
causes an abrupt modification of the detector responsivity resulting in
a jump of the signal output of the detector ('glitch') followed by a more
or less slow recovery to normal behaviour. The recovery time is unpredictable;
we have seen cases of almost instantaneous recovery, and cases where the
detector took hours to go back to normal behaviour. Here is an example
where 2 'glitches' follow one another during a grating scan (here the grating
is scanning towards lower wavelengths):
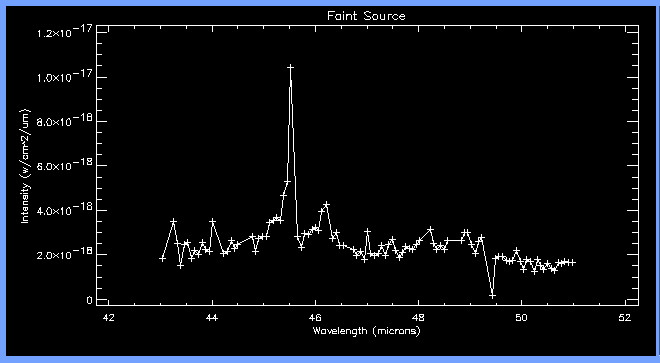 Fig.2
Fig.2
We tried to model, among other things, the recovery time as a function
of the signal jump, but without success; the first three points of each
jump have actually been discarded by the 'deglitching' algorithm present
in the first stage (ERD ===> SPD) of the automatic data reduction pipeline
and they do not appear in Fig. 2. The only possibility
is then to zap the crap; later, in ISAP, we will have to discard the trailing
edge of each glitch.
-
Effects
caused by the average amount of flux falling onto the detector (see the
recipe for the data reduction of a medium intensity source for more details
at http://www.ipac.caltech.edu/iso/lws/lia/lws01_medium.html).
There is a certain flux range for each detector (e.g. between 300 and 1000
Jy for detector LW2) where the response time of the detectors is a strong
function of the temporal gradient of the signal; in other words the observed
spectrum will be different for the two grating scan directions. As anticipated,
this effect mostly manifests itself in well defined flux range for each
detector; in case of a faint source we do not expect it. To check
if this effect is present we have to average the data; for this particular
purpose we can use the default averaging options and use Special
Clip & Mean as the averaging method. When you are back in
the main ISAP widget, change the Plot Style to Line
Style: Connected and Colour Coding
Preference: Scan Direction and plot. You should see something
like this:
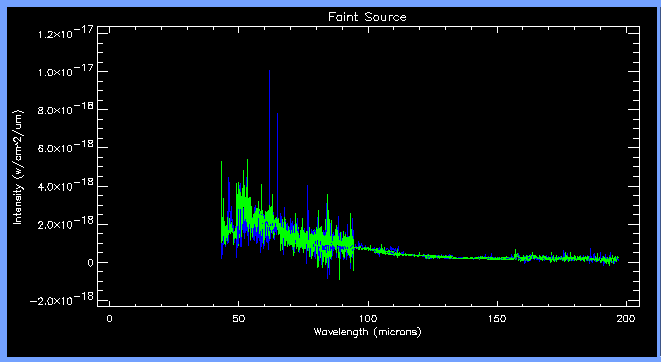 Fig. 3
The green and the blue lines represent the two scan directions; you
can zoom and closely inspect different portions of your spectrum. For faint
sources you should not see any systematic differences among the green and
blue lines (for the same detectors); if you instead see a significative
difference (well above the noise of the green and blue lines) consider
that the effect has not been modelled, so that it is not possible to correct
for it. In case a line is present it is strongly advisable to keep the
two scan directions separate and estimate the line parameters separately;
the two line fluxes can be averaged later, but the two determinations will
give you the best estimate of the uncertainty to assign to the average
line flux. This problem will be analysed in more detail when we will discuss
the data reduction of a medium-flux source (http://www.ipac.caltech.edu/iso/lws/lia/lws01_medium.html).
-
Detector Intercalibration. Now change the plot style to Colour
Coding Preference: Detector number and plot; you will now see something
like this:
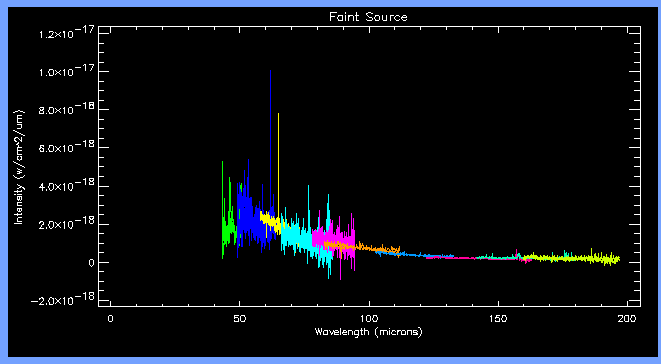 Fig.
4
Fig.
4
In principle, the spectra of the 10 detectors should line up nicely;
the overlapping portions of the spectra should match both in shape and
in absolute value, but this generally does not happens. What are the possible
reasons for a mismatch ?
-
Incorrect Dark Current subtraction.
-
Incorrect estimate of the Absolute Responsivity Correction factors.
-
The
LWS flux calibration (both absolute and relative) is based on a point-like
source (a planet). If the source is extended, we may expect detector mismatches
depending on the extension as a function of wavelength (e.g., the source
may be more extended at short wavelengths than at long wavelengths). A
tool to apply a correction for the source extension (assuming extension
larger than the beam and uniform brightness distribution) will be available
in ISAP Version 2.0.
Now you should quantify a bit this mismatch. Generally speaking
you might be happy with a 10-15% mismatch, but this of course depends on
the source. If the source is pointlike, you should expect less mismatch
because (see
above) the primary calibrator for the LWS is also pointlike and the
beam is stable at all wavelengths. If your source is extended or there
another source close enough (<80" for a 300 Jy source) to induce
fringing on your spectrum, then the situation is more critical because
the LWS beam is modulated and its FWHM may vary of about +/- 10% within
each detector band (the amplitude of the effect increases with wavelength).
Examine your spectrum and take notes about which detectors are more critical
in the aspects we have just discussed.
-
Negative Fluxes. There is another aspect you should note, which
is not present in the observation we are using as an example. When the
source is faint the calibrated fluxes can be negative, generally due to
an oversubtraction of dark current. Note that we are speaking of systematically
lower fluxes; a noisy spectrum of a faint source will certainly have negative
points. Note down all detectors with systematically negative fluxes, as
you will pay closer attention at them when you will revise the dark currents
(below).
3. Reprocessing your
Data with LIA
Let's start this Section with a recommendation: it is always advisable
to have a go with LIA, also if the preliminary analysis with ISAP did not
show any particular problem. It is good to have a look at the dark
current and at the raw data to check that everything is all right; a trend
of decreasing dark current, e.g., may reflect in an increased scatter of
your grating scans (i.e. an increased noise of your averaged spectrum).
Besides, the comparison of your data with the Dark Currents will tell you
if you are detecting signal or you just reached the sensitivity limit of
the instrument.
There are 4 steps in the LIA reprocessing of an LWS01 AOT:
3.1 Dark Currents
The tool to be used is IA_DARK. A full tutorial describing its functionality
is accessible at http://www.ipac.caltech.edu/iso/lws/lia/dark.html;
in the following, it is assumed that you are familiar with that document
(or at least have it at hand).
While at the ISAP> prompt, type:
IA_DARK,
tdt='TDT', where TDT is the eight digit number attached to the filename
of all you data files. If you are running ISAP in a directory which is
different from the one where your data files are stored, an additional
parameter has to be given; the call would then be: IA_DARK,tdt='TDT',dir='your
directory'. Once the widget is up, click on detector SW1. You will
see this:
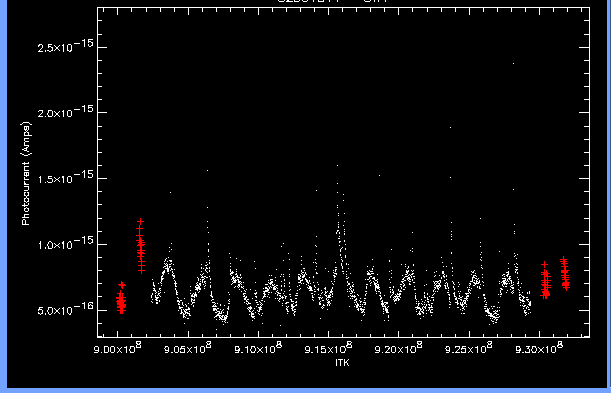 Fig.
5
Fig.
5
The red crosses are the DC measurements, while the white points are
your (uncalibrated) data; everything is plotted as a function of time.
If your observations was taken at a revolution number earlier than about
400 you may see DC measurements (red crosses) taken in between the observation;
however only the first and the last (before and after your observation)
DC measurements can actually be used.
Here the various scans of the grating can be recognized as an oscillating
pattern on your data. Remember that this data is still uncalibrated at
this stage and the transmission
profiles (called RSRF, 1 per detector) of the instrument are still
to be divided out. To check where the different scans start and end, go
with the mouse on a point and click the middle button of the mouse: the
text area at the bottom of the IA_DARK widget will give you all the information
regarding the nearest point to the mouse actual position. Again,
it is important to remember that at this stage the instrumental transmission
is not yet divided out and, if there is sufficient flux from your source,
it will manifest itself as a periodic pattern throughout your dataset;
it is not anything you want to model and subtract
as a DC or Gain trend. For a moment you think that all the spikes that
you see on your data are lines, but your illusion only lasts few tenths
of seconds. Zoom wherever you want on the above plot (on your LIA widget,
of course) and you will find out that most of them are 'glitches' resulting
from the detector being hit by an energetic particle, each followed by
its decaying trend marking the recovery to normal conditions. Most of the
glitches are located on the trailing edge of a previous glitch, so you
may wonder what 'normal condition' means for this detector. Let's make
a note that we will have to do a lot of zapping later in ISAP. The important
thing to notice here is that glitches are present also during the dark
current measurements; if you bring up the first DC measurement you will
see this:
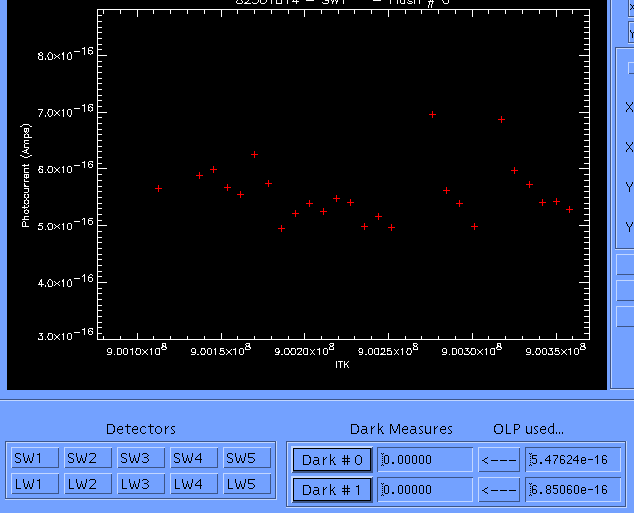 Fig.
6
Fig.
6
You will note the couple of glitch trails at the end of the measurement.
The median-clipped averaged performed on the whole set of points above
gives the DC estimated made by the OLP, which is visible in the box 'OLP
Used...' for 'Dark 0' in Fig. 6; it is clear however
that this is an overestimate because the second part of the measurement
is clearly corrupted. Also the first group of 7 points in the plot above
looks like a recovery from a glitch happened prior to the start of the
observation. It seems that the best estimate we can do of the dark current
should be based on the central group of point in Fig.
6. Now go ahead and make your DC estimate also for the second DC measurement.
When you come to the subtraction of your estimated DCs from the data,
a lot of common sense is needed. Take the example in Fig.
7.
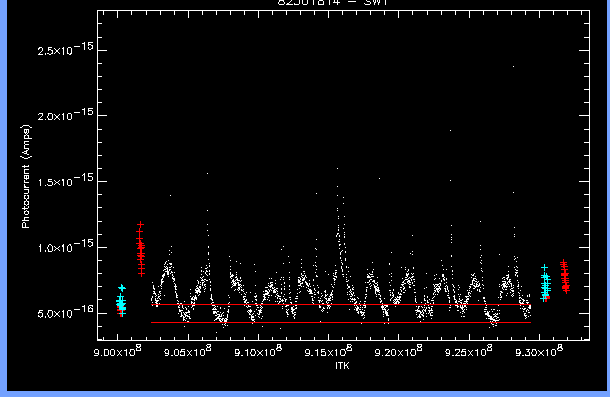 Fig.
7
Fig.
7
The only thing you want to try here is to remove trend in DC during
your observations, and so you may want to try and interpolate following
the lower envelope of your data.
If you have a Raster Map
you will be in the uncomfortable situation to have a signal variation during
the observation. In a single pointing observation, you are sure that the
intrinsic signal from the source is not varying so that you can assign
trends either to DC or Gain variations (and remove them). In a raster,
unless you have an extended uniform brightness source, the intrinsic signal
is varying; it is practically impossible to spot a trend in the instrument
behaviour in this conditions.
You should by now be convinced that the variability you see in the signal
(white points) in Fig. 7 is just the relative spectral
response function of the detector which has not yet been divided out; do
not try to model this stuff, as it will disappear when we will recalibrate
our spectrum later. The best (and most conservative) thing you want to
do at this stage is to assume that the DC is constant through out the observations.
In general, if the DC measurements done before and after the observation
are comparable, within the noise of the single measurements, we recommend
you choose the linear interpolation option which uses the average of the
two measurements. This is the option applied by the OLP, and unless the
two measurements are significantly different ot there is a clear DC trend
in your data, you should stick with that option. The case shown in Fig.
7 is very interesting because it represents an exception to this rule.
Assuming a constant DC equal to the average of the two DC measurements
and interpolating this value throughout the observation, we obtain the
upper full line in the above figure. Now it is clear that there is something
wrong with this, because after the DC subtraction more than 1/3 of the
data points would be negative. The fact itself that we see the spectral
profile of the detector during the grating scans is reassuring that some
flux above the DC level must be falling on the detector; the true DC value
must then be lower than suggested by the DC estimates we made above (see
Fig.
6). We are therefore in the unpleasant situation where we do not
have a reliable independent estimate of the DC; we can only guess that,
based on the considerations above (in italic), the DC must be less or equal
to the minimum value of the data (white points); it cannot be higher than
that because, again, the transmission profile of the detector is clearly
seen and this imply that the detector is seeing flux from the source.
Tip: force a value of DC similar to the minimum value
(on average) reached by your data, by typing this value in the two Dark
Measures boxes visible in Fig. 6 and hit return; then interpolate
the DC assuming it constant and equal to this value.
Write down that you gave your best guess for the DC of this detector,
since a further adjustment might be needed when you will look at your recalibrated
spectrum.
Another peculiar situation we find in the current example is found for
detector LW4:
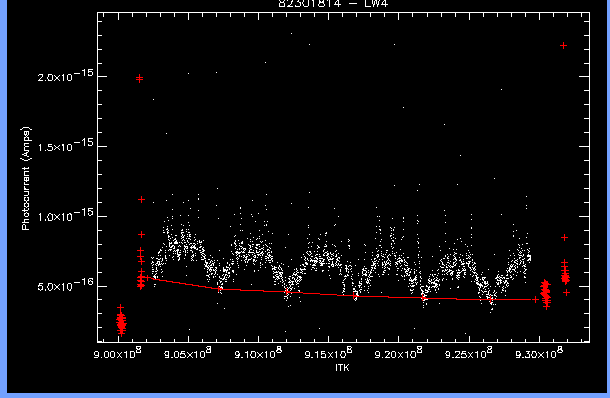 Fig.
8
Fig.
8
Apart from the periodic pattern due to the transmission profiles, we
do see a decreasing temporal trend/drift in the data. Is this a DC or a
responsivity trend ? It is a tough question and you might not always be
in the condition to answer. In this case, however, we have a way out.
Tip: check the peak-to-peak amplitude of each
RSRF
pattern. Is this decreasing with time ? If YES, this is likely to be a
responsivity (gain) trend; if NO, this will be a DC trend.
-
Responsivity trend. Do nothing at this stage; here we can only correct
for DC trends. You will be able to correct for gain trends in IA_DRIFT
-
DC trend. Add Points throughout your data and Interpolate Linear using
All darks (see Fig. 8).
As for the previous discussion about detector SW1, you are guessing DCs
here; write on your Log that you
guessed DCs for this detector (LW4 in this particular case) to remind that
you are authorized to make further adjustments later (we will discuss this
later).
Keep in mind the considerations we have been doing so far, while proceeding
with the DC estimate and subtraction for the rest of the detectors.
3.2 Responsivity Drifts
With the possibility of `shifting spectral scans' which will be available
with ISAP version 2.0, the routine IA_DRIFT, used to correct for temporal
responsivity drifts, is likely to become obsolete. This routine was needed
because the pipeline incorrectly estimate the responsivity drift before
subtracting the DC; it will be much easier and less time consuming to do
this with the new ISAP functionality.
The only plausible reason to still use IA_DRIFT is when there is evidence
for a non-linear responsivity drift: please refer to the tutorial available
at http://www.ipac.caltech.edu/iso/lws/lia/drift.html.
We have just one special recommendation for you, when you are dealing
with faint sources. Be careful that the drift you will fit to your data
does not cross 0. If this happens, a portion of your data will be divided
by very small numbers and the calibrated spectrum will contain points with
enormous flux values (both positive and negative). When the source is faint,
put a lot of care in selecting the highest signal portions of your grating
scans to estimate the responsivity drift. When fitting trends in an observation
which is a raster map, remember what we said above.
Please note that this problem will affect OLP Version 8 data.
3.3 Absolute
Responsivity Correction Factors
The absolute responsivity correction factors
can revised using the routine IA_ABSCORR, whose tutorial is available at
http://www.ipac.caltech.edu/iso/lws/lia/abs_corr.html.
Since the estimate of these factors is based on the Illuminator Flash data,
the characteristics of the source observed are not important; the tutorial
has all the information you need to proceed.
3.4 Recalibration
The recalibration of your data is independent on the type of source observed,
and it is performed by the routine SHORT_AAL: instructions are found in
http://www.ipac.caltech.edu/iso/lws/lia/lia.html#SHORT_AAL.
If you did not use IA_DRIFT to remove the relative responsivity drifts,
remember to run SHORT_ALL with the `/nodrift` option.
4. Data Analysis with ISAP
At this time, you should have in your directory a file called LSANxxxxxxxx_SHORT.FITS
produced by SHORT_AAL; load this file into ISAP. You can do a straight
average and compare the result with the averaged spectrum for the original
LSAN file produced by the OLP. Once you are done, we can start with the
real work to analyse this data.
-
Zap the crap. We have to manually edit the data for each detector
separately to identify and discard the clear outliers resulting from glitches.
If you have a large enough data set (i.e. more than 10 scans) you might
want to split apart your AAR according top the detector number. Infact
after each zapping ISAP has to reload all the structure and it may take
few seconds to do it; if you multiply these 10 seconds by the number of
zappings that you will have to do this will result in an unacceptable overhead.
If you find out that this is the case, it is better to SPLIT you AAR and
work on smaller datasets. If in the preliminary analysis you identified
detectors which showed memory
effects, it is better to work on each scan direction separately. Be
careful to only zap clear outliers; in the example below we can clearly
recognize few glitch trails (the orange, green, magenta and blue scans):
zap them out. Also zap the bunch of outliers at the right hand of the spectrum.
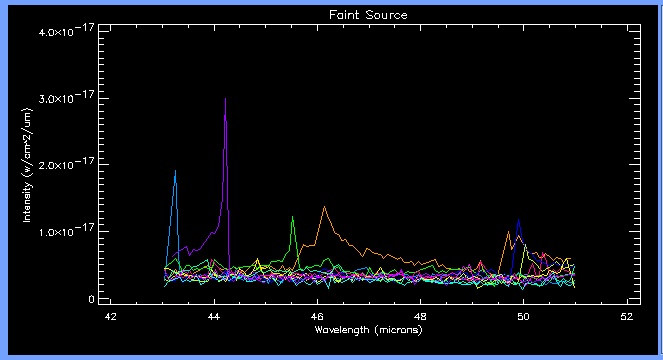 Fig.
9
Fig.
9
Do not start zapping in the noise; you should only zap what's really
systematic otherwise you will modify the statistics of the measurement
and the averaged spectrum will be perturbed.
Do this zapping for all detectors; remember to STORE the AAR after
finishing zapping each detector. If you SPLITted apart your AAR, it
time now to merge all the pieces back into a single AAR.
-
Average. Select all the data and send it to Average.
The default settings can be used to give it a try; if you already know
that there are no memory effects in your data, e.g. no systematic difference
between scan directions for the same detector, de-select the Scan
Direction check box at the top left corner of the Average
widget. If you have memory effects is better to average scans for each
scan direction separately (i.e., leave the default selection for the check
boxes at the top left of the widget); memory effects, if any, are not in
general present in all detectors so the easiest thing is to do two averages
with the two options.
Here are some guidelines for averaging. If you have a limited number
of scans you may want to increase the bin size to gain a bit in S/N at
the expense of the spectral resolution. Consider that unless you are observing,
e.g., a supernova remnant where the line can be broader than 1500 km/s,
your line will be unresolved and there is nothing band in increasing a
bit the bin size to push down a bit the noise. Play also a bit with the
sigma
clipping threshold; a too high value will not discard enough outliers,
while a too low value will start discarding too many points; there should
be an optimum value which minimizes the noise level of the averaged spectrum.
We cannot give more precise guidelines here because this is a function
of the data. Also, the bin size and sigma values which give good results
for one detector may be not optimized for another detector; if this is
the case you can always send separate detectors to Average
and merge the results back into a single AAR later (remember to STORE
each averaged piece before you go to the next). The averaging algorithm
is another parameter you can play with; the Mean
and Median methods do not clip
outliers and are not recommended. The Standard
Clip & Mean does one single pass to discard outliers, while
the Special Clip & Mean is
more drastic and does iterative passes until there is nothing more to discard.
Essentially play with the bin size, sigma and the averaging method until
you are happy with your result; the precise combination of these three
parameters will be a function of your data.
As is the case in general for faint sources, memory effects were not
present in the observation we are using as an example in this cookbook.
The averaged spectrum, coloured by detector number, will be something like
this:
 Fig.
10
Fig.
10
This should be compared with Fig. 4 (plotted on
the same Y scale). We see that we have done a good job especially on detector
SW1 (the first on the left), which is now aligned with SW2. The situation
got a little bit worse for LW4; can we do something about it ? Sure ! You
know that for LW4 you did your best guess with the absolute DC values (There
are no doubts for the removal of the decreasing trend that was present
for the DCs - see above); well, this guess was probably not correct and
we have a way to correct for this in ISAP. In the example above, I will
plot the last three detectors only, to see in detail how LW4 compares with
the adjacent LW3 and LW5. This is a blow-up of the situation:
 Fig.
11
Fig.
11
We select the three detectors and we choose the option to Shift
them; use indifferently LW3 or LW5 as the Good
Detector, and
choose the LWS Dark Correction
shifting method. This method puts back the detector transmission profiles
onto your spectra, applies the proper offset to the detector that must
be shifted, and divides the result by the transmission profiles. The result
is shown in Fig. 12
 Fig.
12
Fig.
12
The result is very good and this is confirmed by the fact that the height
of the [CII] line is the same in both detectors. Had we Shifted LW4 with
any of the other two methods the line would have looked different in the
two detectors, casting severe doubts on the procedure. A couple of question
may arise:
Q. "Why should I lose my time with the detailed
inspection of DCs done before in LIA, if I can always adjust the spectra
in this way in ISAP ?"
A. We could apply this method of shifting LW4
with the Dark LWS Correction option, because we carefully checked the DCs
in LIA. You will remember that LW4 was a detector for which the DCs were
given as a best guess (see
above), so we were authorized to make this correction afterwards. If
you do not do the IA_DARK step, who is going to tell you if a mismatch
is due to a DC problem or a responsivity (gain) problem ?
Q. "In the previous case I might have tried all
three Shifting methods and accept that for which the line height in the
two detectors comes out to be the same; why bothering with all the rest
?"
A. In principle is true; but what's going to happen
when there is no line to help you in the overlapping region between two
adjacent detectors ?
In essence:
-
You have to do your LIA homework before attempting any kind of detector
shifting in ISAP.
-
Try to shift detectors only if you are sure about where the mismatch
is coming from. If the DCs and the gain are looking good, then you
do not not the cause of the mismatch and you should not try to shift anything
to avoid erroneous interpretations of your data based on an adventurous
shifting.
-
Defringe. The particular data set we are using in this cookbook
does not have fringing problems, meaning that the source is not extended
and there are not other sources off-axis. If your spectrum is fringed,
than you should defringe it before any kind of detector shift is even attempted.
Although logically incorrect, we preferred to discuss shifting before defringing
as a part of the comparison between the LIA processed and the OLP processed
spectra. Defringe only detectors for which you see fringes. Do not defringe
because you are not sure if there is a fringe or not and "it makes no harm
anyway"; it can make harm, if you do things blindly.
-
Extended Source Correction. A new functionality is available under
ISAP v2.0 and later: the possibility to apply a correction to your spectrum
to make the LWS calibration valid for extended sources. This is needed
because the calibration files used to reduce your data were derived using
a point-like source. By comparing the amount of source flux which is clipped
by the focal plane aperture in the two extreme cases of point-like and
infinitely extended and uniform source, the instrument team could determine
a set of correction factors which, after interpolating, can be applied
to your data. This is a gain correction which can reduce your LWS fluxes
by as much as 40%. This correction should be applied for extended sources
only.
Q. "This is all very nice. But my source is not
infinitely extended and it not uniformly bright!! What should I do ?"
A. This is of course a most tricky and common
situation, but unfortunately there is no definite indication; the truth
will be in the middle. However, from tests done on real cases (extended
galaxies, hence non uniform) it seems that the correction works well for
sources more extended than 3-4 arcmin.
-
And now ....? Now the fun starts!!