
2MASS point sources
2MASS extended sources
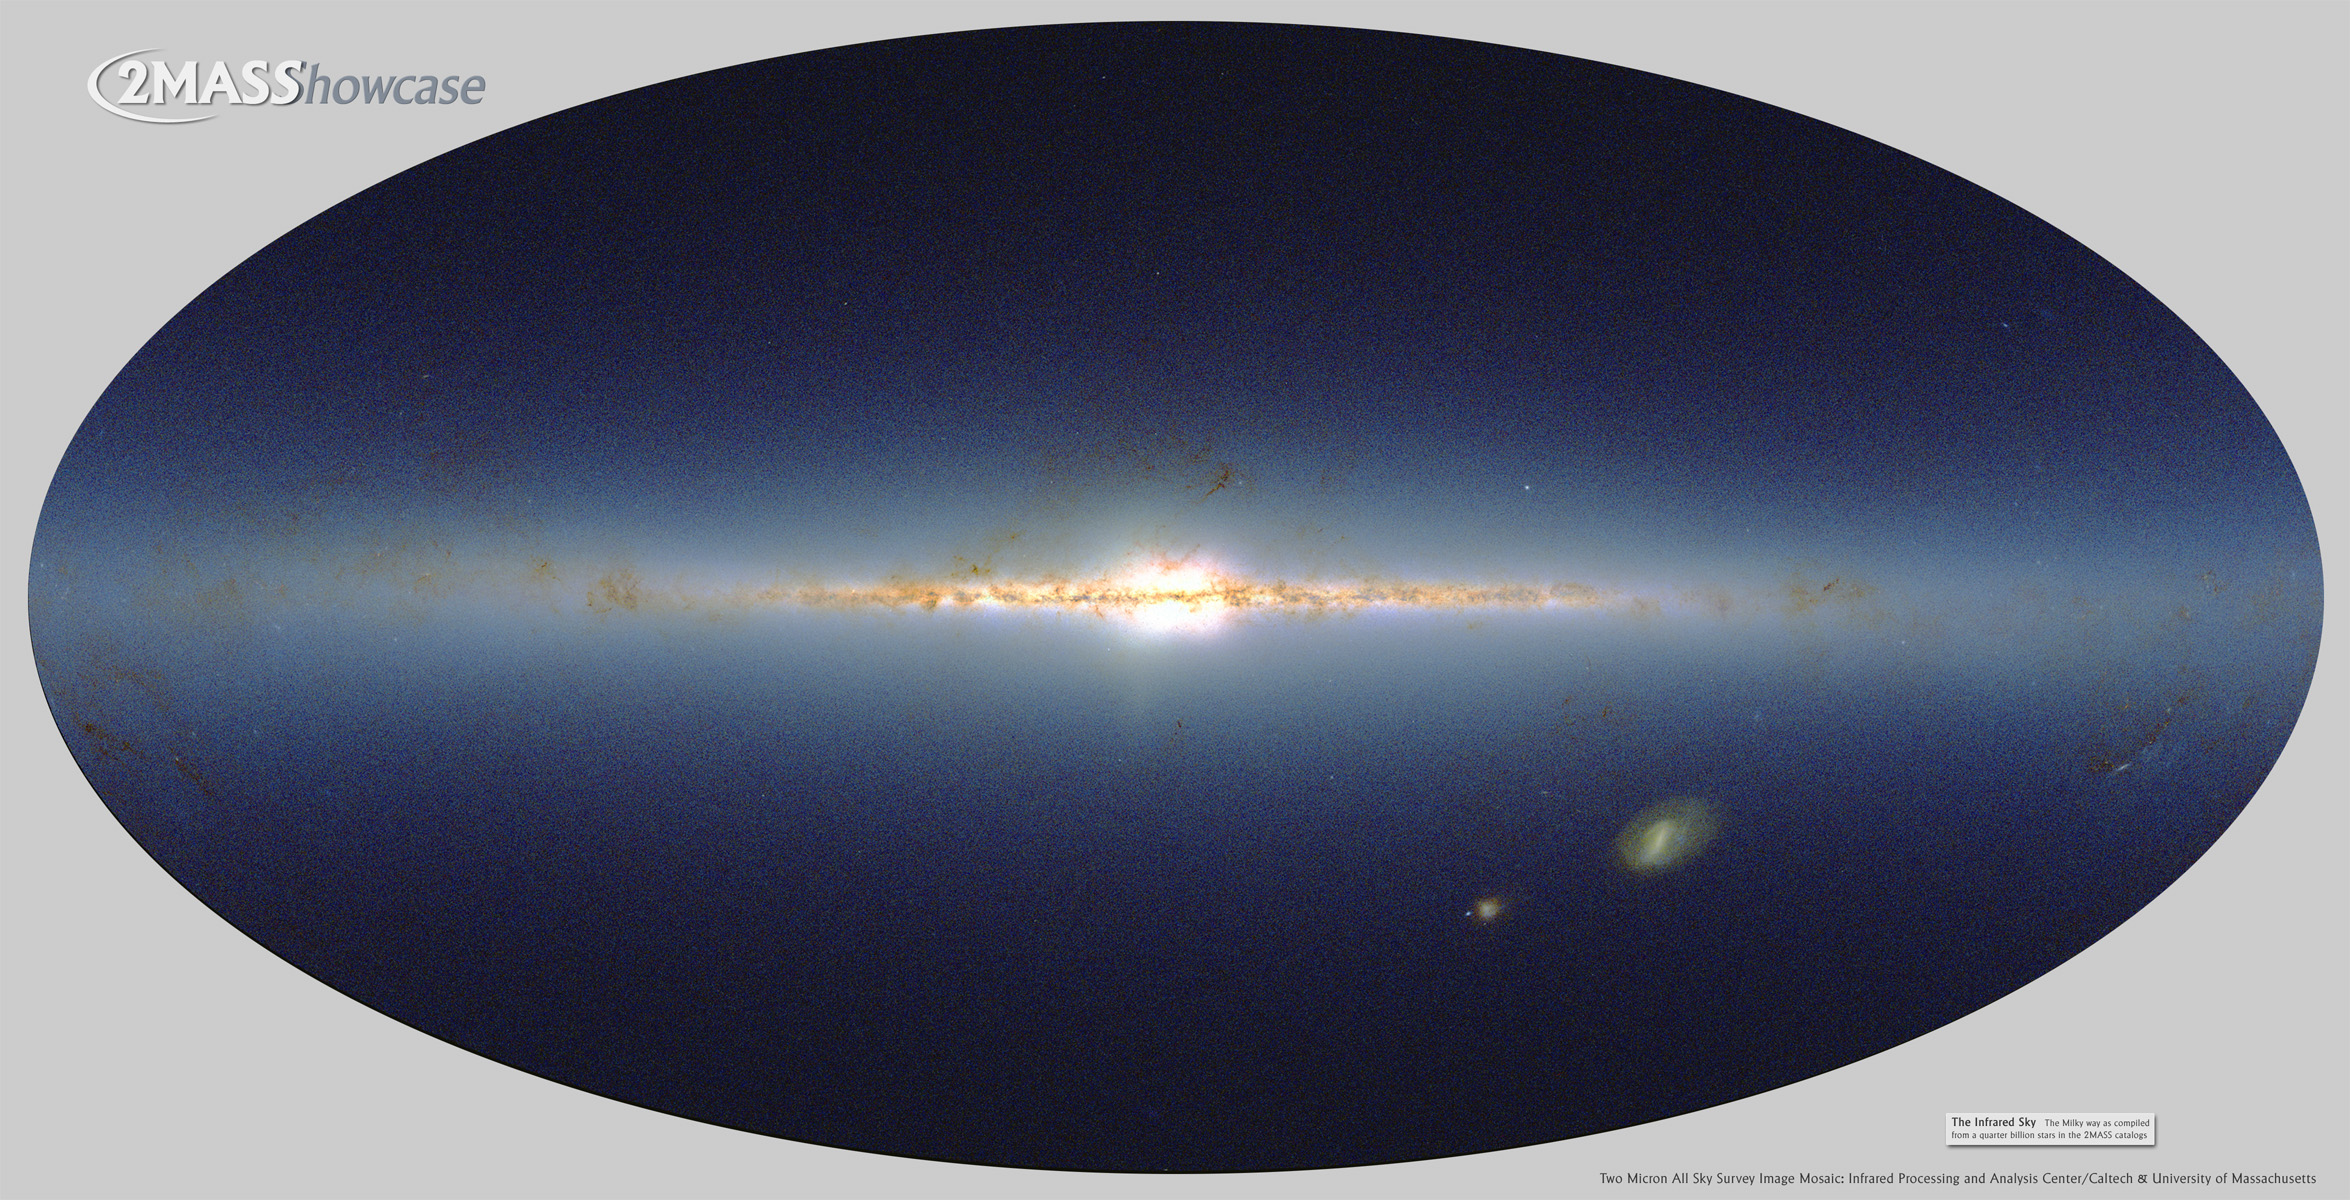
The 2MASS observing system, consisting of two nearly identical telescopes (Section III.1a) and cameras (Section III.1b), and a single data processing pipeline (Section IV.1) has revealed the near-IR sky with remarkable uniformity and accuracy. Images derived from counts of objects in the point source and extended source databases show the dominance of stars in the galactic plane (point sources; Figure 1) and of more uniformly distributed galaxies (extended sources; Figure 2).
|
|
|
| Figure 1 2MASS point sources |
Figure 2 2MASS extended sources |
| Figure 1 (point sources) is presented in Galactic coordinates with l=0 in the center of the Aitoff projection. Figure 2 (extended sources) is presented in equatorial coordinates such that the galactic anticenter lies nearest the center of the image. |
Practical issues of airglow, seeing, and telescope background produced instantaneous variations in sensitivity during the survey (Figure 3). However, by selecting magnitude limits (approximately J=16.0, H=15.0, Ks=14.5) where source detection is complete even under the conditions of the poorest acceptable sensitivity for the survey, the user is able to achieve a uniform view of the sky (Figure 4). There are, however, many sources present in the catalog that are ~1 magnitude fainter than the level at which uniform coverage was achieved. Some large contiguous regions of the sky will have completeness limits as much as 0.5 mag or more fainter than the full-sky uniformity magnitude thresholds. Alternatively, Figure 4 graphically illustrates that source confusion in the Galactic Plane, especially near the Galactic Center, reduced the effective survey sensitivity over several hundred square degrees.
 |
 |
| Figure 3 Point sources: 16.6 < j_m < 16.8 |
Figure 4 Point sources: 15.8 < j_m < 16.0 |
i. Stars
Stars dominate the 2MASS sky. The 2MASS All-sky point source release contains 470 million sources. About 5 million of the point sources are likely to be extragalactic objects -- mostly unresolved. The extended source all-sky release contains 1.6 million objects, most of which are galaxies. Thus, the vast majority of 2MASS point sources are Galactic stars. Figure 1 graphically demonstrates this concentration; 75% of the point sources lie less than 15o from the Galactic plane.
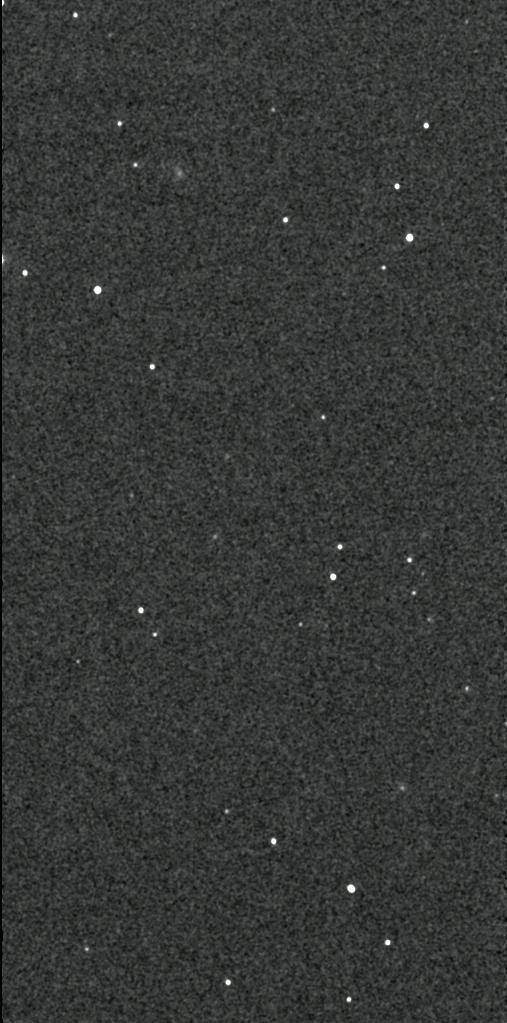
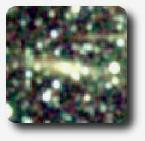
The images below illustrate the two extreme 2MASS environments -- the Galactic plane and the Galactic pole -- including color-color and color-magnitude diagrams for both environments.
| Galactic Pole ( l=34o, b=81o ) | Galactic Plane ( l=54o, b=2o ) |
 |
 |
| Figure 5 |
Figure 6 |
 |
 |
| Figure 9 |
Figure 10 |
Sources sparsely populate the 2MASS high galactic latitude sky. A typical 1024´´ × 512´´ Atlas Image (e.g., Figure 5) contains a few dozen stars and a galaxy or two. The dominance of Galactic stars at these latitudes is indicative of the depth of the Survey -- signal to noise ratio (SNR) = 10 is achieved at fainter than J=15.8 (0.7 mJy), H=15.1 (0.9 mJy), and Ks=14.3 (1.2 mJy). The 2MASS Point Source Catalog contains sources extracted with a signal to noise ratio greater than 7 in any one band or signal to noise ratio greater than 5 in any two bands.
For bright sources where the background noise is unimportant, source flux extraction uncertainties are of order 0.02-0.03 mag and positions are typically accurate to <0.1´´.
The source overlay (Figure 7) blinks
sources from both the Point Source Catalog (PSC; red) and Extended
Source Catalog (XSC; green) in the Atlas Image frame. As
the source overlay demonstrates, extended sources trigger point source
extractions and thus appear in the Point Source Catalog -- albeit with
large  2, indicative
of their deviation from a point
spread function profile. A few faint sources apparent to the eye do
not have PSC counterparts. The point source pipeline identified and
extracted many of these sources (as well as many noise-triggered
detections), but they lie below the signal to noise ratio cutoff for the
Release.
2, indicative
of their deviation from a point
spread function profile. A few faint sources apparent to the eye do
not have PSC counterparts. The point source pipeline identified and
extracted many of these sources (as well as many noise-triggered
detections), but they lie below the signal to noise ratio cutoff for the
Release.
Some of the unmarked sources may also result from the persistence afterimage induced in the arrays by bright stars observed in previous frames. Since the positional offset to these persistence artifacts are well established, they are flagged in processing and removed from the Release. Many of the unmarked sources in the low galactic latitude source overlay (Figure 8) are persistence artifacts from bright stars. A green cross identifies one such artifact.
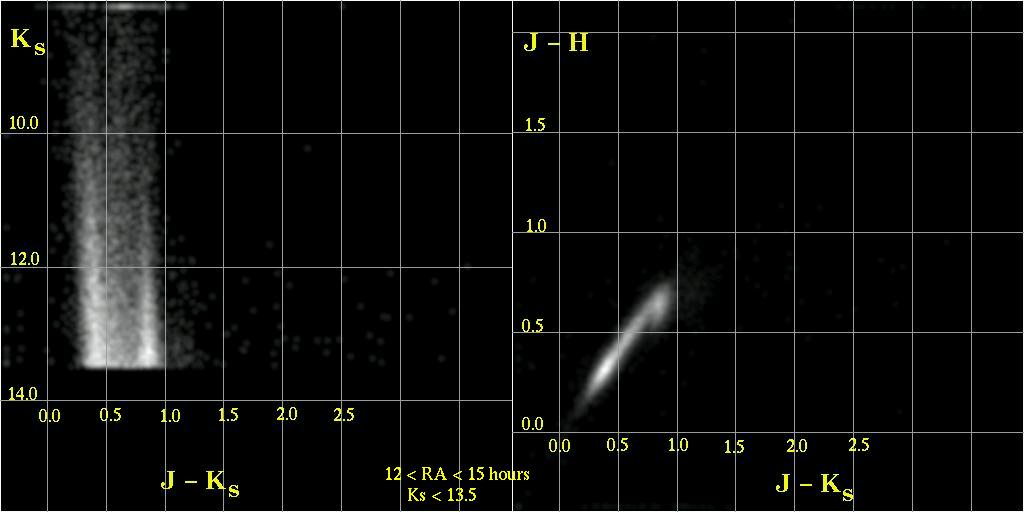
The J-H vs. J-Ks color-color and Ks vs. J-Ks color-magnitude diagrams (Figure 9) demonstrate the precision of the photometry and delineate two stellar populations -- disk dwarfs and halo giants -- which dominate at the Galactic pole. This diagram includes all high signal to noise ratio (Ks<13.5) sources in the Release Catalog between RA=12 hours and 15 hours. Figure 13 similarly shows diagrams constructed from all of the sources from the same region of sky in the Catalog. 2MASS reports magnitude in the 2MASS photometric system. 2MASS colors lie very close to those reported by Bessell & Brett (1988, PASP, 100, 1134; see Figure 11). The dark blue line is the locus of giant colors. Light blue represents dwarfs. Explicit color transformations (see VI.4b) between 2MASS and other popular photometric systems are available as part of this Explanatory Supplement.
|
| Figure 13 |
 90% of all 2MASS high-latitude sources have associations
in the USNO-A digitization of the original Palomar and ESO Sky
Surveys. The 2MASS Point Source Catalog entries include the USNO-A B-band and
R-band magnitudes and the 2MASS/USNO-A positional
difference (in the
case of entries with Tycho catalog associations,
the magnitudes included are in
the B and V bands and position offsets are relative to the
Tycho observations). Since 2MASS
and USNO-A are both characterized by high astrometric accuracy, the
positional differences carry proper motion information. The diagram at
right (Figure 14) shows position
differences between 2MASS and USNO-A in the
direction of the Pleiades star cluster (Adams et al., 2001,
Astron. J., 121, 2053). Pleiades members are apparent
by their clustered offset proper motion.
90% of all 2MASS high-latitude sources have associations
in the USNO-A digitization of the original Palomar and ESO Sky
Surveys. The 2MASS Point Source Catalog entries include the USNO-A B-band and
R-band magnitudes and the 2MASS/USNO-A positional
difference (in the
case of entries with Tycho catalog associations,
the magnitudes included are in
the B and V bands and position offsets are relative to the
Tycho observations). Since 2MASS
and USNO-A are both characterized by high astrometric accuracy, the
positional differences carry proper motion information. The diagram at
right (Figure 14) shows position
differences between 2MASS and USNO-A in the
direction of the Pleiades star cluster (Adams et al., 2001,
Astron. J., 121, 2053). Pleiades members are apparent
by their clustered offset proper motion.
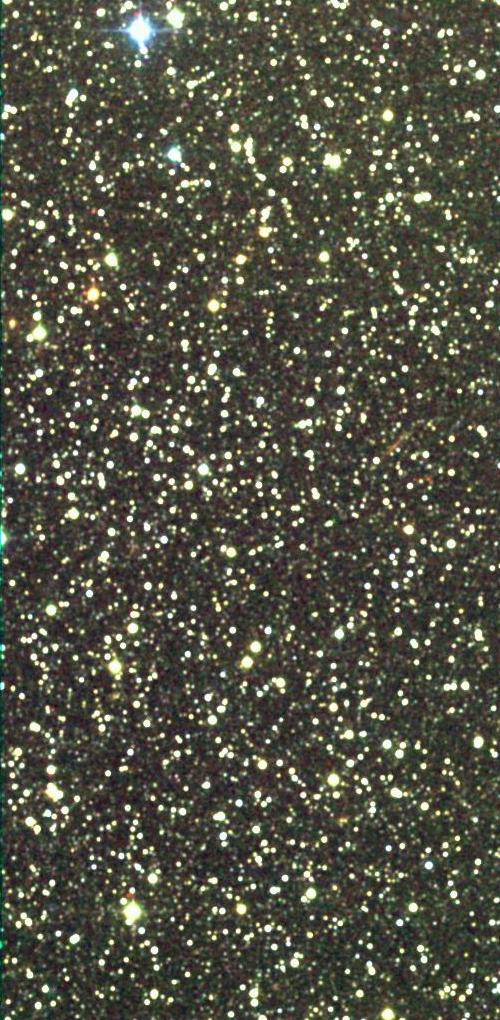
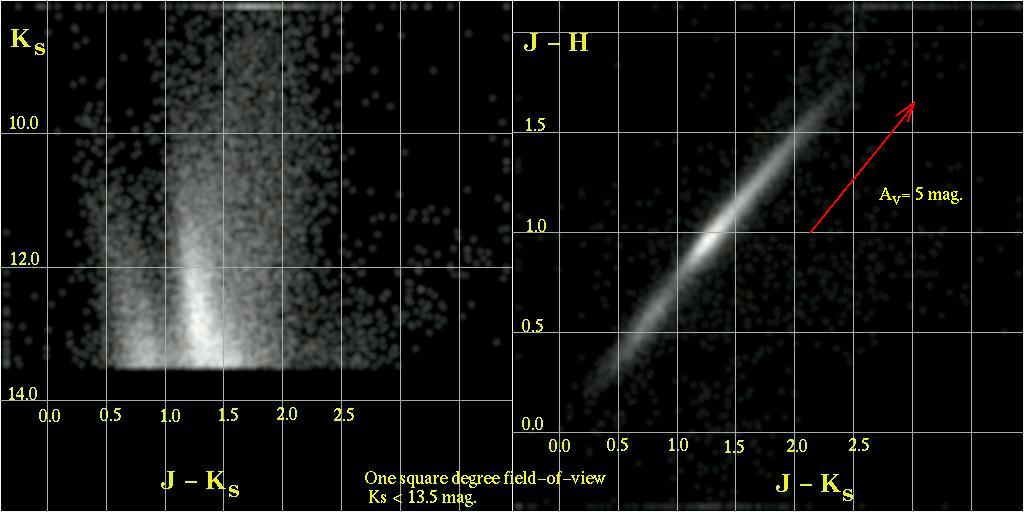
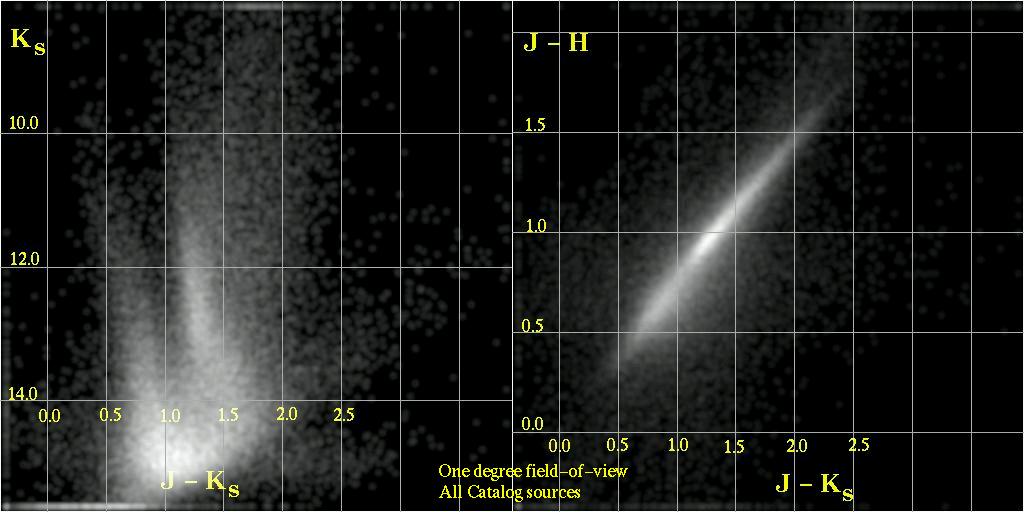
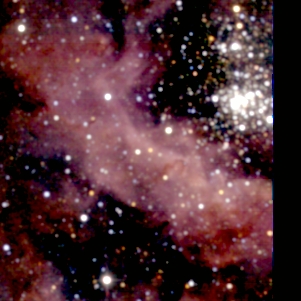
Interstellar reddening and source confusion dominate the appearance of the 2MASS sky deep within the galactic plane. The three-color Atlas Image (Figure 6) "visually" highlights reddened stars. The Galactic plane color-color and color-magnitude diagrams (Figure 10) quantify the effects of reddening. This color-color diagram was drawn from a one-square-degree region centered on the Atlas Image. In the absence of extinction the color-color diagram in this direction would resemble the high-latitude distribution (Figure 11). Reddening smears the low-latitude distribution to the upper right, relative to the main sequence and giant loci (Figure 12). The reddest sources in this square-degree region experience visual extinctions of between 5 and 10 magnitudes and would therefore be difficult to detect in visible wavelength surveys.
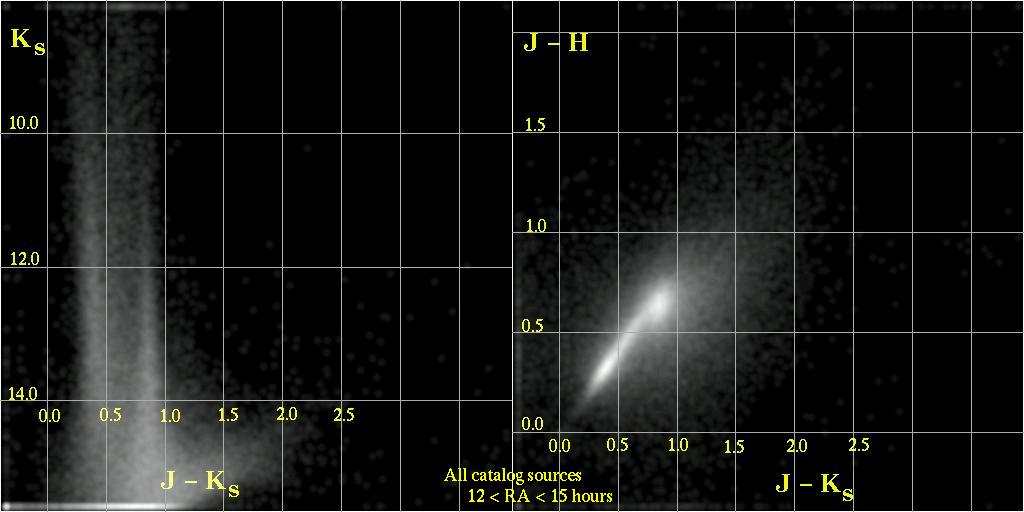
The compactness of the color-color distribution demonstrates that the source extraction software is robust for deriving photometry of brighter sources, even in this dense field. The color-color diagram resulting from the inclusion of all sources (Figure 15) in the Catalog still shows a similarly well-defined distribution. As source density increases, the source extraction flux threshold rises and thus tracks the confusion noise. The faint source extraction limit tracks the confusion noise and moves to higher flux levels in dense regions. Section VI.1 includes more details concerning the performance of 2MASS within the Galactic plane.
|
| Figure 15 |
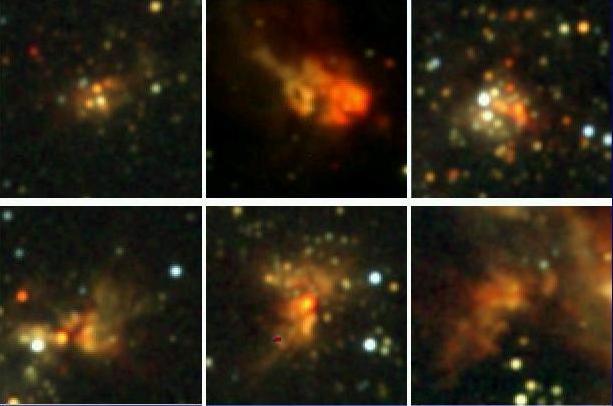 In addition to star counts and reddening profiles, the 2MASS Galactic
plane data contains many star-forming regions (seen at right in
Figure 16).
Because of nebulosity and source confusion,
the automated flux extractions from the 2MASS pipeline may
not represent the best quality photometry of these complex
regions. Many of these regions were detected as extended
sources by the pipeline and full-resolution images are available
via the extended source full resolution
image server.
In addition to star counts and reddening profiles, the 2MASS Galactic
plane data contains many star-forming regions (seen at right in
Figure 16).
Because of nebulosity and source confusion,
the automated flux extractions from the 2MASS pipeline may
not represent the best quality photometry of these complex
regions. Many of these regions were detected as extended
sources by the pipeline and full-resolution images are available
via the extended source full resolution
image server.
ii. Galaxies
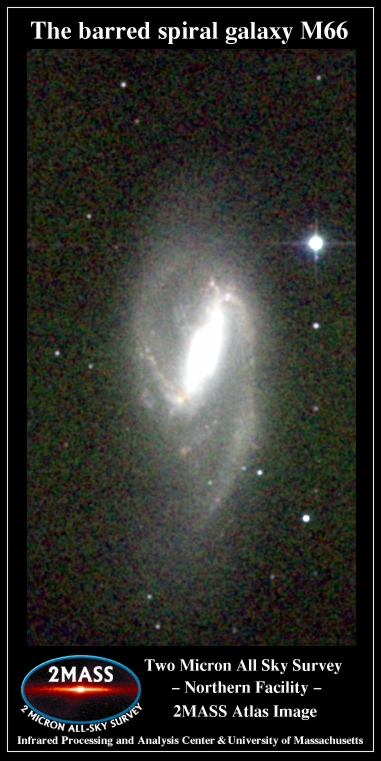
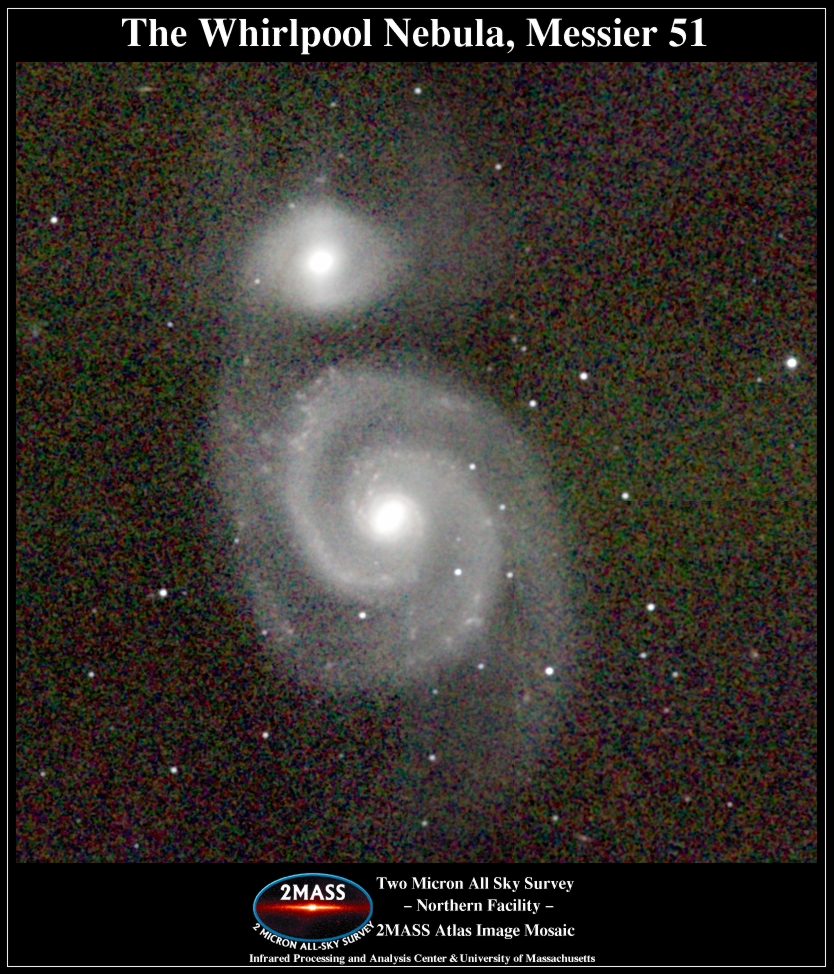
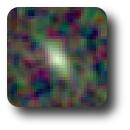
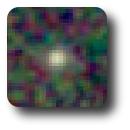
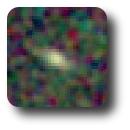
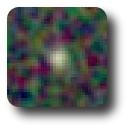
2MASS extracted 1.6 million extended objects. Owing to the transparency of interstellar dust within the galaxies and to the dominance of late-type stellar population in producing galactic near-infrared flux, the 2MASS galaxy images largely trace the overall stellar mass distribution in these galaxies. The top row of images below (Figures 17-20) include examples of 2MASS galaxies of large angular size. Although these images illustrate the smoothness of the light distribution arising from the dominance of late-type stars rather than early-type stars, they are unrepresentative of the typical 2MASS galaxy. The bottom row of images (Figures 21-25) is a more random sampling of 2MASS extended sources, which tend to be only marginally resolved from a point source.
 |
 |
 |
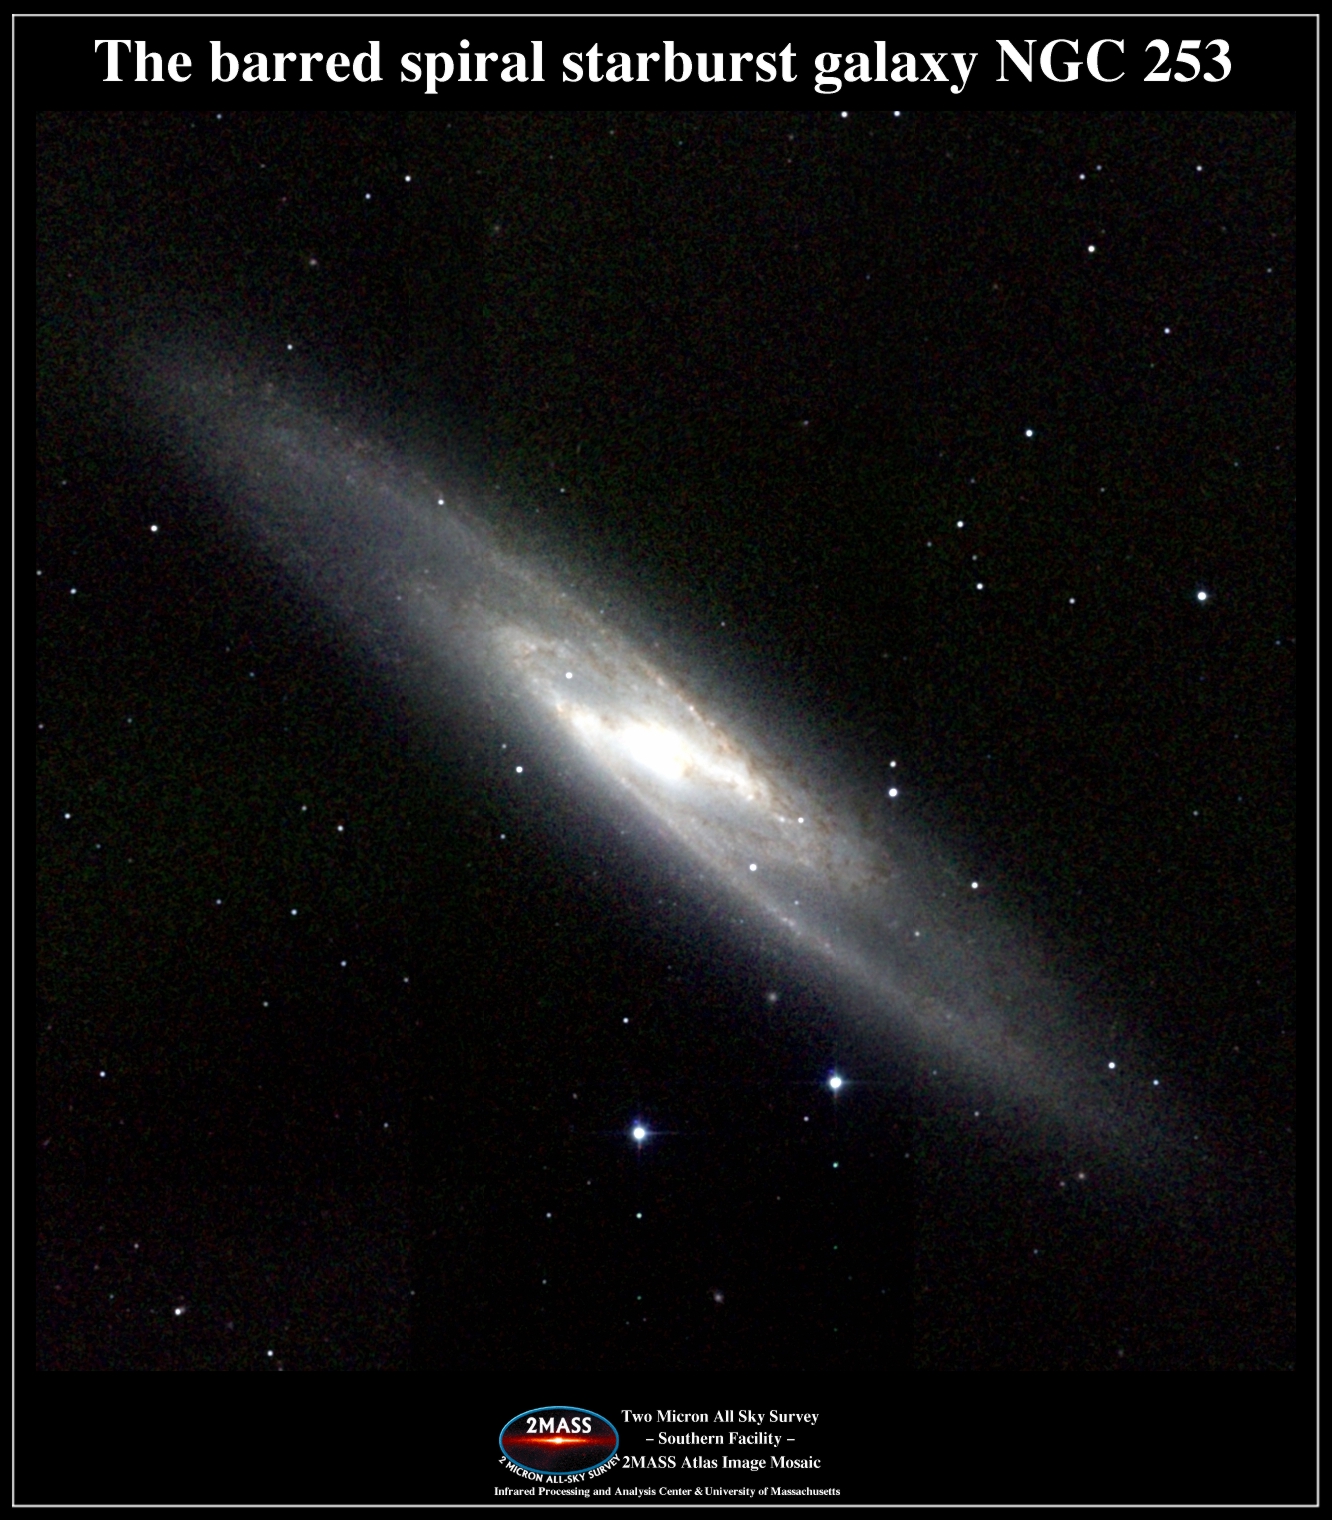 |
| Figure 17 | Figure 18 | Figure 19 | Figure 20 |
 |
 |
 |
 |
 |
| Figure 21 | Figure 22 | Figure 23 | Figure 24 | Figure 25 |
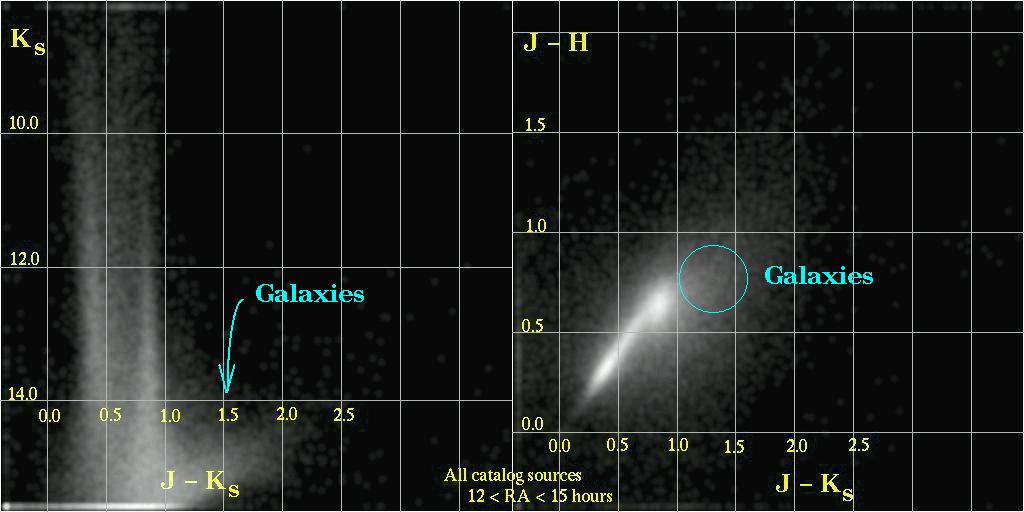
In addition to the galaxies present in the XSC which were significantly extended relative to the PSF, there is a population of galaxies present that are only in the PSC. These galaxies are either fainter or less extended than galaxies in the XSC. These galaxies can usually be discriminated from stars by their colors.
Galaxies have unique colors relative to stars in the 2MASS wavelength bands, owing to the effects of internal extinction and star formation. The k-correction due to cosmological redshift enhances this color separation from the locus of ordinary stars. A J-H vs. J-Ks color-color diagram (Figure 26) of faint point sources (the high-latitude diagram discussed above for the RA=12 hour to 15 hour range) shows the galaxies as a separate population. This color difference is enhanced by reddening in the Galactic plane, where the light from galaxies must traverse the entire extent of the Milky Way disk. The 2MASS Extended Source Catalog includes a "g"-flag (g_score), which includes color in an assessment of whether an extended source is likely to be a galaxy.
|
| Figure 26 |
The rest of this subsection discusses only the galaxies present in the XSC.
The J-H vs. H-Ks color-color diagram (Figure 27) for areas with low stellar source density shows the range of colors for 2MASS galaxies. The photometric precision of extended objects is, of course, much lower than for stars. A typical galaxy near the lower magnitude threshold has an uncertainty of about 10% in its photometric flux, which is 15% in its colors, and thus the observed scatter in colors is mostly due to that uncertainty in the faintest galaxies. Nonetheless, even amidst this uncertainty, the variation of color with redshift, the k-correction, is apparent in the elongation of the cloud of points along the expected trend. Brighter sources have correspondingly higher photometric precision. And because the uncertainty is almost entirely statistical, and not systematic, the mean color of groups of galaxies is fairly precise, and enables the extraction of relatively accurate photometric redshifts for dense clusters (see I.2a).
|
| Figure 27 |
The 2MASS galaxies form the foundation of future structural studies of the
local Universe.
 Figure 28, at right, shows the
spatial distribution of a fraction of the
2MASS extended sources in a 10°×6° slice of the Universe in the
direction of the cluster Abell 262. 2MASS redshift followup will
trace structures to redshifts z>0.1.
Figure 28, at right, shows the
spatial distribution of a fraction of the
2MASS extended sources in a 10°×6° slice of the Universe in the
direction of the cluster Abell 262. 2MASS redshift followup will
trace structures to redshifts z>0.1.
2MASS penetrates the Galactic interstellar medium to detect a
substantial number of galaxies, even in the midst of
the Galactic plane. The all-sky view in
Figure 2, above, is rich with
extragalactic texture. The structures in that figure extend through
the Galactic plane largely unhindered by Galactic extinction.
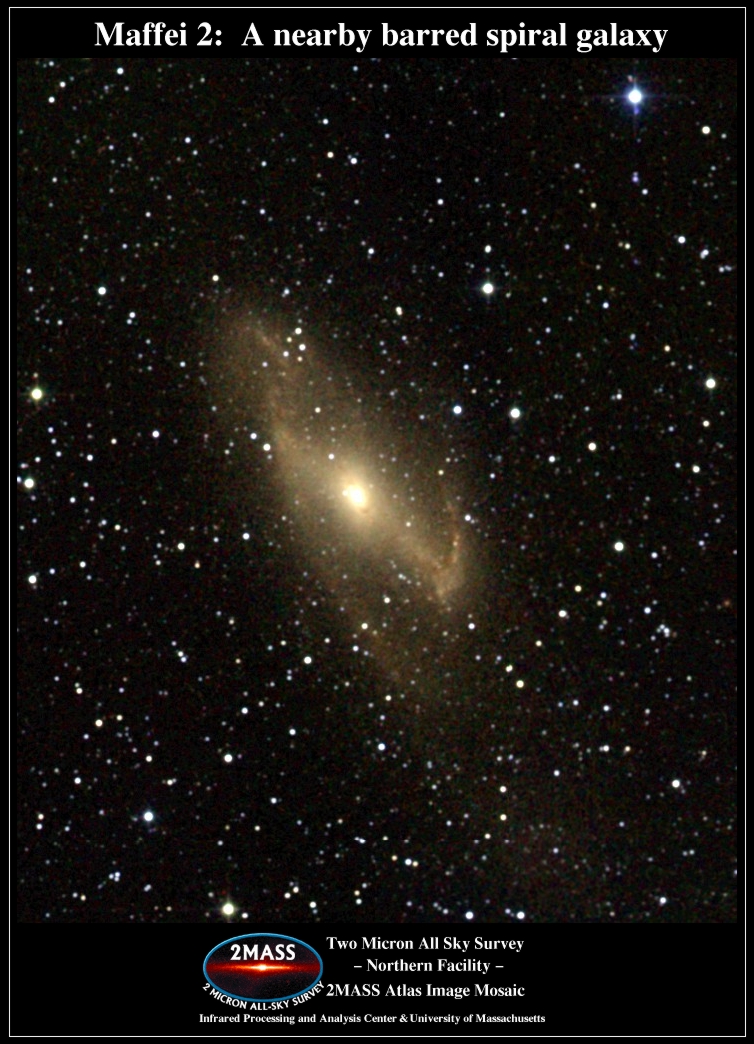
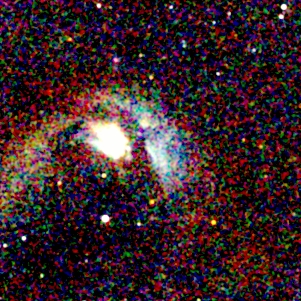
A striking example of an optically-obscured
galaxy revealed by 2MASS appears in Figure 29
at left.
 Many other
such examples have been compiled (see I.2b).
Unlike the broad visible-wavelength "Zone of Avoidance," the
2MASS Zone of Avoidance is restricted to the core of the Milky Way stellar
distribution. Only at galactic latitudes typically <10°
does stellar confusion begin to degrade the
completeness and reliability of the 2MASS galaxy selection.
Many other
such examples have been compiled (see I.2b).
Unlike the broad visible-wavelength "Zone of Avoidance," the
2MASS Zone of Avoidance is restricted to the core of the Milky Way stellar
distribution. Only at galactic latitudes typically <10°
does stellar confusion begin to degrade the
completeness and reliability of the 2MASS galaxy selection.
Figure 30 is a "movie" of the XSC sources in bins of Ks mag, showing the completeness as a function of Ks mag (see also II.3d.ii; an mpeg version can be found here). For sources brighter than Ks = 11.0 - 12.0 mag, only a very small portion of the sky near the Galactic center is incomplete.
The J-H vs. H-Ks color-color diagram (Figure 31) for areas with the highest stellar source densities shows that the major change from high latitudes in galaxy colors is simply the reddening caused by the passage of the light through the Milky Way. (Ignore the points with red circles around them, which are Milky Way sources discussed below.) A relatively small number of points show a much larger scatter, due to both difficulties in determining the background level in such complex regions, and contamination from nearby sources. See also II.3d.iv to see diagrams for intermediate levels of source densities.
| 
|
| Figure 30 | Figure 31 |
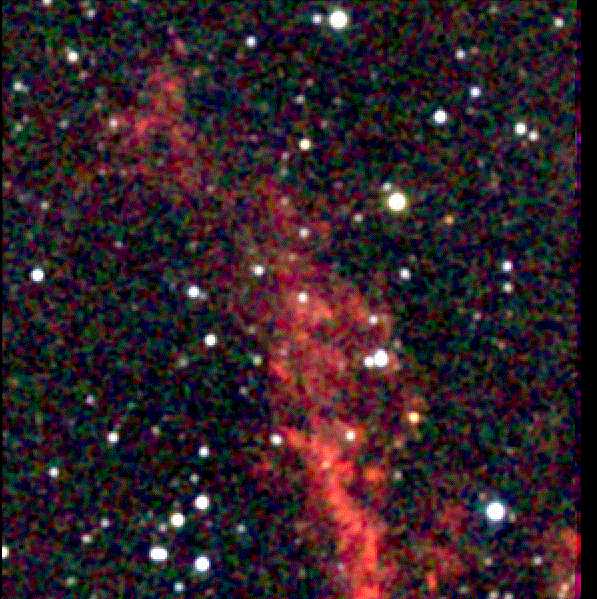
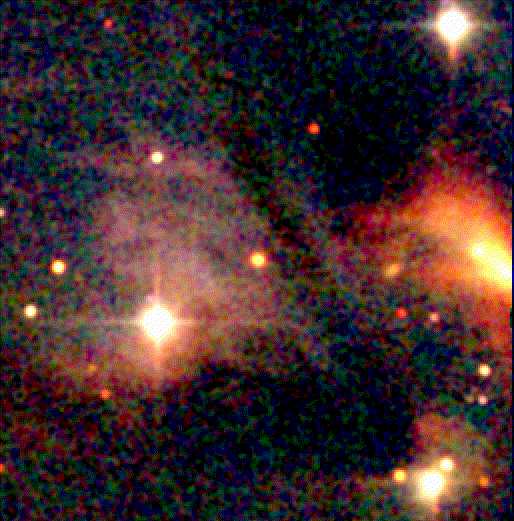
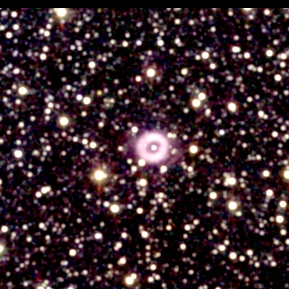
iii. Galactic Extended Sources
The XSC also contains extended sources within the Milky Way Galaxy, such as planetary nebulae, young stellar objects and star formation complexes, HII regions and emission-line nebulae, reflection nebulae, globular and open clusters, stars with extended emission, and Solar System comets. These objects are mostly confined to within 5° of the Galactic plane, except for the Gould's Belt objects and the Magellanic Clouds.
Nearly all these sources have been visually confirmed by T. Jarrett, and are circled in red in Figure 32.
The J-H vs. H-Ks color-color diagram (Figure 31) for these sources, also with red circles in this diagram, show that most of these sources are either intrinsically very red or very highly reddened.

|
| Figure 32 |
The images in Figures 33-37 below show some examples of these objects.
 |
 |
 |
 |
 |
| Figure 33 | Figure 34 | Figure 35 | Figure 36 | Figure 37 |
See also 2MASS XSC Galactic Extended Sources and XSC Gallery.
[Last Updated: 2003 Feb 25; by M. Skrutskie and T. Chester]