 color
color  0.05
0.05
 color
color  0.05
0.05
 color
color  0.05
0.05fid Ks ellip aper
The color of a "normal" galaxy is strongly dependent on the redshift of the object. As such, in order to derive the zero-redshift color of a galaxy, you need to apply a color correction to compensate for the "reddening" of the galaxy, due to wavelength redshift (the so-called "K correction"; also, galaxy evolution plays an increasing role in the color modification at high redshifts). Conversely, one may deduce the redshift of a galaxy by its colors and K-correction model. '
Question: how well can 2MASS estimate redshifts based upon measured colors?
2MASS will detect galaxies well out to z=0.1, with decreasing completeness thereafter. For z=0 to 0.1, this translates to about 0.3 mag change in H-Ks color (J-H is much less sensitive to redshift for this z range). In order to differentiate redshift at the 0.01 to 0.02 level, this translates to better than 3% to 6% error measurement in H-Ks color. This is clearly only possible for the brightest (and therefore, nearest) sources -- it should apply for Coma, Abell 262, and possibly, Hercules. A more realistic measurement error for the color is between 10% and 15%, which translates to 0.03 to 0.05 in redshift resolution, which is adequate for the more distant (z > 0.05) clusters.
Several thousands galaxies were available for an initial pilot study, including galaxies from Coma, Hercules, and the nights of 1997 Nov 10, 1997 Dec 5, and 1998 Jan 25 (all in the north). All galaxies are found in relatively low stellar source density fields (to minimize effects due to confusion and reddening). Only a fraction of this sample has known redshifts (about 900 galaxies in total). It is the latter subsample that defines the "truth set." We assume that the redshifts found in NED are correct and for the most part have small measurement uncertainties (this is undoubtedly true, but there are always a few outliers in the sample, although they should "wash out" in the statistical noise).
i. Procedure
We matched 2MASS galaxies with the NED catalog(s) and separated out galaxies with known (measured) redshifts. We then culled out galaxies with poor J, H or Ks measurements (due to source confusion, bad pixels, edge effects, etc). Finally, we culled out galaxies with color measurement errors greater than some specified limit (e.g., 10%).
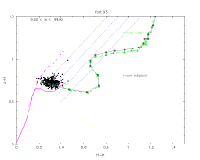
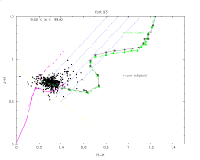
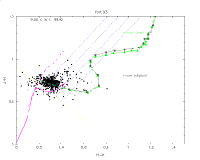
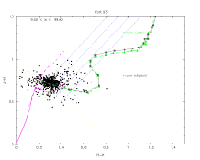
Given the J-H and H-Ks colors for a galaxy, we then deduced the redshift by comparing the colors with a K-correction model. The K-corrections correspond to SAB type galaxies with no evolution (from models Bruzual & Charlot 1993, ApJ, 405, 538, and McLeod & Rieke 1995, ApJ, 454, 611; tables provided by R. Cutri) and K-corrections corresponding to ellipticals with passive evolution (using models of Bruzual & Charlot; tables courtesy of P. Eisenhardt & A. Stanford). We do this comparison in two different ways:
The following figures show the results for data combined ("all") and for the individual clusters of Coma and Hercules. The combined data span several nights, so systematics, due, e.g., to calibration, will average down better than the data from Coma or Hercules (because they were acquired on single nights only). We have also combined all known "spirals", "S0" and "elliptical" morphological types of galaxies.
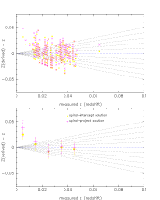
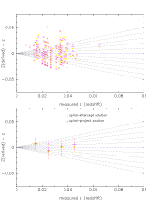
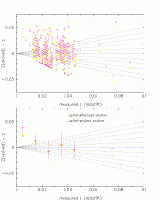
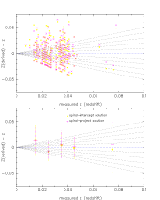
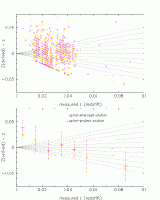
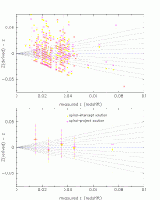
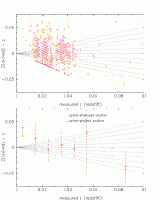
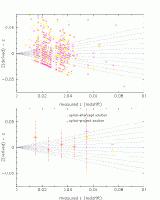
The figures show the known redshift vs. the redshift difference between what is known and what is deduced from the colors and K-correction track.
Colors are derived from apertures magnitudes corresponding to fixed 7´´-radius circular apertures -- unless when otherwise noted.
| All Galaxy Fields | ||

|

|
 |
| Figure 1 | Figure 2 | Figure 3 |
Galaxies in JHKscolor-color plane: color color  0.05 0.05
| Redshift Results for color color  0.05 0.05
| Redshift Results for color color  0.05 0.05fid Ks ellip aper |
| 
|  |
| Figure 4 | Figure 5 | Figure 6 |
Galaxies in JHKscolor-color plane: color color  0.10 0.10
| Redshift Results for color color  0.10 0.10
| Redshift Results for color color  0.10 0.10fid Ks ellip aper |
| 
|  |
| Figure 7 | Figure 8 | Figure 9 |
Galaxies in JHKscolor-color plane: color color  0.15 0.15
| Redshift Results for color color  0.15 0.15
| Redshift Results for color color  0.15 0.15fid Ks ellip aper |
| 
|  |
| Figure 10 | Figure 11 | Figure 12 |
Galaxies in JHKscolor-color plane: color color  0.20 0.20
| Redshift Results for color color  0.20 0.20
| Redshift Results for color color  0.20 0.20fid Ks ellip aper |
ii. Comments
We are systematically finding redshifts that are too high for galaxies that are nearby (z < 0.02). We seem to do rather well, on average, for 0.2 < z < 0.1. The errors range from a few % to 30%.
The nearby sample (z < 0.02) is clearly not behaving as we expect. The colors are too red (thus giving redshifts that are too large). This may be due to the fact that nearby galaxies are large (on the sky), and so we are really measuring only their inner cores (bulge component), which is known to be redder than the outer parts of galaxies. Our small circular aperture, r=7´´, is simply too small to provide a realistic color for nearby large galaxies (conversely, a large aperture may work better, except that 2MASS is not optimized to measure the fluxes of large galaxies; but, see results for elliptical aperture colors). There are undoubtedly other systematics are work here (e.g., our nearby sample might be dominated by a singe morphological type, e.g., ellipticals, due to small sample statistical fluctuations ). This requires additional work in the future.
[Last Updated: 1998 Apr 30; by T. Jarrett]