VI. Analysis of the 2MASS Second Incremental Release Catalogs
5.Position Reconstruction Performance
The position reconstruction accuracy achieved for the vast majority of
sources in the 2MASS Second Incremental Release is better than the
0.5´´ 1- Level 1 Science Requirement by
a considerable margin.
This is demonstrated below by comparisons with the ACT catalog used in
the reconstruction, as well as from the repeatability of positions of
multiply observed sources in Tile overlap regions and by comparisons to
two new astrometric catalogs (Tycho-2 and
UCAC),
released just before and after this 2MASS Release, respectively.
A relatively few Tiles
in this Release have position reconstruction errors well above the average,
due to a local sparsity of ACT reference stars.
These errors can in extreme cases reach as high as 2´´.
Particular care has been taken to assure that the position uncertainties
associated with the sources from these problem Tiles
are adequate. In fact, the quoted
position uncertainties for the entire Release, based on the
same comparisons listed above, are believed to be conservative.
Level 1 Science Requirement by
a considerable margin.
This is demonstrated below by comparisons with the ACT catalog used in
the reconstruction, as well as from the repeatability of positions of
multiply observed sources in Tile overlap regions and by comparisons to
two new astrometric catalogs (Tycho-2 and
UCAC),
released just before and after this 2MASS Release, respectively.
A relatively few Tiles
in this Release have position reconstruction errors well above the average,
due to a local sparsity of ACT reference stars.
These errors can in extreme cases reach as high as 2´´.
Particular care has been taken to assure that the position uncertainties
associated with the sources from these problem Tiles
are adequate. In fact, the quoted
position uncertainties for the entire Release, based on the
same comparisons listed above, are believed to be conservative.
a. Comparison to ACT Reference Catalog Positions
Figure 1
presents a histogram of right ascension (RA) differences (true angle) of
2MASS positions with respect to (w.r.t.)
the corresponding ACT positions for all 25493 survey Tiles.
Figure 2
shows a histogram of the declination (Dec) differences w.r.t. the ACT.
Note that the are
approximately 0.1´´ in both directions (slightly more in Dec and less
in RA) with mean differences that are essentially zero.

|
 |
| Figure 1 | Figure 2 |
These histograms
include data from 421 Tiles for which the number and/or distribution of ACT
stars was insufficient to use them as reference stars during data processing.
For these Tiles
the USNOA catalog was used, resulting in reduced reconstruction accuracy.
One measure of that reduction can be seen in residual histograms w.r.t. the
few (but unused) ACT stars in the 421 Tiles. The RA differences are presented
for these Tiles alone in Figure 3 and the Dec
differences in Figure 4. Although the
ACT differences shown here do not exceed 0.5´´, the reconstruction
errors can be systematically larger.
|
 |
| Figure 3 | Figure 4 |
b. Comparison of Tile Overlap Positions and Uncertainties
Since the ACT is used in 2MASS position reconstruction, comparison of
the reconstructed ACT star 2MASS positions does not provide a measure of
the astrometric accuracy for random 2MASS sources. For example, 2MASS
positional errors are expected to be small in the vicinity of ACT reference
stars, but errors would grow between ACT stars because of accumulating
random-walk errors in the measured 2MASS relative frame-to-frame position
offsets. Differences in the reconstructed positions of multiply-observed
stars in Tile overlap regions reveal how consistent the reconstructions
are because the astrometric solutions are evaluated independently for
each Tile using different ACT stars.
Figure 5 shows a histogram of
cross-scan (RA) position
differences for 11 million overlap match source pairs covering the entire
Second Incremental Data Release, and
Figure 6 shows a histogram of the
corresponding in-scan (Dec) differences.
Note that the standard deviation () of the
cross-scan overlap differences
is 152 milliarcseconds (mas) and of the in-scan overlap differences is 167 mas.
Since these statistics are based on differences of two essentially independent
position determinations from overlapping Tiles, a measure of the 2MASS
position reconstruction errors can be obtained by dividing the
difference by the square-root of two. This
yields =
107 mas and 118 mas for cross-scan and in-scan, respectively.
Only unconfused sources, clear of artifacts, with a J magnitude brighter
than 15.8, an H magnitude brighter than 15.1, or a Ks magnitude
brighter
than 14.3 were eligible to form the overlap match pairs upon which these
statistics are based.
|
 |
| Figure 5 | Figure 6 |
To verify that the quoted uncertainties for this preliminary release
are a conservative representation of the true astrometric errors,
the  2 values for the overlap
differences were also examined.
The 2 parameter is formed by dividing
the square of the position
difference by the sum of the quoted variances of the two positions
being differenced. Provided the quoted uncertainties faithfully
represent the actual errors, the expected mean value of
2 over a large sample is unity.
Figure 7 shows a histogram of the
cross-scan overlap 2 for the entire
Release, and Figure 8 presents the
in-scan 2. It can be seen that the mean
2 values are
well below unity (~0.5) in both directions. This would indicate that
the quoted position uncertainties are quite conservative. They are,
in fact, more conservative than first intended, as will be explained
later during the discussion of Tycho-2 comparisons.
2 values for the overlap
differences were also examined.
The 2 parameter is formed by dividing
the square of the position
difference by the sum of the quoted variances of the two positions
being differenced. Provided the quoted uncertainties faithfully
represent the actual errors, the expected mean value of
2 over a large sample is unity.
Figure 7 shows a histogram of the
cross-scan overlap 2 for the entire
Release, and Figure 8 presents the
in-scan 2. It can be seen that the mean
2 values are
well below unity (~0.5) in both directions. This would indicate that
the quoted position uncertainties are quite conservative. They are,
in fact, more conservative than first intended, as will be explained
later during the discussion of Tycho-2 comparisons.
|
 |
| Figure 7 | Figure 8 |
c. Comparison to Tycho-2(not in Tycho-1) Catalog Positions and Uncertainties
The Tycho-2 Catalog was released just prior to the 2MASS Second Incremental
Data Release. This was too late to be factored into the position
reconstruction, but does provide an additional measure of the effect of random
walk between ACT stars. For this purpose Tycho-2 stars flagged as previously
in Tycho-1 are ignored, since they are effectively the same set of stars
as contained in the ACT. The comparison is limited to new Tycho-2 stars
which are not double and for which proper motions are available.
Only 2MASS sources detected in all three bands and brighter than magnitudes
15.8, 15.1 and 14.3 in J, H and Ks, respectively, are used.
Figure 9
presents a histogram of RA differences (true angle) of 2MASS positions w.r.t.
the corresponding new Tycho-2 positions and
Figure 10
shows a histogram of the Dec differences.
The difference are 194 mas cross-scan
and 181 mas in-scan.
|
 |
| Figure 9 | Figure 10 |
Limited pre-release access to Tycho-2 during the final
stages of preparation for this 2MASS Release indicated that the
mean 2MASS:Tycho-2(not in Tycho-1) 2
would exceed unity.
This indicated that either the 2MASS errors or the Tycho-2(not in Tycho-1)
errors, or both, were under estimated. In order to be sure that
the 2MASS uncertainties for this preliminary Release are conservative,
they were adjusted
for better consistency with the Tycho-2 data. Since most of the
discrepancy was driven by sources with the lowest 2MASS uncertainties,
the floor on quoted 2MASS position for the
Release was raised from 0.10´´ to 0.13´´.
Figure 11 shows a histogram of the
resulting cross-scan 2MASS:Tycho-2(not in Tycho-1)
2 for the entire Release, and
Figure 12 presents the in-scan
2.
The mean 2 values are 1.0 and 0.9 for
cross-scan and in-scan, respectively.
|
 |
| Figure 11 | Figure 12 |
d. Comparison to UCAC Positions and Uncertainties
The first release of the U.S. Naval Observatory CCD Astrograph Catalog (UCAC)
covering most of the
southern hemisphere became publicly available within a few weeks after
this 2MASS Release.
Even though it covers a little less than half the sky, the
UCAC positions are more accurate and have higher density than
the Tycho-2 (not in Tycho-1).
Figure 13
presents a histogram of RA differences (true angle) for 6.6 million
2MASS:UCAC match pairs, and
Figure 14
shows a histogram of the Dec differences.
Note that the difference are
126 mas cross-scan and 127 mas in-scan, demonstrationing a much better
agreement between 2MASS:UCAC than 2MASS:Tycho-2(not in Tycho-1).
Only 2MASS sources detected in all three bands and brighter than magnitudes
15.8, 15.1 and 14.3 in J, H and Ks respectively, were eligible for
matching to UCAC stars.
|
 |
| Figure 13 | Figure 14 |
UCAC can also shed light on the previously noted 2 discrepancy.
Figure 15 shows a histogram of the
cross-scan 2MASS:UCAC 2, and
Figure 16 presents the in-scan 2.
Note that the mean 2 are ~0.5 in both
directions, in excellent agreement with the 2MASS overlap data.
The fact that the 2MASS:Tycho-2 (not in Tycho-1) 2 differ
is likely related to an inconsistency recently noted by
Zacharias et al.
during a comparison of UCAC with Tycho-2.

|
 |
| Figure 15 | Figure 16 |
e. Variation of Quoted 2MASS Uncertainties
The uncertainties assigned to the 2MASS positions for the
Second Incremental Data Release are presented in
Figure 17,
which shows a histogram of the cross-scan (RA) uncertainties and
Figure 18,
which shows a histogram of the in-scan (Dec) uncertainties. Note that the mean
assigned in cross-scan is 141 mas and in-scan is 144 mas.
|
 |
| Figure 17 | Figure 18 |
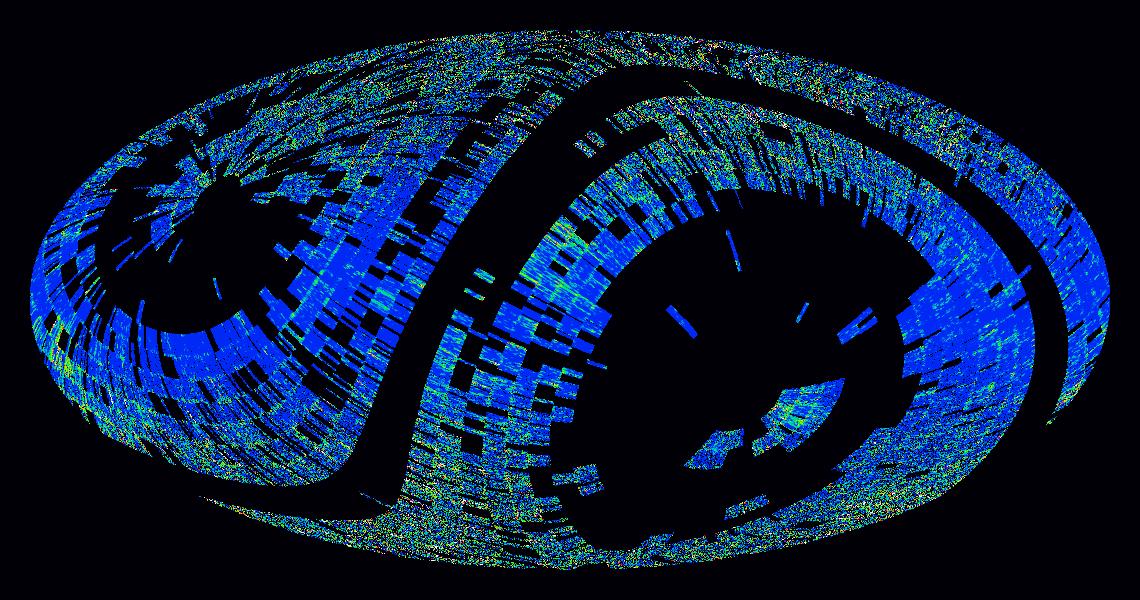
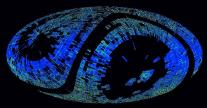
Figure 19
presents a galactic aitoff projection plot of the major axis of the
mean quoted position uncertainty ellipse for sources with Ks
magnitudes between 10 and 10.5, averaged into 10´ spatial bins.
The full range
of the display is 0.1´´-0.5´´,with blue showing the
smallest uncertainties,
red showing the largest, and green near the mid point of the range.
The image is centered on the Galactic center.
Note that increases in the uncertainties occur primarily near Tile ends
and toward the Galactic pole. There are also a few Tiles with increased
uncertainties in the heavily obscured region near the Galactic center.
Tile ends have increased position reconstruction errors, because the
reconstruction is carried out for one Tile at a time.
It is, in a sense, extrapolating
from the last ACT star near a Tile end, as opposed to interpolating between
ACT stars elsewhere along the Tile. The other uncertainty increases are
generally associated with a relative sparsity of ACT reference stars,
which occurs near the Galactic poles, as well as very near the heavily obscured
Galactic center.
|
| Figure 19 |
[Last Updated: 2000 July 13, by H. McCallon and R. Cutri.
Modified 2000 Aug 30 by S. Van Dyk.]
Previous page. Next page.
Return to Explanatory Supplement TOC Page.