We assess the uniformity of the photometry over large areas of the sky in three ways:
This specification is driven by the concern that drifts in calibration at small spatial frequencies might lead to inference of spurious features using star count analyses. We estimate a 1-2% global photometric calibration error which will make the PSC a major resource for Galactic structure.
Beyond this, we offer two additional overall diagnostics for global photometric uniformity: sensitivity and color uniformity. The former tests our ability to use the PSC to search for and study Local Group dwarfs and the latter is of special interest in stellar populations studies. The interband (color) uniformity is at the same 1-2% level as the photometric calibration.
ii. Calibration
The standard 2MASS calibration program observes multiple
calibration fields per night from the range of visible RA. Zero
points of nightly data are determined from standards in each field.
We use this database to derive the set of photometric solutions which
minimizes the overall variance of solution for all observations. This
global calibration scheme is sensitive to small (<1%) systematic
changes photometry around the sky. The residuals reveal an
approximately 1.5% seasonal variation consistent with extinction
variations.
We currently observe the self-consistent tie between the North and
South to be at the 1% level (which is close to the limits of our
analysis, see figures below). This exceeds the Level 1 specification
of 4% photometric spatial uniformity. Figure 1
shows the north-south differences as a function of magnitude;
there is evidence for a trend at the 1-2% level.
Figure 2 shows the north-south differences
between common stars as a function of RA. The mean offsets are consistent with
zero.
|
|
| Figure 1 | Figure 2 |
The following compares the global solution for the standards in the equitorial fields with the quoted value for the standards. The original solution is unconstrained and based on the fiducial magnitude assignments. The zero point is set by adding a constant offset which minimizes the difference between the solution and Persson magnitudes. Figure 3 show differences by magnitude. Figure 4 show differences by RA. The key to these two figures is northern solutions are shown in blue, southern solutions are shown in red. The obvious outlier (Persson standard from field 90547) was discovered to be a variable star as a result of our analysis. We used the tracer stars from the analysis itself to select a new primary standard.
 |
 |
| Figure 3 | Figure 4 |
iii. Sensitivity Variation Per Band
In Figure 5 we show the cumulative counts as a
function of increasing magnitude for each band.
High-Latitude Sources
|
| Figure 5 |
Figure 5 includes a sample of 2 million sources with |b|>20° and |l|>30° (avoiding the Galactic center region). The rollover magnitudes in the table below are consistent with the Level 1 specifications and the distribution is smooth and continuous from "Read 1" (0.51-ms exposures) through "Read 2" (1.3-s exposures).
| Band | J | H | Ks |
| Rollover | 15.8 | 15.4 | 15.2 |
To ascertain sensitivity variations, we determined the joint magnitude and signal-to-noise ratio (SNR) distribution, P(M, SNR), for each band. Figures 6, 7, and 8 below show the mean magnitude at SNR=10 for J, H, and Ks, respectively. The mean magnitude is color-coded for each of 1152 (48×24) equal area bins in Galactic coordinates. These three figures are restricted to a range of 1 mag. Figures 9, 10, and 11 show the full range of the mean magnitude.
|
|

|
| Figure 6 | Figure 7 | Figure 8 |
|
|
|
| Figure 9 | Figure 10 | Figure 11 |
Expected drops in sensitivity are seen in the confused regions (e.g. Galactic center and Magellanic clouds) and in known regions of extinction about the Galactic plane. Restricting ourselves to high latitudes, we can look for the signature of correlation in equatorial coordinates in the Galactic system. None are evident in J. There are "stripes" in the RA direction in H and Ks bands describing sensitivity variations at the 0.2 mag level. In H, these are regions of increased sensitivity, and Ks, these are regions of decreased sensitivity.
Although we do not have a specification for variation in spatial sensitivity, the overall uniformity with only a few isolated varations should permit a variety of global backround analyses.
We similarly studied the variation of quoted error and
 2
of PSF fit photometry. These are spatially stable with no evidence of
equatorial correlation.
2
of PSF fit photometry. These are spatially stable with no evidence of
equatorial correlation.
iv. Color Uniformity
We examined the band-to-band (color) uniformity by analyzing
the magnitude distribution in J-K and H-Ks colors of stars in a
narrow-range J-H color cut, corresponding to G stars (mostly dwarfs with
some giants (Figure 12).
 |
| Figure 12 |
The reddening direction nearly coincides with J-Ks and therefore the stability of the spatial distribution is a test of both atmospheric and astronomical reddening, as shown in Figure 13. The intrinsic Galactic extinction is evident, but bias in equatorial coordinates is distinguishable. In particular, the H-Ks distribution shows a color bias at the north celestial pole of approximately 0.02 mag. This is within our uniformity limit and probably reducible in the final reprocessing.
|
| Figure 13 |
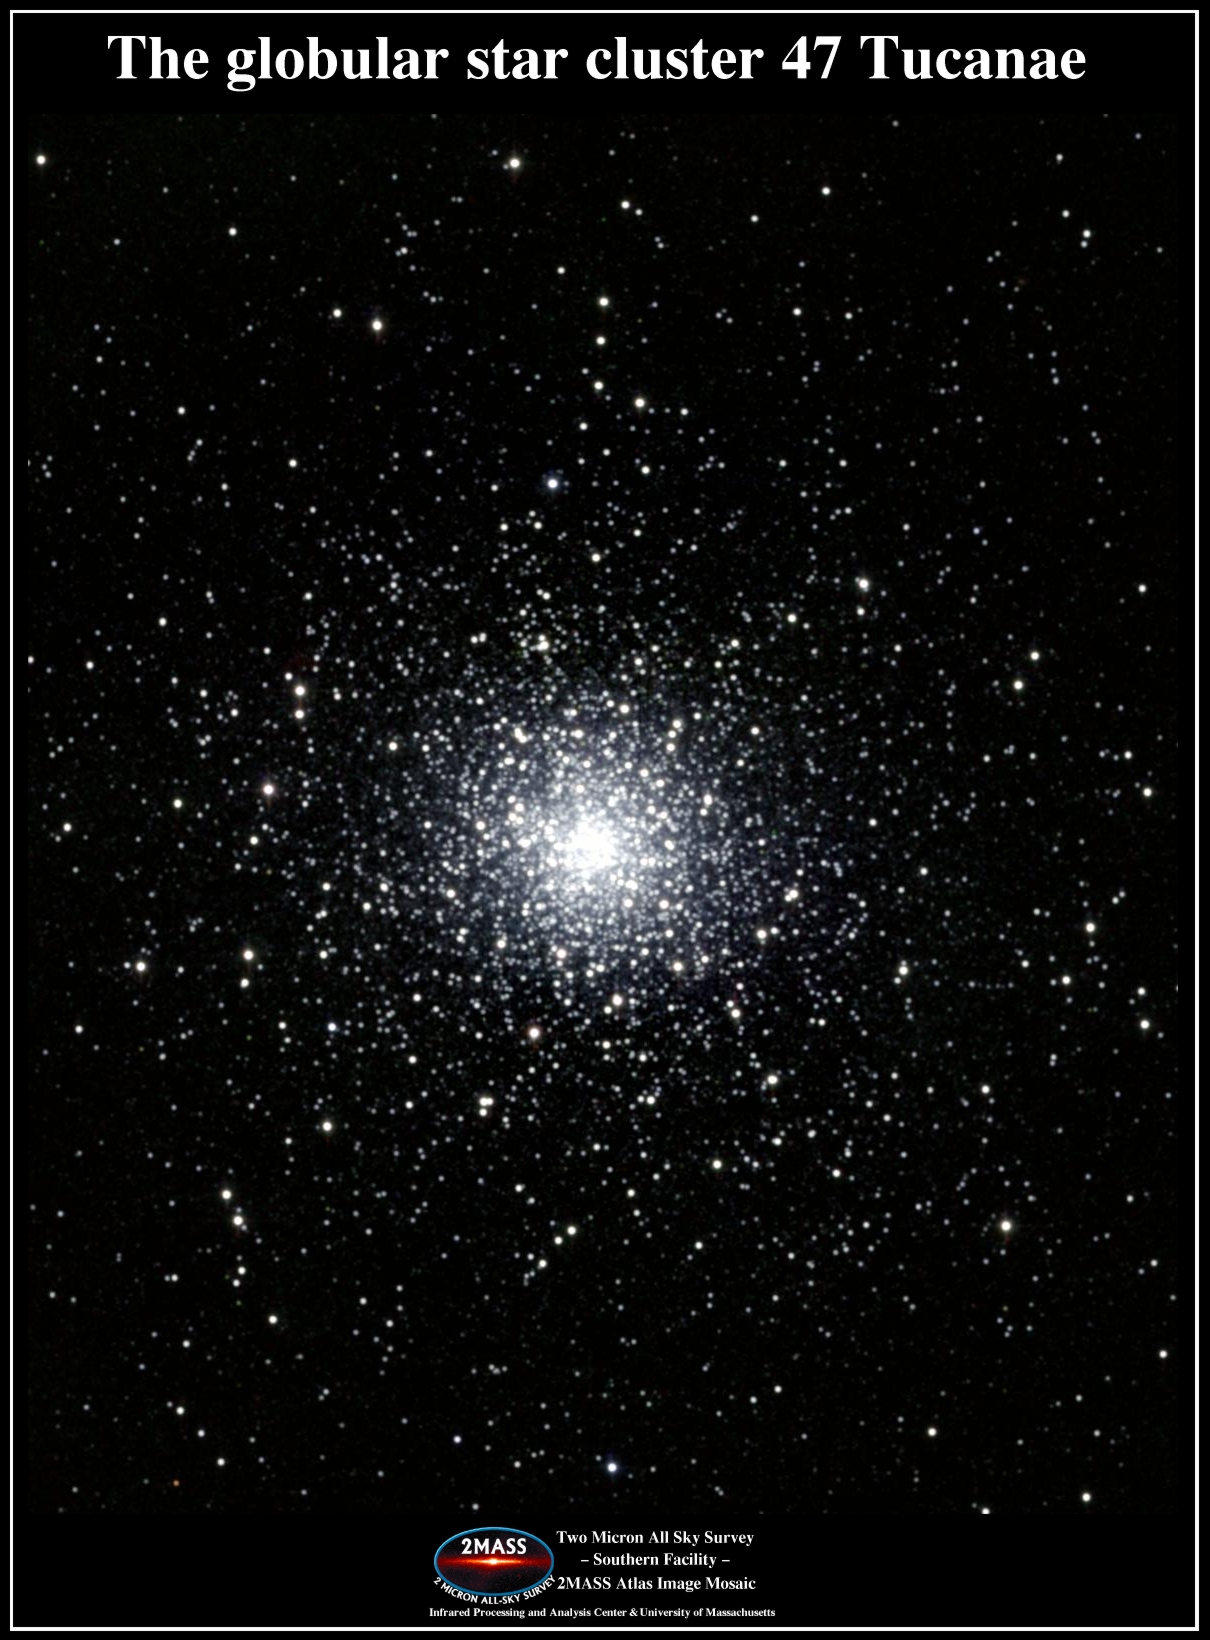
The color-magnitude diagram of 47 Tucanae, shown in Figure 14, demonstrates the promise of 2MASS for populations studies. The data are within 0.5° of the center of the globular cluster, with errors in all bands less than 0.1 mag. Typical errorbars are shown at the right-hand side of the figure. Prominent features of the 47 Tuc giant branch are the horizontal branch (Ks = 11.94, J-Ks = 0.54 mag), the red giant branch (RGB) bump (Ks = 12.1, J-Ks = 0.62 mag), and the asymptotic giant branch (AGB) bump (Ks = 11, J-Ks = 0.65 mag). The RGB tip is poorly defined, due to the small number of stars, but lies near Ks = 7 mag. (The tip of the RGB for the Small Magellanic Cloud is visible at lower right of the figure.)
 |
| Figure 14 |
[Last Updated: 2000 Feb 6 by M. Weinberg. Modified 2000 Jul 20 by S. Van Dyk.]