 detection (0.109 mag)
at the following magnitude levels: J = 15.8, H = 15.1, and Ks = 14.3
mag for unconfused sources outside of the Galactic Plane (|b| > 10°).
detection (0.109 mag)
at the following magnitude levels: J = 15.8, H = 15.1, and Ks = 14.3
mag for unconfused sources outside of the Galactic Plane (|b| > 10°).
The Level 1 Specifications call for a 10- detection (0.109 mag)
at the following magnitude levels: J = 15.8, H = 15.1, and Ks = 14.3
mag for unconfused sources outside of the Galactic Plane (|b| > 10°).
The 2MASS observing strategy requires the observation of a 1°-long
calibration tile every hour during a night of observation. The calibration
session involves 6 repeated observations of the calibration tile, and thus,
6 observations of each star within the tile. These repeated observations
give a direct measure of the instantaneous sensitivity of the system.
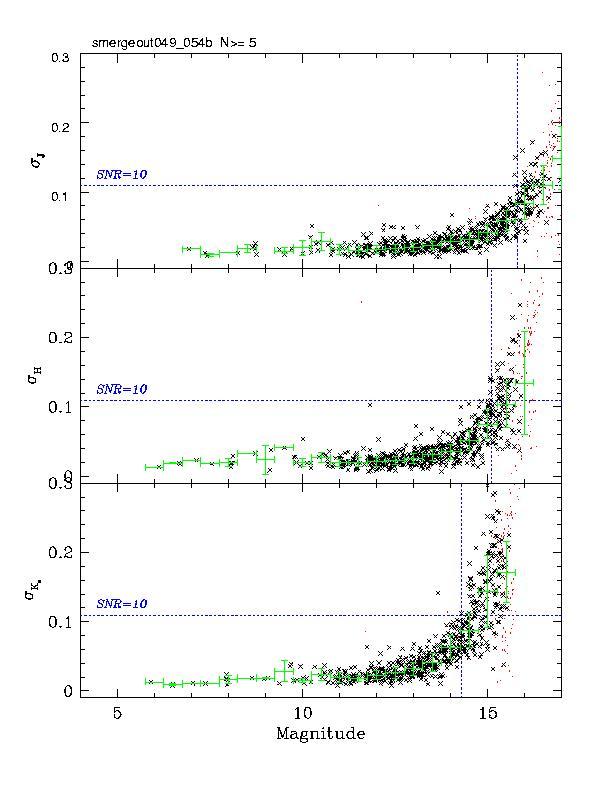
Figure 1
shows the results of one of these calibration sessions chosen
at random. Each point in the figure is the RMS of one of the stars in the
calibration field as a function of the star's magnitude. The green bars
are the ensemble statistics for each half-magnitude bin. The point at which
the ensemble statistics cross the 10- line marks
the sensitivity of that particular calibration set. Since each of these
calibration sessions samples the survey sensitivity as a function of the other
survey variables -- particularly background and seeing -- the ensemble of
calibration observations permits 2MASS to map its real-time sensitivity to the
instantaneous background and seeing.
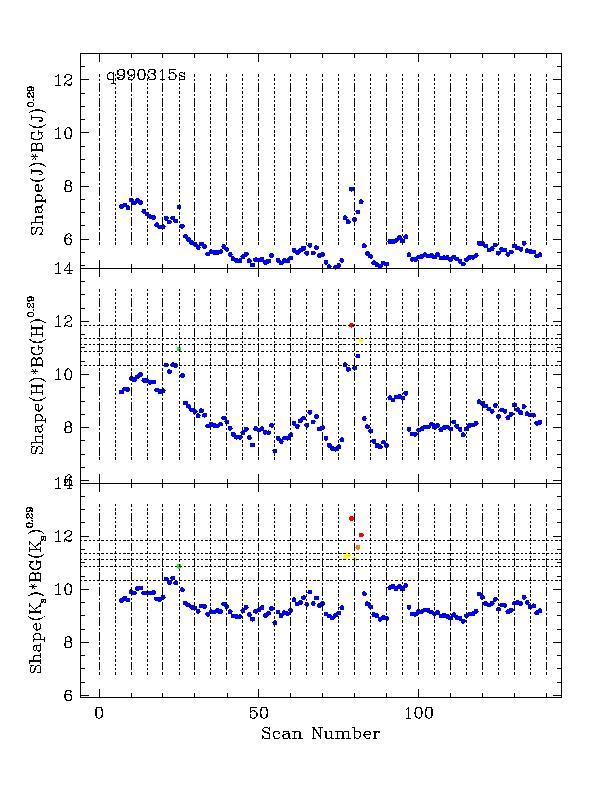
Background and seeing values are extracted for each of the 2MASS science tiles, directly measuring their limiting sensitivity on a tile-by-tile basis. Figure 2 shows a nightly summary of the sensitivity of both the science and calibration data for the same random night of 2MASS data. The horizontal lines in the figure are thresholds for scoring data based on the knowledge of sensitivity variation from the calibration history of the project as described in the paragraph above. Points falling below the middle horizontal dashed line exceed the survey's sensitivity targets (Several lines appear because the data can receive a range of sensitivity scores to aid in assigning priority for re-observation. The lines are off of the top of the J-band plot -- J-band consistently exceeds the survey's sensitivity requirement). The 2MASS Quality Assurance review process prevents tiles with sub-threshold sensitivity from entering the public release dataset by downgrading these tiles quality score (which has the consequence of ultimatley queuing the tile for re-observation).
The 2MASS release dataset meets the Survey sensitivity requirements because the sensitivity limit is strictly and knowledgeably enforced at the time of data quality assurance review.
The above statement would be rigorously true were it not for the fact that the sensitivity scoring for the Southern system was recently revised to reflect a less sensitive array in the H-band relative to the North. The consequence is that as much as 5% of the Southern data in the release may have a sensitivity up to 0.1 mag below the H-band specification. These tiles have been subsequently rescored and are queued for reobservation.
|
|
| Figure 1 | Figure 2 |
[Last Updated by M. Skrutskie. Last Modified: 2000 Sep 21 by S. Van Dyk.]