The 2MASS Survey Merged Point Source Information Table contains the ``best" estimate of the position and flux for any source observed multiple times during 2MASS survey observations. Multiple apparitions naturally occurred due to the ~10% overlap between adjacent tiles as well as the complete re-observation of a significant fraction of the Survey's tiles (~20%) to improve upon marginal sensitivity or poor seeing. The survey Point Source WDB contains data taken under photometric conditions but, for PSWDB data of in tiles not included in the All-Sky Point Source Catalog, the photometric quality has not been scrutinized with the same rigor as for the PSC. The photometric quality of the additional PSWDB photometric tiles is quite good in general, so combining the two or more apparitions of the same source yields better flux precision as demonstrated below.
This section examines two regions of the sky in the Survey Merged Point Source Information Table.
The North Galactic Pole
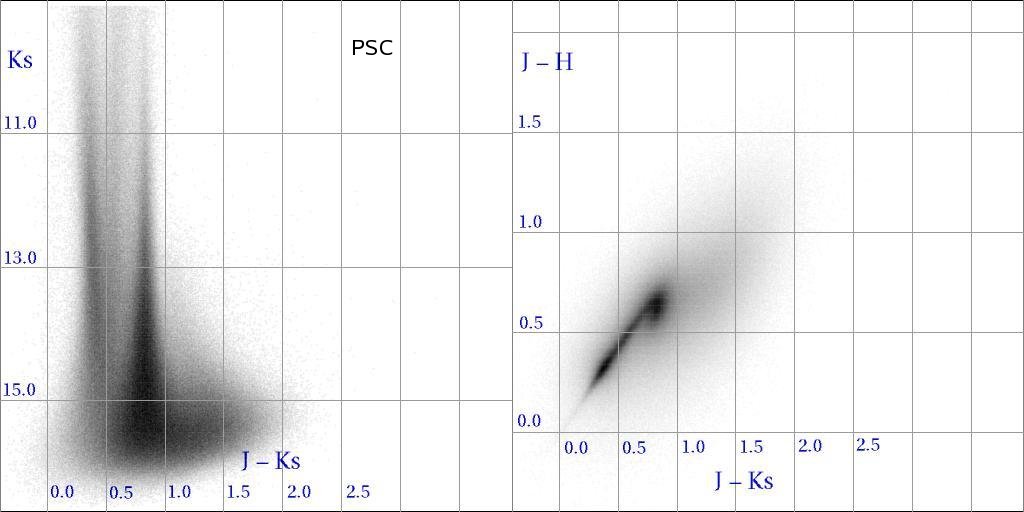
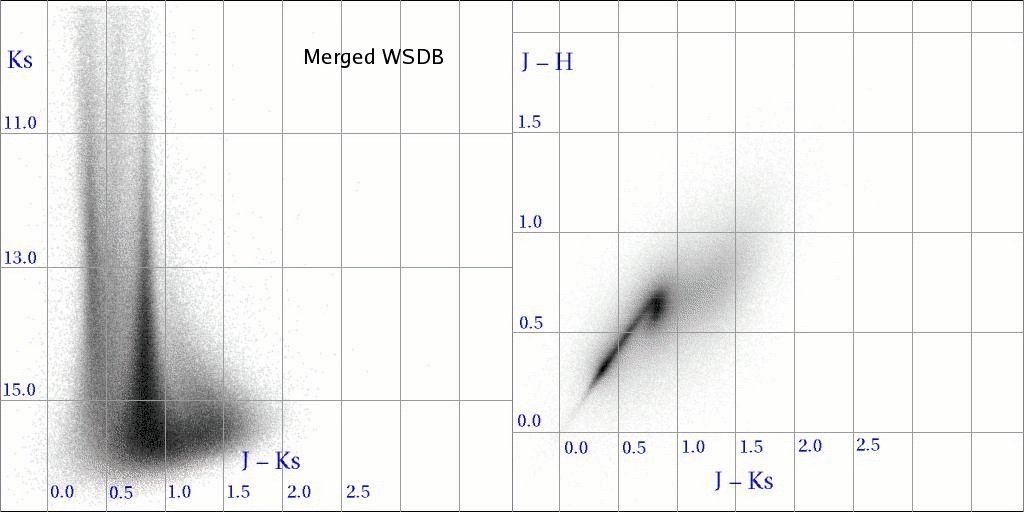
The Hess diagrams below compare the contents of the All-Sky PSC (left) and Survey Merged PSWDB (right) for a 20° diameter field (b>80°) at the North Galactic Pole pole. Only sources of high reliability are included (ph_qual!~'[EFUX]') for the PSC and rel_avg='A' for the Merged PSWDB).
|
|
|
| Figure 1 - Color-magnitude and color-color Hess diagrams for sources in the 2MASS All-Sky PSC within 20° of the north galactic pole. | Figure 2 - Color-magnitude and color-color Hess diagrams for sources in the 2MASS Survey Merged Point Source Information Tables within 20° of the north galactic pole. | |
| Blink comparison between Figures 1 and 2 | ||
|
|
|
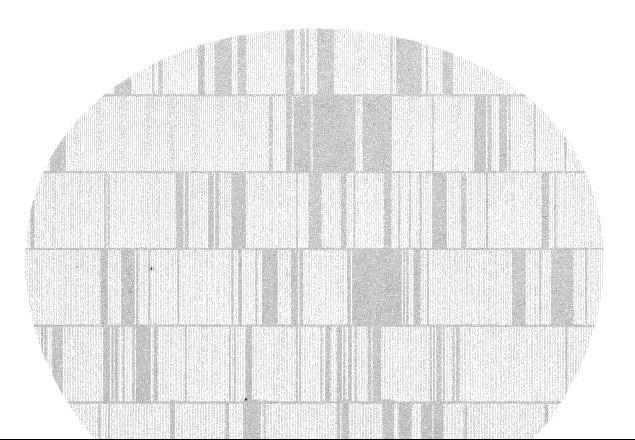
| Figure 3 - Distribution of Survey Merged Point Source WDB sources in RA and Dec. The diameter of the circle is 20° and the circle is centered at the North Galactic Pole. Evident are the tile overlap regions (narrow vertical strips), declination overlap between declination bands (horizontal lines) and re-scanned tiles (larger patches). | Figure 4 - Histogram of the number of sources as a function of sdet (number of apparitions being averaged to form the mean fluxes). | |
The South Celestial Pole
The Hess diagrams below compare the PSC (left) and Survey Merged PSWDB (right) for the heavily overlapped tiles at the South Celestial Pole using the same selection criteria as for the North Galactic Pole Comparison above.
 |
 |
| Figure 5 - 2MASS All-Sky PSC - Linear scaling | Figure 6 - 2MASS All-Sky PSC - Sqrt scaling |
 |
 |
| Figure 7 - 2MASS Survey Merged PSWDB - Linear scaling | Figure 8 - 2MASS Survey Merged PSWDB - Sqrt scaling |
[Last Update: 2006 August 22; by M. Skrutskie]