Appendix 1. Introduction to the 2MASS Extended Mission and Ancillary Data Products
4. Cautionary Notes
a. General Cautionary Notes for the
2MASS Extended Mission Ancillary Data Products
- Additional Information Available
- Using the 2MASS Extended Mission Products
- Sky Coverage Non-Uniformity, Variable
Depth-of-Coverage and Limitations
- Sensitivity Variations
- Low Quality Scans
- The 6x READ1/READ2-READ1 Sensitivity Gap
- Astrometric Biases in the Calibration Scan Data Products
i. Please see General Cautionary Notes for the 2MASS All-Sky Release (I.6.a)
More thorough descriptions of the general cautionary notes for
the Survey Reject and 6x and Calibration Working Database Tables and Images
are available at:
ii. Using the Extended Mission
Databases and Image Atlases
Because all 2MASS data were obtained with well-characterized
facilities and reduced with the same processing software that incorporates
multiple levels of quality assurance, the overall characteristics of
the 2MASS Survey Reject Tables, 6x and Calibration Working Databases
and their corresponding Image Atlases are expected to be
comparable to the those from the All-Sky Release.
However, the Extended Mission Products contain, in part,
extracted source data and images that do not meet the
strict standards of reliability and uniformity required for
the primary 2MASS products. In addition,
the Extended Mission Databases and Images have not been as carefully analyzed
the All-Sky Release Catalogs prior to their release, so
all areas of performance have not been characterized and validated.
Users should therefore use these products
with care and follow these recommendations:
-
The Survey Source Reject Tables and 6x and Calibration WDBs
are not "Catalogs" in the same sense as the highly reliable and uniform
All-Sky Release PSC and XSC.
They contain a large number of unreliable extractions of noise, image
artifacts and transient events by design. The Reject Tables and WDBs
may also contain multiple, independent detections of astrophysical sources
in regions of the sky scanned two or more times during 2MASS survey,
6x and calibration observations.
Do not use these products to draw reliable or complete samples of
objects with which to conduct statistical analyses.
-
Use the redundancy in the survey, 6x and calibration
measurements
to learn more about sources discovered in the 2MASS All-Sky Release and
6x Catalogs or to search for objects with special characteristics in a
limited area. This includes obtaining improved
photometric precision by averaging together multiple, independent
source measurements, testing for variability or source motion, and
investigating source reliability through detection confirmation statistics.
-
Pay attention to and take advantage of the numerous
extracted source
quality flags that are provided with each point and extended source
Reject Table and WDB entry
(e.g. rel,
cc_flg,
ph_qual,
vc)
when assessing source reliability and measurement
quality.
-
Use the Full Survey, 6x and Calibration Image Atlases to
examine
the images and environments to assess the reliability and/or measurement
accuracy of any source in the Extended Mission Point and Extended Source
Tables about which you have questions. Be aware that there may be more
than one set of images (J, H and Ks) available
covering a location on the sky from different epochs that can be
used to verify source reliability.
iii. Sky Coverage Non-Uniformity and Limitations
The effective sky coverage of
the 2MASS Extended Mission Image Atlases and Source
Databases are non-uniform and complex. Consequently,
these products are not suitable for extracting statistically
complete samples of objects sources.
Full Survey Atlas and Point and Extended Source Reject Tables
The Full Survey Image Atlas and the Survey Point and Extended
Source Reject Tables (PSRT and XSRT)
are drawn from all 70,712 6°-long
survey mode scans that
covered 99.998% of the sky
made in photometric conditions. However, the content and depth-of-coverage
of the PSRT and XSRT in specific scans depend on whether that scan was
used in the 2MASS All-Sky Release, and how many times that position
on the sky was observed.
- In the 59,731 survey scans that were
selected for the All-Sky Release,
the PSRT and XSRT contain only those source extractions not
included in the All-Sky Release PSC and XSC. Thus, they
do not contain most reliable detections of
astrophysical sources. Instead, they contain:
- Low SNR extractions of both faint astrophysical sources and
noise excursions, both of which were below the thresholds used
to select the highly reliable catalogs.
- Spurious extractions of image artifacts produced by bright stars
and transient events such as cosmic ray hits, meteor trails
and intermittent noisy detector pixels.
- In the case of the XSRT, detections of single and multiple stars
that are not truly extended.
- Bright, reliable source detections near scan edges that
were excluded from the Catalogs during the multiple
detection resolution process.
- In the 10,981 survey scans that were not used for the All-Sky
Release,
the PSRT and XSRT contain the reliable detections of astrophysical sources
that are analogous to those found in the All-Sky Release Catalogs
in addition to the spurious
detections of low SNR noise events, image artifacts and transients described
above.
Approximately 30% of the sky was observed
more than once during 2MASS survey operations
(see A2.1.a.i). Half of that area
is contained in the overlap region between survey
tiles, and half is contained in the
8,266 tiles that were repeatedly scanned.
The Full Survey Image Atlas contains two or more, independent images
of all regions that were observed multiple times. There may
be up to ~500 images covering locations near the equatorial poles
where survey tiles converged. One measurement of sources that were observed
and detected multiple times in the survey scans are usually found in the
All-Sky Release PSC or XSC. The remaining detections are contained in the
PSRT or XSRT. Objects observed and detected three or
more times may have multiple, independent measurements
in the PSRT or XSRT.
6x Image Atlas and Point and Extended Source Working
Databases/Catalogs
2MASS 6x observations covered a much more limited area
than the main survey. Approximately 589 deg2
of sky was observed with the longer exposure times, distributed among
30 discrete fields containing targets of astronomical interest
(see Figure 1 in A3.2).
Most of this area is contained in two large regions covering the
Large and Small Magellanic Clouds, in which 383 deg2 and
127 deg2 are surveyed, respectively. The remaining
~80 deg2 is in 28 smaller fields, the largest
covering 28.3 deg2 in the Lockman Hole region.
The 6x field observations were conducted using either 6°-long
or 1°-long scans, depending on the size of the region to
be covered. As illustrated in Figure 1, the coverage within
each field was often complex and usually not defined by a simple rectangle
on the sky. There are often coverage gaps within the fields
that were resulted from tiles being missed due to poor weather and
because of telescope commanding errors. The footprints of the scans covering
each field are presented in the detailed 6x field description
pages in A3.2.b.
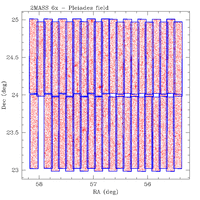 |
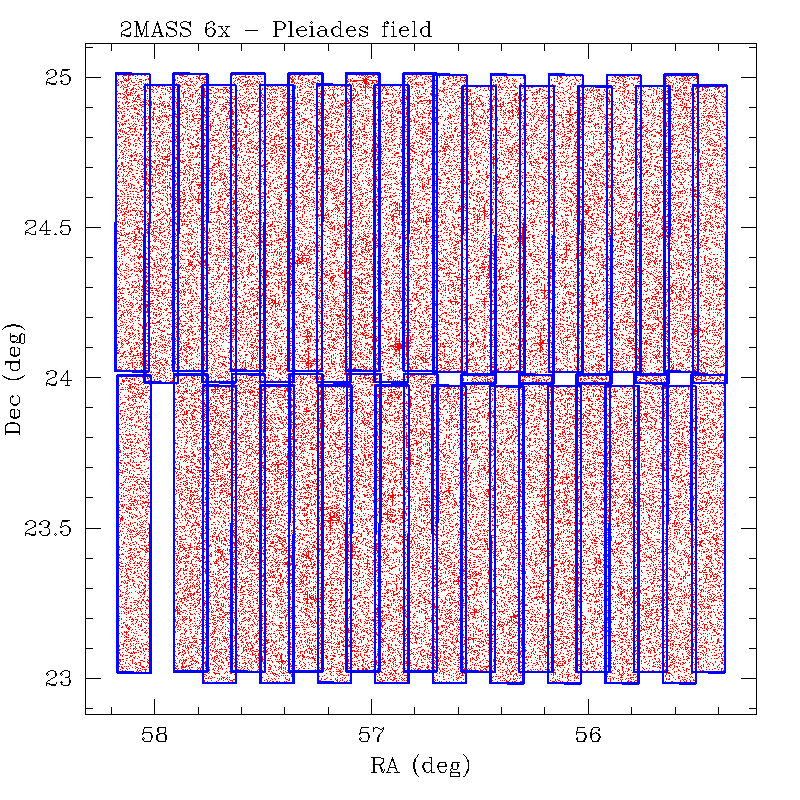
| Figure 1 - Sky map showing the outlines of 6x scans covering the
Pleiades field (blue lines), and the distribution of 6x-PSWDB extractions
(red dots).
Note the coverage gaps at the declination boundaries between some
tiles, and the missing tile coverage near the eastern edge
of the field. |
Calibration Scan Image Atlas and
Point and Extended Source Working Databases
2MASS calibration observations covered the smallest area of all
the 2MASS data sets - approximately
6 deg2 of sky distributed among the 40
fields shown in Figure 1 in A4.1.
What the calibration observations lack in area, though,
they make up for in depth-of-coverage and variety in sampled
astrophysical environments.
Each time a calibration field was observed,
a 1°-long area was scanned six consecutive times in alternating
north-south directions. The 2MASS telescopes were stepped 5" east
in RA between each scan within a calibration observation, so the total
area covered is usually ~0.15 deg2. Over the course of the
2MASS survey operations, the calibration fields were observed
between several hundred and several thousand times.
In most fields, the footprints of the scans were relatively
well-registered on the sky (Figure 1). However, a small fraction
(<5%) of the scans in a few of the fields were displaced from the nominal
position due to occasional telescope pointing variations. This
results in irregular coverage patterns such as shown in Figure 2.
The depth-of-coverage in the calibration fields ranges from one scan at the
extreme edges, up to several hundred or thousand along the central
parts of the field.
 |
 |
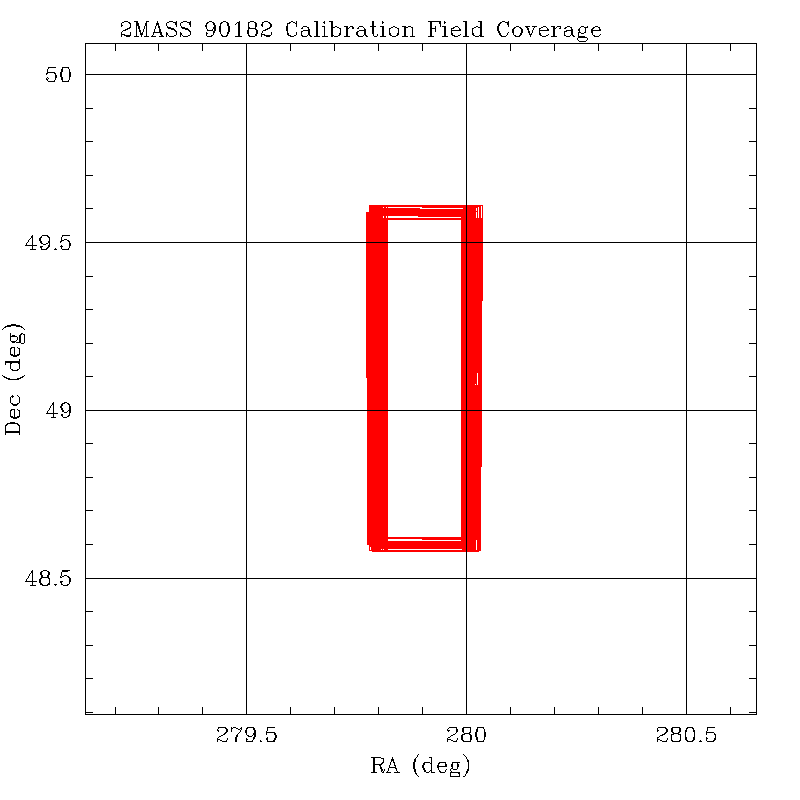
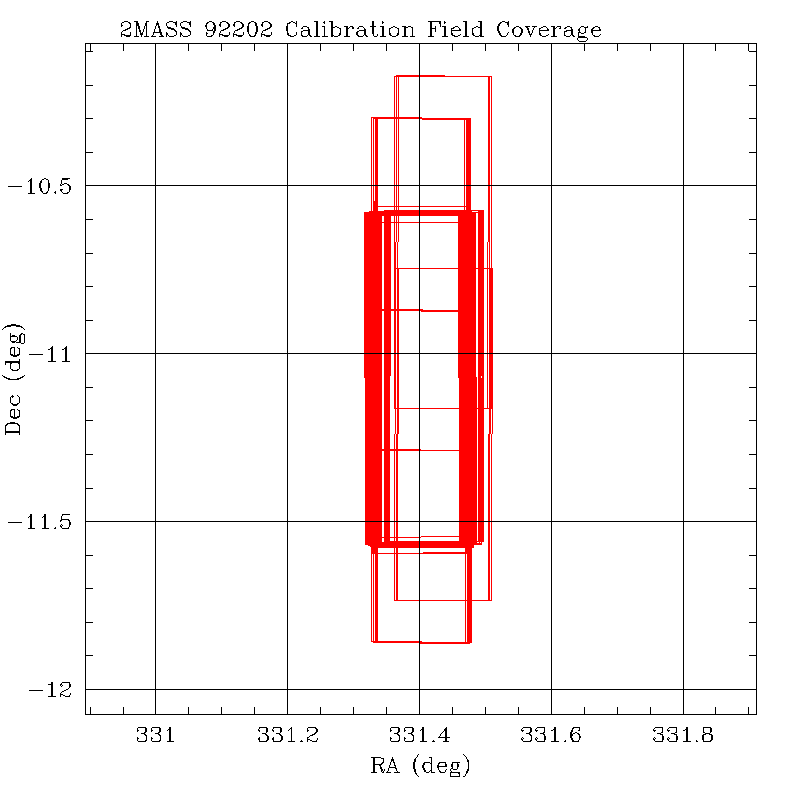
| Figure 2 - 90182 Field Coverage | Figure 3 - 92202 Field Coverage |
| Coverage maps showing footprints of 1703 scans of the
90182 calibration field (left) and 2802 scans of the 92202
field (right). The maps show a 1�x2� area in cartesian projection
with the RA scale exaggerated to emphasize the scan cross-stepping.
The scans of 90182 were all well-registered, while ~1% of the
scans of 92202 were off the nominal field position. |
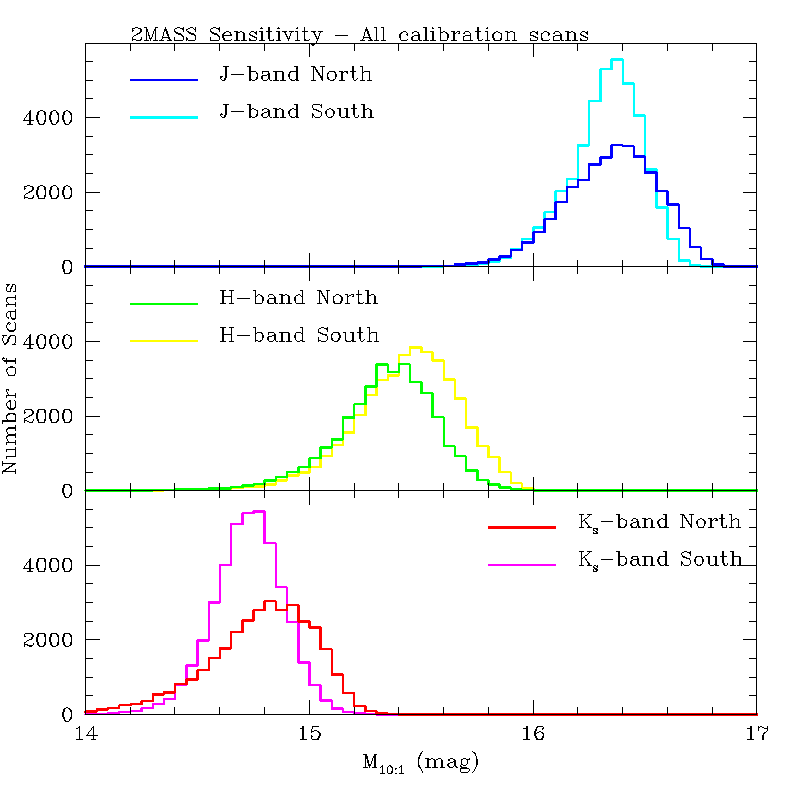
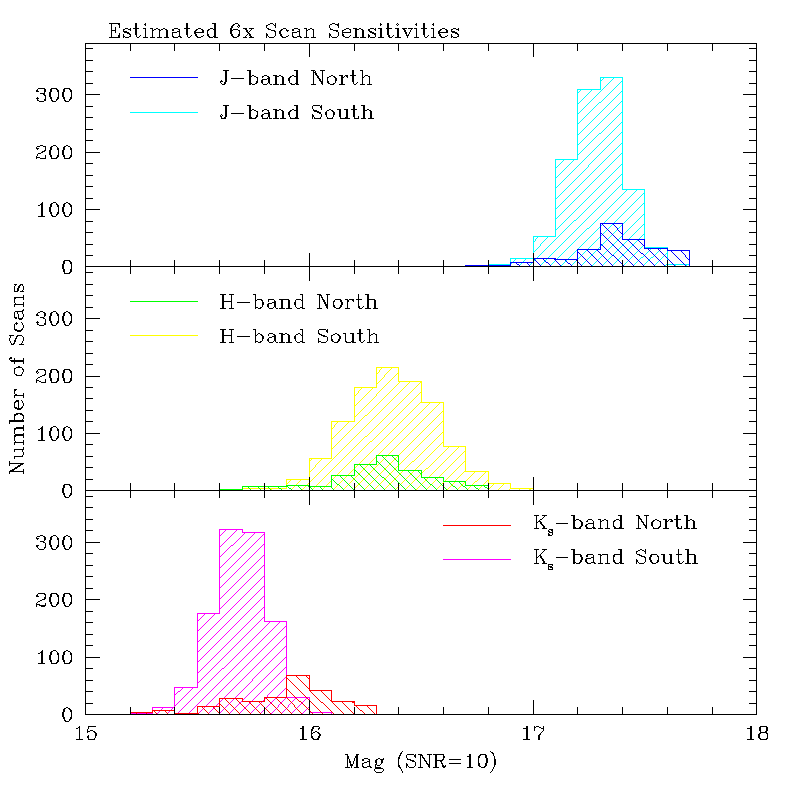
iv. Sensitivity Variations
Within each of the 2MASS survey, calibration
and 6x data sets, the relative photometric sensitivity achieved
varied by up to one magnitude because of variations in atmospheric
transparency, seeing and
background emission levels at the time of each observation.
Figures 4, 5 and 6 show distributions of SNR=10 photometric sensitivities
levels all 2MASS survey, calibration and 6x scans, respectively, estimated
using the empirical relationship between observing condition and photometric
repeatability described in VI.2.
The average point source sensitivity level achieved
for survey and calibration observations is J=16.3, H=15.4
and Ks=14.7 mag, and the 6x sensitivities are approximately
one magnitude fainter because of the longer exposure times.
Within each data set, the achieved sensitivities span a range
of up to one magnitude because of the differences in atmospheric observing
conditions.
The estimated SNR=10 magnitude level for each 2MASS survey, calibration
and 6x scan is given by the [jhk]_msnr10 values in
the respective Scan Information Tables.
A number of the survey and calibration scans
have estimated sensitivities below the thresholds specified in
the 2MASS Level 1 Requirements.
Data from survey scans with sensitivities below the required levels
were generally not selected for inclusion
in the All-Sky Release, but are still contained in the survey
Reject Tables and Full Survey Atlas. The sensitivity of survey
scans not used in the All-Sky Release is shown in Figure 4 by
the dashed lines. Calibration scans were not
required to meet the survey's sensitivity thresholds, so there are
proportionally more low sensitivity scans in the calibration data set.
Expect to find elevated photometric uncertainties for fainter sources
and brighter completeness limits than in the All-Sky or 6x Catalogs in scans
of tiles with low sensitivities. Because most scans with poor sensitivity
were reobserved under better conditions, it is often possible to find data
from alternative scans of the same tile with better sensitivity among
the various 2MASS data sets.
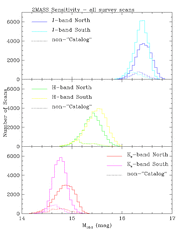 |
 |
 |
| Figure 4 - Survey Scans | Figure 5 - Calibration Scans | Figure
6 - 6x Scans |
| Distribution of estimated SNR=10 point source
sensitivity levels achieved in all 2MASS survey (left), calibration (center)
and 6x scans (right), in the absence of confusion.
For the survey scans, the dashed lines denote the subset that were not
selected for the All-Sky Release Catalogs.
Note that some scans in the survey and calibration data sets fall below
the sensitivity
requirements for the main survey (J=15.8, H=15.1, Ks=14.3 mag) |
v. Low Quality Scans
The 2MASS Extended Mission Image Atlases and
Source Tables contain data from survey, 6x and calibration scans that may not
meet all of the survey's quality requirements,
or that exhibit other anomalies.
Survey and 6x Image Atlas and Source Tables
The calibrated images and source lists extracted from each
2MASS survey and 6x scan were subjected to a rigorous and uniform
Quality Assurance process during
survey data reduction. This process resulted in the assignment of
a numerical quality score for each
scan indicating the likelihood that the data satisfy the survey's
Level 1 Requirements (adjusted by +1 mag
for the 6x data products). Scans of tiles
that have a 100% chance of meeting these requirements were
assigned quality=10, and those with the lowest probability
of meeting the requirements but were still taken under photometric
conditions were assigned quality="1".
Quality="0" was reserved for scans that were known to
fail the requirements, usually because of non-photometric weather.
Only data from survey scans with quality>0 were loaded into the Survey
and 6x Working Databases and Image Atlases.
The quality score for the survey and 6x scans is given in the
qual column
in the Survey and 6x Scan Information Tables.
During the course of the 2MASS survey and 6x observations, tiles with
scans having poor quality scores were scheduled for reobservation,
and most of these were successfully observed under improved conditions.
The scan of each tile with the best relative quality
was selected for the All-Sky Release and
6x Catalogs and Image Atlas. However, the
Full Survey and 6x Image Atlases and Survey Source Reject Tables and
6x WDBs contain the calibrated images and extracted source data from
all q>0 survey and 6x scans, including those with quality that
may fall below
various thresholds and requirements imposed on the All-Sky Release
and 6x Catalogs.
The Survey Scan Information Table
contains several flags that identify observations that were found
to exhibit anomalies or peculiarities during
quality review.
These flags and their corresponding anomalies
are summarized in Table 1. Scans that are
affected by one or more of these anomalies will have a
relevant flag value of "1". Scans with flag values of "0"
are not affected. Use caution when utilizing
source and image data from any scan in which the quality anomaly flags
listed in Table 1 have a value of "1". There may
be data from alternative scans of the same regions of sky available
in the All-Sky Catalogs or Survey Reject Tables. No anomalies
are identified among the 6x scans.
Table 1 - Quality Anomaly Flags in the Survey Scan Information Table
| Flag | Meaning |
| cld | Clouds may affect data from a small portion of scan |
|---|
| xph | Non-cloud related photometric anomaly in scan |
|---|
| anom | Unusual problem found in
Atlas Images such as residual
meteor trails, satellite trails, insect trails, and unusual reflections or
glints from bright stars. Examples of these are shown in the gallery of
Image Anomalies. |
|---|
| hgl | Elevated "noise-glitch" may affect one or more J or H band images in scan |
|---|
Calibration Scan Image Atlas and WDBs
Because the principal objective of the 2MASS calibration observations was to
derive photometric zero point and atmospheric stability information
during each night of survey operations, they were not subject to
the same rigorous quality assessment as the
main survey scans.
In particular, calibration scan data were not required to meet the
sensitivity thresholds required for the main
survey, or to be free from astrometric
errors as long as standard stars could be identified and their photometry
extracted. Calibration scans were assigned a
binary quality score (10 or 0 = pass
or fail) that was based only on their photometric quality.
A passing score of 10 was assigned to scans in which standard stars could
be unambiguously identified, photometric zero points could be derived, and
that were part of a six-scan calibration observation that was made under
photometric conditions.
Data from scans receiving a passing score were loaded into the calibration
scan Atlas Image archive and WDBs.
However, these products may contain other anomalies that were not
identified during the quality assurance process.
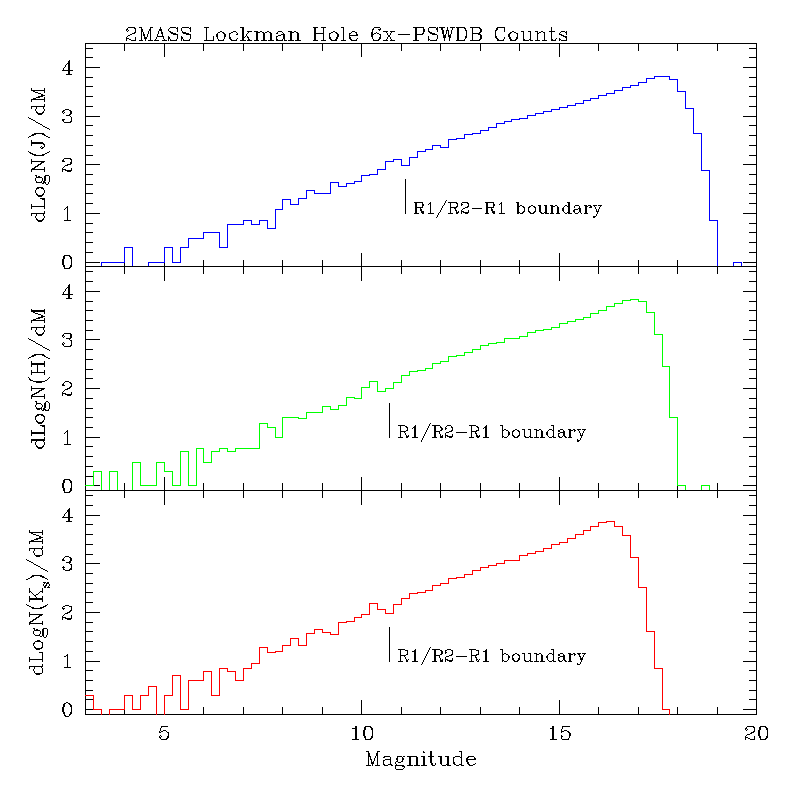
vi. The 6x READ1/READ2-READ1 Sensitivity Gap
Photometry for bright sources that saturate
the 6x 7.8 s READ2 exposures
(rd_flg="1") should be obtained from the 2MASS All-Sky PSC.
In addition, photometry for any point source with high SNR measurements
in the All-Sky Catalogs should take precedence over the 6x measurements
because they have received a greater level of review and validation
For the 6x observations, the READ2
integration time
was increased from 1.3 s to 7.8 s, but the
READ1 integration time remained
at 51 ms, the same as in the main survey
(see A3.4.a).
The brightest unsaturated sources in the main survey's 1.3 s READ2-READ1
images were also detectable as the faintest sources in the 51 ms READ1
frames. This photometric overlap was essential for providing contiguous
and internally consistent magnitude coverage across the dynamic range
of the survey. The 6x observations do not necessarily have overlapping
READ1 and READ2-READ1 photometry because of the increased READ2 integration
time. Thus, many saturated sources in the 6x READ2-READ1 exposures
are too faint to be detected in the 51 ms READ1 frames, or are detected
only at very low SNR levels.
The resulting incompleteness and/or faint
detections in the 8-11 mag READ1/READ2-READ1 boundary introduces
artificial features in source counts and color-magnitude diagrams
as illustrated in Figures 7 and 8. Small discontinuities
in the differential 6x Lockman Hole field point source counts (Figure 7)
near 10.5-11 mag are caused by the incompleteness and systematic flux
overestimation of low SNR measurements in the READ1 exposures.
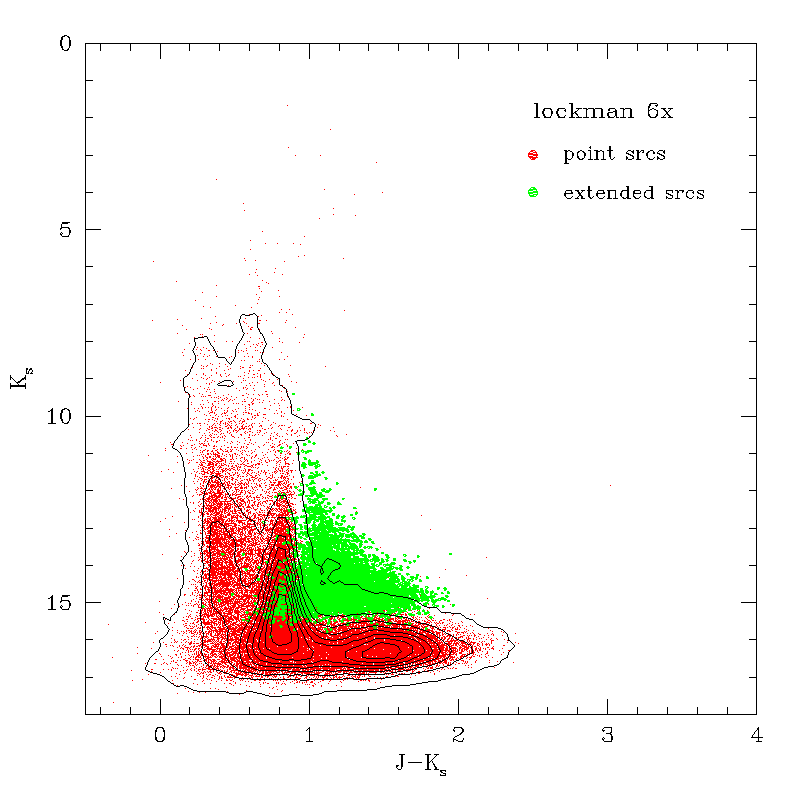
The same effects cause the horizontal discontinuity of points
near Ks=10.5 mag in the 6x color-magnitude diagram
from the same field shown in Figure 8.
The 2MASS 6x data primarily exist to report the faint extension
of the original survey results provided by the 6x increase in READ2
exposure time. Photometry of the brighter
51 ms READ1 extractions are included in the 6x Catalogs given their
utility for variability and proper motion studies.
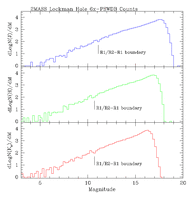 |
 |
| Figure 7 - Differential point source counts from the 6x Lockman Hole
observations showing the discontinuities at the READ1/READ2-READ1
boundaries. |
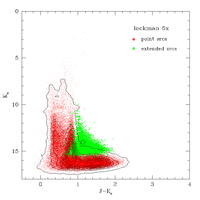
Figure 8 - Color-magnitude diagram for point (red) and extended
source (green) extractions 6x WDBs in the Lockman Hole field.
The black contours trace the density of point sources. The horizontal
discontinuity near Ks=10.5 mag is at the
READ1/READ2-READ1 sensitivity boundary.
|
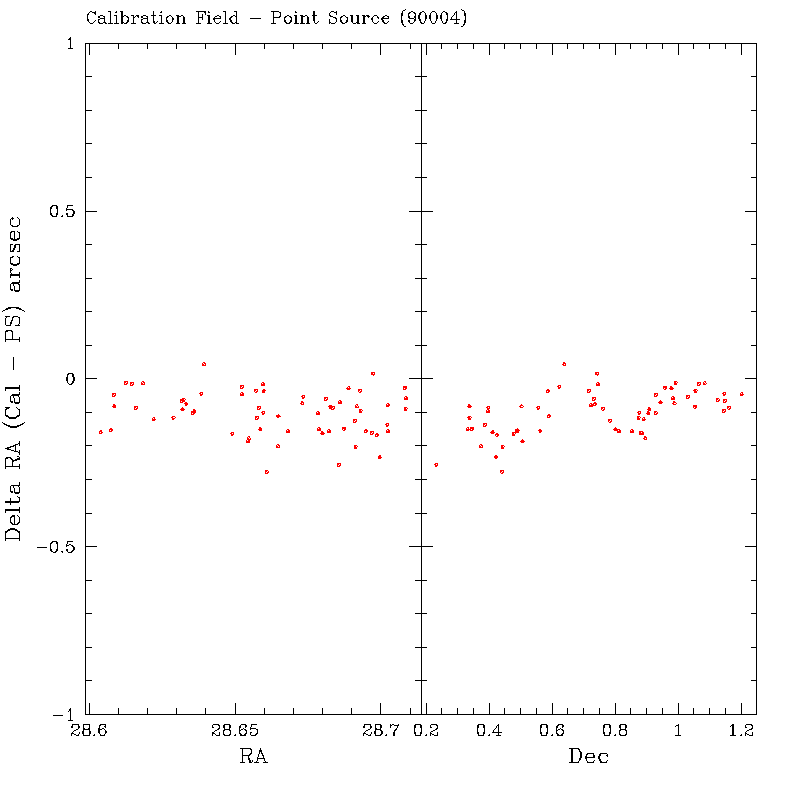
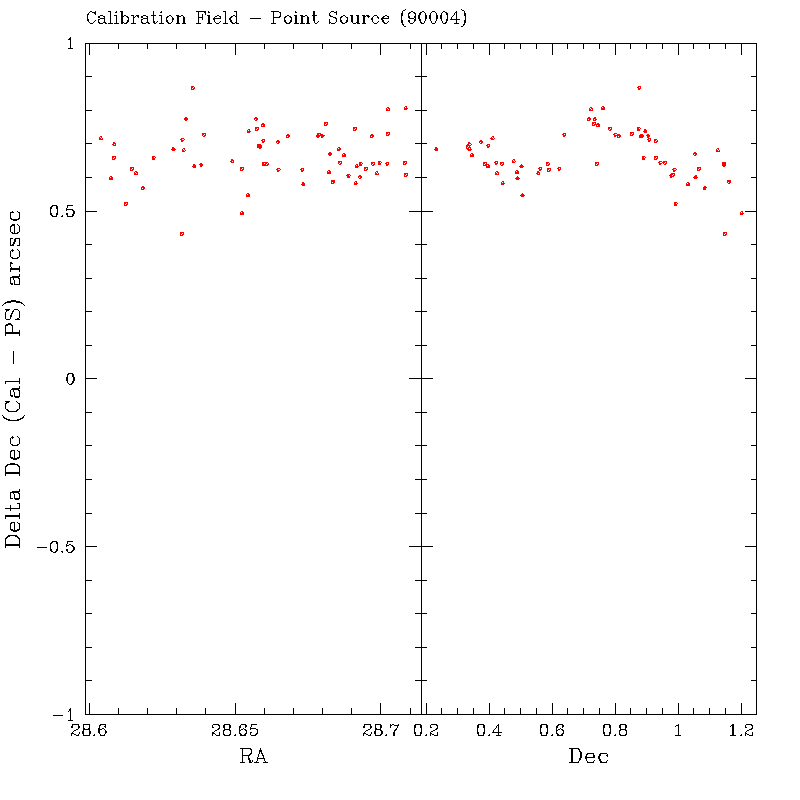
vii. Astrometric Biases in the Calibration Scan Data Products
2MASS calibration scan images and source positions
have systematic biases of up to ~0.6" with respect to the 2MASS All-Sky PSC
and XSC.
Position reconstruction for the calibration scan observations
(A4.4.b) used the
USNO-A2.0
as the primary astrometric reference catalog, rather than the
Tycho-2 Catalog
that was used as the reference for the main survey.
Because of small systematic astrometric differences
between USNO-A2.0 and Tycho-2, the reconstructed astrometry
of 2MASS Calibration scan data products exhibit residual
biases of up to ~0.6" with respect to the 2MASS main survey
images and source positions.
These astrometric biases are position-dependent within
calibration scans, and they differ in amplitude and structure
between calibration fields. However, they are consistent
among all scans of a given calibration field.
The average offsets with respect to the main survey have been computed
for each calibration field using the Merged
Calibration Point Source Database and
are shown in A4.2. The largest biases
are found in the 90004 calibration field, which has
an offset relative to the All-Sky PSC of approximately 0.6" in declination
as shown in Figures 9 and 10.
Source positions in the All-Sky PSC and XSC and Survey PSRT and XSRT
are more accurate relative to the J2000 reference frame than those
in the calibration WDBs, and should be be used wherever possible.
However, the internal consistency of the position reconstruction
within scans of individual calibration fields is excellent.
This consistency, combined with the large number of independent
scans of the calibration fields, make the Cal-PSWDB a resource for
measuring source very small-scale motions.
 |
 |
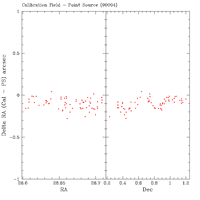
| Figure 9 - Mean RA offset between Calibration Scan and All-Sky PSC
positions for stars in the 90004 Calibration Tile, plotted as a function
of RA and Declination within the Tile. |
Figure 10 - Mean Declination offset between Calibration Scan and All-Sky PSC
measurements for stars in the 90004 Calibration Tile, plotted as a function
of RA and Declination within the Tile. |
[Last Updated: 2006 December 20; by R. Cutri]
Previous page Next page.
Return to Explanatory Supplement TOC Page.
