 The Two Micron All Sky Survey at IPAC
![]()
|
The Two Micron All Sky Survey at IPAC
|
|
|
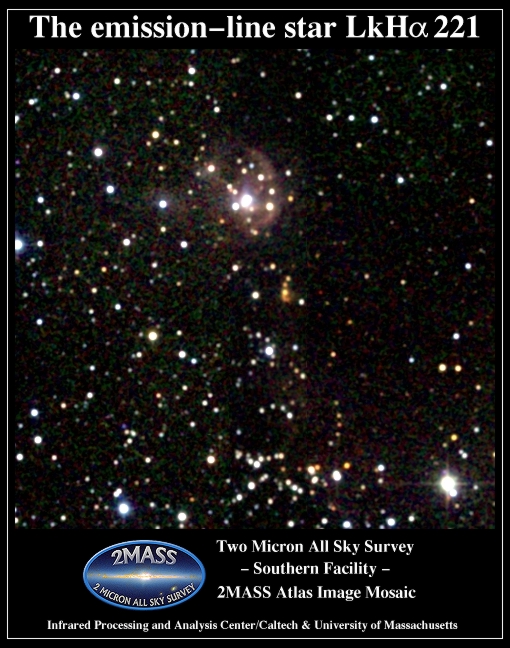
"The Embedded Star Clusters in the Nebulae NGC 2327 and BRC 27 in Canis Majoris R1"
J. B. Soares & E. Bica, 2002, A&A, 388, 172
|
Soares & Bica used the 2MASS Point Source Catalog from
the Second Incremental
Data Release to study the stellar
clusters embedded in the nebulae NGC 2327 and bright-rimmed cloud (BRC) 27 in
the Canis Majoris R1
molecular cloud (at left).
The resulting JHKs color-color and color-magnitude
diagrams for these two clusters are shown below.
The emission-line star LkH 221 (filled square) is the brightest object within NGC 2327.
Several studies have analyzed
this star, but none before this one had focused on
a related surrounding star cluster or stellar group.
These clusters contain
objects that are still forming, and theoretical isochrones for main sequence
stars (dashed line) alone are inadequate. For this reason,
the authors employed
2MASS photometry for a known cluster in likely a similar phase of evolution,
the Trapezium cluster in Orion (open colored diamonds,
solid line),
as a template for
comparison. From this, the authors derive fundamental properties for these
two clusters (filled circles): Both clusters are at a distance of
1.2 kpc; the mean visual extinction toward NGC 2327 is AV=5.5 mag,
while toward BRC 27, it is AV=6.5 mag; and, both clusters are coeval
and quite young, with ages of about 1.5 Myr.
221 (filled square) is the brightest object within NGC 2327.
Several studies have analyzed
this star, but none before this one had focused on
a related surrounding star cluster or stellar group.
These clusters contain
objects that are still forming, and theoretical isochrones for main sequence
stars (dashed line) alone are inadequate. For this reason,
the authors employed
2MASS photometry for a known cluster in likely a similar phase of evolution,
the Trapezium cluster in Orion (open colored diamonds,
solid line),
as a template for
comparison. From this, the authors derive fundamental properties for these
two clusters (filled circles): Both clusters are at a distance of
1.2 kpc; the mean visual extinction toward NGC 2327 is AV=5.5 mag,
while toward BRC 27, it is AV=6.5 mag; and, both clusters are coeval
and quite young, with ages of about 1.5 Myr.
2MASS is ideal for studying the embedded stellar content in molecular clouds. Detailed analysis of the Point Source Catalog sources reveals very young objects in the pre-main-sequence stage and enables detections of Ks excesses, which originate in dust disks or envelopes of contracting objects. |
| Three-color JHKs composite 2MASS Atlas Image mosaic |
| NGC 2327 | |
| 
|
| Color-color diagram | Color-magnitude diagram |
| BRC 27 | |
| 
|
| Color-color diagram | Color-magnitude diagram |
Original figures ©The European Southern Observatory (ESO)
To find and read other interesting papers using 2MASS data, go to the 2MASS Publications page
Return to the 2MASS Home Page