i. Duplicate Source Extraction
Extended sources were selected from the overlap regions between scans in the Second Incremental Release version of the Extended Source Catalog Working Survey database. Matching pairs of objects were identified by S. Wheelock, and a file generated for each scan, including internal source numbers, coordinates, and default magnitudes and differences. The internal source numbers were matched against the full survey database to extract additional information about each source. We have restricted the analysis to sources where both measurements were made more than 30´´ from the edge of a scan, in order to avoid differences due to galaxies being cut-off on one scan. All measurements are reported in the sense (measurement farther from edge)-(measurement closer to edge), unless otherwise indicated. This list included 31442 independent pairs of measurements.
Highlights of what has been found are: There is an excess of extended sources in the LMC fields [subsection II]; coordinates are accurate to about 0.5´´ [subsection III]; southern photometry is worse than northern [subsection IV]; the photometry shows no drift with time [subsection V];; and, is something funny going on around Dec = +18°? [subsection VI].
ii. Distribution of Sources
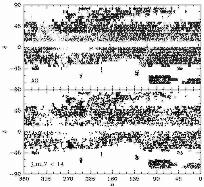
The upper panel of Figure 1 shows the
positions of all of the duplicate sources in the Second Incremental Release.
Note the striping at 6° intervals because of the north-south overlap
between tiles. The density of sources remains relatively
constant despite the map projection because of the larger amount of overlap
near the poles.
The lower panel shows the
positions of sources with good galaxy scores (g_score<1.4) and
7´´ aperture J magnitudes brighter than 14.
The Zone of Avoidance is visible in both panels, and note
that false sources in the Galactic center show up strongly even in
the g_score-selected plot. Another peculiarity appears to be a high
density of sources in the direction of the Large Magellanic Cloud (LMC),
although this would be better studied with the full database statistics.
 |
| Figure 1 |
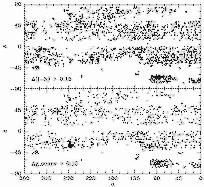
The two panels of Figure 2 show "difference maps," to identify possible regions where large numbers of sources show discrepancies in the overlap measurements. The differences are subtle, and these maps are representative of the most "extreme" amount of structure visible among the quantities we examined. (It would be useful to normalize these plots by the local number density, but for now one has to do it by eye.)
 |
| Figure 2 |
The upper panel shows sources brighter than j_7=14.5 with large color variations (color determined within 7´´ aperture). Interestingly, the Galactic center sources do not show up, but the LMC sources do. The increase in color-discrepant sources in the LMC may be part of what appears to be a region-wide increase between 0° and 90°. This is partly due to the higher density of overlap sources in these regions, but it appears also to reflect a north-south difference: the fraction of all sources with discrepant (j-h) magnitudes is 6.8% in the north, and 9.0% in the south.
Sources brighter than j_7=14.5 with large differences in g_scores are shown in the bottom panel. The Zone of Avoidance, Galactic center, and LMC regions show high counts. This is to be expected, since false sources and nebulae have less well-defined shapes, so GALWORKS (see IV.5) is likely to give different scores.
iii. Astrometry
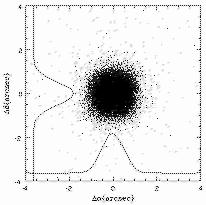
Figure 3 shows the distribution of
RA and Dec differences. The two line plots
show the cumulative distribution of differences in each coordinate.
The mean and rms in each coordinate are:
RA: -0.00975´´ ± 0.54459´´
Dec: -0.00205´´ ± 0.55982´´
Recall that the standard deviations here represent a pair of measurements,
so each coordinate is accurate to about 0.39´´.
While these coordinates are not as good as for point sources, they
are excellent for galaxies, and about as accurate as could be hoped
given our method, which uses the coordinate of the brightest pixel as
the center.
The distributions are nearly Gaussian. Fitting a Gaussian to the central
±3 standard deviations (
 = 0.51), there is
an excess of 575 (1.8% of 31442) sources in the wings of the distribution.
 |
| Figure 3 |
iv. Photometry
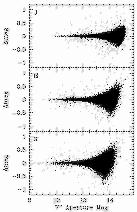
Figure 4 shows the distribution of
7´´ aperture magnitude differences
as a function of the magnitude for each of the three bands. The distribution
of isophotal aperture magnitude differences looks the same, but "fuzzier."
Since the density of points is so high, the plot is mainly useful for
identifying the envelope of the distribution and outliers. Note that
the asymmetric shape at the faint end of this diagram results from
plotting the difference (mag1-mag2) vs. (mag1).
 |
| Figure 4 |
The statistics for these results are subdivided into four magnitude ranges:
Only the statistics for
galaxies (Catalog g_score<1.4) are listed, and the following has
been limited to high Galactic latitude (|b|>30°) and excludes the
LMC region to reduce confusion. (Leaving these regions in substantially
increased the rms of the differences.)
The sample has also been split into the northern and southern subsamples,
to show any differences in the photometry:
 Magnitude Range      N     mean    rms        N     mean    rms
                      Isophotal Aperture       Fixed 7" Aperture
NORTH:
        j_m < 14.0  2285  -0.0089  0.0868    2056   0.0001  0.0536
14.0 <= j_m < 14.5  2081  -0.0106  0.1106    2366  -0.0088  0.0823
14.5 <= j_m < 15.0  4333  -0.0054  0.1257    4557  -0.0025  0.1126
15.0 <= j_m         1086   0.0745  0.1121     809   0.0775  0.0962

        h_m < 13.2  2021  -0.0100  0.0923    1794  -0.0008  0.0510
13.2 <= h_m < 13.7  1802  -0.0143  0.1190    2047  -0.0099  0.0933
13.7 <= h_m < 14.2  3861  -0.0213  0.1478    4070  -0.0228  0.1439
14.2 <= h_m         2101   0.0581  0.1774    1877   0.0664  0.1771

        k_m < 12.5  1349  -0.0164  0.1006    1010  -0.0038  0.0590
12.5 <= k_m < 13.0  1258  -0.0252  0.1446    1371  -0.0112  0.0796
13.0 <= k_m < 13.5  2833  -0.0256  0.1650    3131  -0.0240  0.1312
13.5 <= k_m         4342   0.0233  0.1943    4277   0.0185  0.1828

SOUTH:
        j_m < 14.0  1644  -0.0067  0.1084    1475   0.0020  0.0630
14.0 <= j_m < 14.5  1745  -0.0066  0.1202    1983  -0.0060  0.0907
14.5 <= j_m < 15.0  3550  -0.0032  0.1326    3667  -0.0011  0.1208
15.0 <= j_m          861   0.0880  0.1312     676   0.0849  0.1010

        h_m < 13.2  1428  -0.0136  0.1082    1260  -0.0058  0.0635
13.2 <= h_m < 13.7  1584  -0.0174  0.1343    1759  -0.0164  0.1064
13.7 <= h_m < 14.2  3110  -0.0202  0.1564    3313  -0.0227  0.1542
14.2 <= h_m         1676   0.0749  0.1913    1470   0.0858  0.1909

        k_m < 12.5   939  -0.0166  0.1212     712  -0.0015  0.0589
12.5 <= k_m < 13.0  1020  -0.0260  0.1648    1076  -0.0104  0.0958
13.0 <= k_m < 13.5  2346  -0.0307  0.1842    2597  -0.0341  0.1489
13.5 <= k_m         3492   0.0324  0.2175    3417   0.0301  0.2071
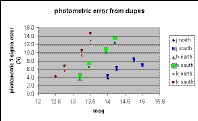
The rms data are also displayed in Figure 5. Again, recall that the rms is for a pair of independent measurements, so the rms for a single measurement should be sqrt(2) smaller. It seems clear from these values that the rms of the southern measurements are about 0.01-0.02 mag worse than the northern measurements in virtually every category.
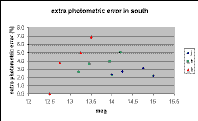
The north-south differences are not caused by outliers; clipping outside four times the rms reduced the rms values by at most a few thousandths. Assuming the errors added quadratically, the additional photometric error in the south is shown in Figure 6.
|
 |
| Figure 5 | Figure 6 |
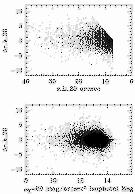
Figure 7 shows how the isophotal aperture size measurement varies as a function of aperture size and Ks-band magnitude. The r_k_20 axis is plotted backward to make it easier to compare to the figures relative to magnitude.
As was done in the previous subsection, the data are limited to |b|>30° and sources with good g_scores. The table below presents the standard deviations of the radius measurement differences as a fraction of the cataloged size:
(r_k_20(cat)-r_k_20(dup))/r_k_20(cat)
for several intervals of the Ks-band magnitude and as a function of the size itself.
 |
| Figure 7 |
 Magnitude Range      N     mean    rms

        k_20 < 12.5  2288   0.0060  0.1432
12.5 <= k_20 < 13.0  2278   0.0046  0.1612
13.0 <= k_20 < 13.5  5179  -0.0062  0.1444
13.5 <= k_20         7834  -0.0149  0.1053

60 >= r_k_20 > 15     918   0.0293  0.1281
15 >= r_k_20 > 10    2335   0.0573  0.1602
10 >= r_k_20 > 7     5971   0.0031  0.1409
 7 >= r_k_20         8231  -0.0288  0.0748
The table show that almost galaxies of almost any size or brightness have an rms difference of about 14% in their measured isophotal radius at Ks. This corresponds to about a 10% uncertainty for each measurement, and about 20% in area. Fortunately for the photometry, the light of galaxies are centrally concentrated, so the uncertainty in the magnitudes is not as large.
v. Time Variability
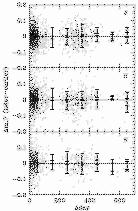
Figure 8 examines how aperture magnitude
measurement differences have changed as a function of the date difference
between the two measurements. The points show the (later minus earlier)
magnitude measurements only for bright galaxies (first row in the table above).
The full extent of the error bars show the range of ±1 standard
deviation for all the measurements made in intervals of 100 days. The smaller
range shown within each error bar is the ±1
Expanding the sample to include fainter sources increases the number of
comparison measurements, but does not provide as tight of constraints
on the error of the mean.
 for the error of the mean.
There is no significant drift in the mean or standard deviation as the time
between measurements increases, although beyond about 450 days, there are
obviously too few measurements to draw strong conclusions.
 |
| Figure 8 |
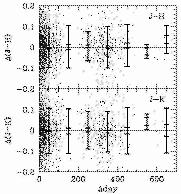
Figure 9 is the corresponding one for color changes within the central 7´´ aperture. The data are limited to sources at high Galactic latitude, outside the LMC, with good g_scores, and in this case, sources are also selected requiring that the 7´´ J magnitude is consistent to better than 0.1 mag between the two measurements. This last requirement will constrain the possible colors somewhat, but it eliminates many potentially problematic sources.
The mean color changes in both cases do not show significant deviations from
zero (reduced  2 of 1.025 and 1.118 for
J-H and J-Ks, respectively).
 |
| Figure 9 |
No quantities appeared to have any substantial declination dependence, although the magnitude differences did exhibit the larger standard deviation in the south discussed earlier.
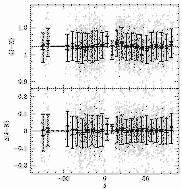
The upper panel in Figure 10 shows how the (J-Ks) color inside a 7´´ aperture varies in each of the 6° declination bands. The points are again restricted to sources that are bright (j_7 < 14), unconfused (|b|>30°, outside the LMC region), with good g_scores (<1.4).
The mean galaxy color shows a very consistent standard deviation,
although the mean wanders around slightly.
A  2 test suggests
there is a little more deviation from the error of the mean than
expected (reduced
  2 = 2.37). Most of the
excess
  2 comes
from the +15° and +21° declination bands, each with a
 2 value of about 11.
In the lower figure panel, the differences between source colors and their overlap values show the larger uncertainties in the magnitude measurements for the southern data.
 |
| Figure 10 |
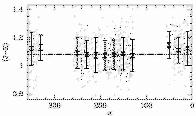
The deviation of the colors within the +15° and +21° bands appears to come mostly from sources in one part of the sky, generally around RA = 0h. Figure 11 shows the deviation from the global mean color (horizontal line) as a function of RA for sources in these two declination bands. The sources have been restricted as above, except that the magnitude has been relaxed to increase the numbers (j_7<14.5). To insure the quality of the measurements they are required to have reasonable agreement between the two measurements, i.e., (J-Ks) consistent to within 0.2 mag. The reason for the discrepancy is not obvious. If it is not due to problems during the start-up of the Survey, it could be astrophysically interesting.
 |
| Figure 11 |
[Last Updated: 2000 Jan 4 by S. Schneider. Modified 2000 Jul 21 by S. Van Dyk.]