VI. Analysis of the 2MASS Second Incremental Release Catalogs
2. Global Photometric Properties
c. Photometric and Astrometric Accuracy Using Tile Overlaps
S. Wheelock generated information on sources seen in the overlap regions of
the 25,545 scan pairs in the Second Incremental Data Release.
The files she created included
position and magnitude differences for each source identified as having a
match in the overlap zone. We generated summary statistics for each file,
including means and  for all sources seen in each scan pair (clipping magnitude
differences greater than 1 mag as unreliable). We evaluated these statistics
for all stars at a limit where the signal-to-noise ratio should be very good
(J,H,Ks=13,12.5,12 mag). We excluded sources brighter than 8 mag to avoid
contamination with very bright objects. The average number of high quality
sources in an overlap region is 115, with a low of 7 and a high of over 5000.
The total number of sources considered here is 3,415,987. The statistics per
scan-pair should give a good measure of the positional and magnitude
repeatability of the sources seen in those scans.
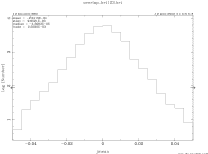
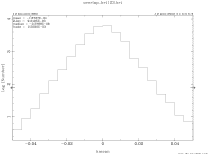
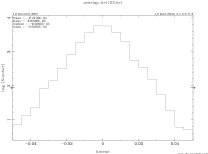
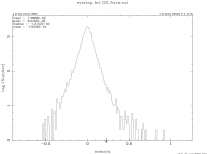
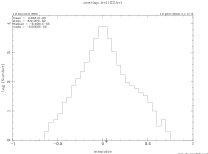
Table 1 and the figures below provide an overview of the quality of the
released data. Figures 1 and
2 show histograms of the scan-to-scan
offsets in RA and Dec, respectively, while Figures
3,
4, and
5
show histograms of the scan-to-scan offsets in
J, H, and Ks, respectively. The very low values of the dispersions
around zero offset (<~0.1´´ and <0.01 mag) is a testimony to
the quality of the individual measurements and to their overall uniformity.
|
Table 1. Overlap Statistics |
|
Quantity |
Value |
|
 (RA1-RA2)
|
0.090" |
|
 (DEC1-DEC2)
|
0.089" |
|
 (J1-J2)
|
0.0096 mag |
|
 (H1-H2)
|
0.0094 mag |
|
 (K1-K2)
|
0.0096 mag |
|
 |
| Figure 1 | Figure 2 |
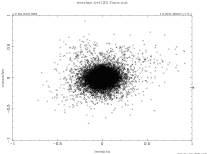
Figure 6 shows the
dispersions in RA and Dec plotted against each other. We found only one scan
with RA offsets greater than 1´´. Scans with offsets greater than
0.75´´ in either RA or DEC are shown in Table 2 (below).
Most are scans with problems in RA and
all are scans with relatively few stars.
 |
| Figure 6 |
|
Table 2. Scans with RA/DEC Offsets > 0.75"
|
| Scan |
Number |
RA |
DEC |
DRA |
 pop RA pop RA |
 mean RA mean RA |
DDEC |
 pop Dec pop Dec |
 mean Dec mean Dec |
| out2_980502n9 |
11 |
178.82 |
16.12 |
1.081 |
0.242 |
0.073 |
0.214 |
0.135 |
0.041 |
| out2_980301n106 |
>7 |
174.76 |
27.13 |
0.916 |
0.137 |
0.052 |
0.419 |
0.242 |
0.091 |
| out3_981201n145 |
14 |
160.99 |
25.35 |
0.752 |
0.237 |
0.063 |
0.244 |
0.315 |
0.084 |
| out3_981227s93 |
17 |
152.57 |
-2.84 |
0.821 |
0.640 |
0.155 |
0.164 |
0.237 |
0.057 |
| out3_990120s115 |
15 |
175.79 |
-3.52 |
0.827 |
0.498 |
0.129 |
0.496 |
0.251 |
0.065 |
| out3_990120s90 |
18 |
174.20 |
-3.53 |
0.813 |
0.216 |
0.051 |
0.459 |
0.157 |
0.037 |
| out3_990124s115 |
16 |
193.49 |
-3.78 |
0.824 |
0.228 |
0.057 |
0.375 |
0.199 |
0.050 |
| out3_990126s87 |
14 |
176.39 |
-3.30 |
0.918 |
0.159 |
0.043 |
0.230 |
0.132 |
0.035 |
| out3_990216s96 |
18 |
191.63 |
-8.32 |
0.908 |
0.612 |
0.144 |
0.437 |
0.191 |
0.045 |
| out3_990219s113 |
17 |
225.50 |
-2.89 |
0.830 |
0.482 |
0.117 |
0.203 |
0.278 |
0.067 |
| out3_990221n115 |
9 |
217.25 |
26.10 |
-0.193 |
0.110 |
0.037 |
0.910 |
0.401 |
0.134 |
| out3_990518n15 |
8 |
197.19 |
27.50 |
0.845 |
0.202 |
0.072 |
0.108 |
0.116 |
0.041 |
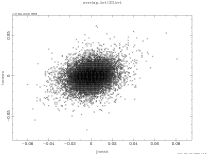
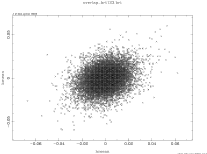
Figures 7 and
8 show
dispersions in J vs. H and H vs. Ks. Common mode problems
indicative of calibration problems can be seen for a few scans. Scans with
photometric offsets greater than 0.04 mag in two or more bands are listed in
Table 3.
These scan pairs may have problems with their overall calibration and may need
to be rescanned. Finally, we list scans in Table 4 with offsets greater
0.04 mag at
> 3 significance in any one band. These scans
might have PSF or other problems in one scan.
|
|
| Figure 7 | Figure 8 |
|
Table 3. Scans with Correlated Photometric Offsets > 0.04 |
|
File |
Number |
RA |
Dec |
Mean
J |
Sigma
Pop
J |
Sigma
Mean
J |
Mean
H |
Sigma
Pop
H |
Sigma
Mean
H |
Mean
K |
Sigma
Pop
K |
Sigma
Mean
K |
|
out_970608n51 |
21 |
248.00 |
20.81 |
-0.055 |
0.022 |
0.005 |
-0.041 |
0.025 |
0.006 |
-0.049 |
0.035 |
0.008 |
|
Out_970614n19 |
17 |
223.64 |
20.85 |
0.049 |
0.031 |
0.007 |
0.043 |
0.032 |
0.008 |
0.053 |
0.039 |
0.009 |
|
Out2_980115n93 |
12 |
190.97 |
15.10 |
0.043 |
0.071 |
0.021 |
0.047 |
0.061 |
0.017 |
0.056 |
0.046 |
0.013 |
|
Out2_980302n80 |
11 |
166.61 |
26.14 |
0.022 |
0.040 |
0.012 |
0.048 |
0.070 |
0.021 |
0.048 |
0.068 |
0.020 |
|
Out3_980705s45 |
5125 |
271.63 |
-27.00 |
0.053 |
0.072 |
0.001 |
0.046 |
0.094 |
0.001 |
0.033 |
0.083 |
0.001 |
|
Out3_990331n35 |
7 |
144.37 |
16.16 |
0.035 |
0.025 |
0.009 |
0.044 |
0.036 |
0.013 |
0.042 |
0.023 |
0.009 |
|
Out2_971119n118 |
131 |
75.21 |
27.35 |
0.071 |
0.045 |
0.004 |
0.053 |
0.039 |
0.003 |
0.060 |
0.042 |
0.004 |
|
out2_980319s142 |
5250 |
271.50 |
-27.35 |
-0.053 |
0.078 |
0.001 |
-0.055 |
0.094 |
0.001 |
-0.043 |
0.082 |
0.001 |
|
Table 4. Scans with single Band Offsets > 0.04 mag |
|
J |
out_970614n80 |
H |
out_970614n19 |
K |
out_970614n19 |
|
J |
out_970614n19 |
H |
out_970608n51 |
K |
out_970608n51 |
|
J |
out_970609n79 |
H |
out2_980516n28 |
K |
out_970608n28 |
|
J |
out_970609n43 |
H |
out2_980425s64 |
K |
out2_980530s77 |
|
J |
out_970608n51 |
H |
out2_980319s142 |
K |
out2_980418s63 |
|
J |
out_970608n28 |
H |
out2_980319s136 |
K |
out2_980406s28 |
|
J |
out2_980530s77 |
H |
out2_980301n105 |
K |
out2_980401s103 |
|
J |
out2_980515s66 |
H |
out2_971217n123 |
K |
out2_980331n79 |
|
J |
out2_980511n35 |
H |
out2_971119n118 |
K |
out2_980319s142 |
|
J |
out2_980508n36 |
H |
out3_980705s45 |
K |
out2_980115n93 |
|
J |
out2_980505n51 |
H |
out3_980719s152 |
K |
out2_980109n156 |
|
J |
out2_980412n12 |
H |
out3_980727s120 |
K |
out2_980106n39 |
|
J |
out2_980406s41 |
H |
out3_980814s23 |
K |
out2_971129n138 |
|
J |
out2_980328s101 |
H |
out3_980814s24 |
K |
out2_971119n118 |
|
J |
out2_980319s142 |
H |
out3_980814s25 |
K |
out3_980705s36 |
|
J |
out2_980311n104 |
H |
out3_980814s7 |
K |
out3_980716s144 |
|
J |
out2_980302n77 |
H |
out3_980916s89 |
K |
out3_980716s79 |
|
J |
out2_980130n77 |
H |
out3_981002s39 |
K |
out3_980804s67 |
|
J |
out2_980128n95 |
H |
out3_981030s14 |
K |
out3_980815s108 |
|
J |
out2_980120n27 |
H |
out3_981101s21 |
K |
out3_980815s42 |
|
J |
out2_980113n11 |
H |
out3_981212s13 |
K |
out3_980828s119 |
|
J |
out2_980112n26 |
H |
out3_990207n142 |
K |
out3_980916s96 |
|
J |
out2_980108n24 |
H |
out3_990310n77 |
K |
out3_990216s94 |
|
J |
out2_980107n70 |
H |
out3_990311n56 |
K |
out3_990216s95 |
|
J |
out2_980107n29 |
H |
out3_990323n126 |
K |
out3_990331n35 |
|
J |
out2_980106n27 |
H |
out3_990324n91 |
K |
out3_990512n32 |
|
J |
out2_971119n118 |
H |
out3_990331n35 |
K |
out3_990512n49 |
|
J |
out3_980624s119 |
|
|
|
|
|
J |
out3_980705s45 |
|
|
|
|
|
J |
out3_980707s48 |
|
|
|
|
|
J |
out3_980918s70 |
|
|
|
|
|
J |
out3_981014s63 |
|
|
|
|
|
J |
out3_981019n14 |
|
|
|
|
|
J |
out3_981112s35 |
|
|
|
|
|
J |
out3_981113n92 |
|
|
|
|
|
J |
out3_981118n41 |
|
|
|
|
|
J |
out3_981201s107 |
|
|
|
|
|
J |
out3_981213s14 |
|
|
|
|
|
J |
out3_981222s112 |
|
|
|
|
|
J |
out3_990127s85 |
|
|
|
|
|
J |
out3_990130s102 |
|
|
|
|
|
J |
out3_990210s98 |
|
|
|
|
|
J |
out3_990306n59 |
|
|
|
|
|
J |
out3_990310n56 |
|
|
|
|
|
J |
out3_990313n138 |
|
|
|
|
|
J |
out3_990313n139 |
|
|
|
|
|
J |
out3_990321n112 |
|
|
|
|
|
J |
out3_990321n113 |
|
|
|
|
|
J |
out3_990331n31 |
|
|
|
|
|
J |
out3_990331n42 |
|
|
|
|
|
J |
out3_990425n20 |
|
|
|
|
|
J |
out3_990426n36 |
|
|
|
|
|
J |
out3_990506n49 |
|
|
|
|
|
J |
out3_990510n30 |
|
|
|
|
[Last Updated: 2000 Jan 24 by C.A. Beichman.
Modified 2000 Jul 21 by S. Van Dyk.]
Previous page. Next page.
Return to Explanatory Supplement TOC Page.
 for all sources seen in each scan pair (clipping magnitude
differences greater than 1 mag as unreliable). We evaluated these statistics
for all stars at a limit where the signal-to-noise ratio should be very good
(J,H,Ks=13,12.5,12 mag). We excluded sources brighter than 8 mag to avoid
contamination with very bright objects. The average number of high quality
sources in an overlap region is 115, with a low of 7 and a high of over 5000.
The total number of sources considered here is 3,415,987. The statistics per
scan-pair should give a good measure of the positional and magnitude
repeatability of the sources seen in those scans.

