SW1 LW1
SW2 LW2
SW3 LW3
SW4 LW4
SW5 LW5
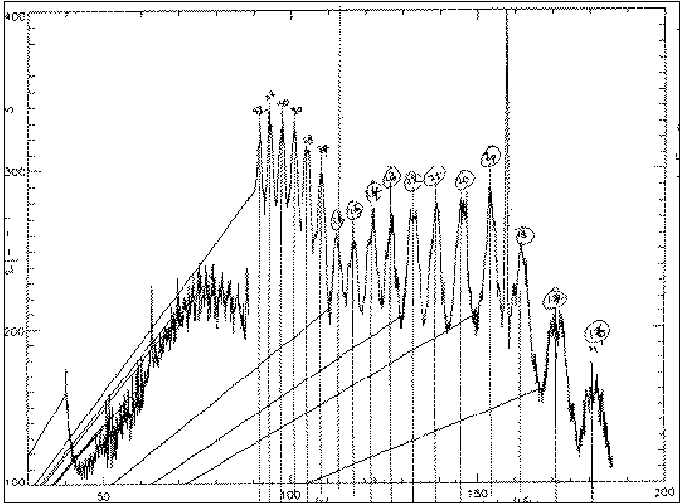
This source has a strong continuum and the zero point is surpressed on the (unreadable) y-axis of these plots, with only the top 20% or 30% of the emission plotted. The [OI] 63 um line can be see on a ripple peak in SW3 while the [CII] 158 um line is in a trough in LW4.

Steve Lord -- lord@heaven.ipac.caltech.edu INFRARED PROCESSING AND ANALYSIS CENTER