VI. Analysis of the 2MASS Second Incremental Release Catalogs
7. Comparison to External Catalogs and Models
g. Number Of Galaxies Versus Galactic Latitude
This analysis examines how the number of galaxies per square degree varies
with galactic latitude, and also presents figures showing the brighter
galaxies in the Extended Source Catalog (XSC).
We selected all sources in the XSC with g_score  1.4 and binned them vs. magnitude and galactic
latitude. We use the k_m_7 magnitude. We normalized the counts by the
number of Atlas Images in the same bins of glat. We used an
"overlap-removed" area of 0.0332 square degrees per Atlas Image to convert to
galaxies per square degree.
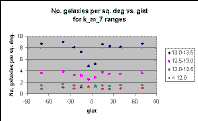
In Figure 1 the raw numbers show clearly
the incompleteness of the fainter magnitude bins
at low galactic latitudes.
The incompleteness below |glat| ~ 10° is strong for the 13.0-13.5
mag bin, noticeable for the 12.5-13.0 mag bin, and nearly vanishes for
galaxies brighter than 12.5 mag.
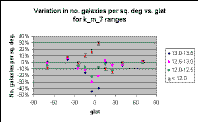
This variation can be quantified by computing the variation from the mean
density above 30° in Figure 2.
The bin 12.0-12.5 mag is underdense only for the glat -10° to
0° bin, with a normal density for the glat 0° to 10° bin.
Sources brighter than 12.0 mag show an overdensity below |glat|=10°,
due to galactic sources masquerading as external galaxies.
|
|
| Figure 1 | Figure 2 |
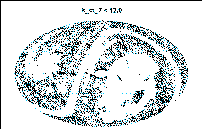
In Figure 3 we have plotted all galaxies
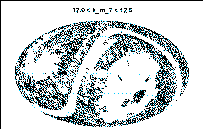
brighter than 12.0 mag, and in Figure 4,
all galaxies with 12.0 < k_m_7 < 12.5 mag. It is instructive to "blink"
between those two figures.
Figure 3 shows that the overdensity of bright "galaxies" comes from
sources within glon ±60° glat and ±10°.
Figure 4 shows that the galaxy catalog is probably incomplete for 12.0-12.5
mag only within glat ~±10° and glon of
~±60°.
|
|
| Figure 3 | Figure 4 |
| k_m_7<12.0 | 12.0<k_m_7<12.5 |
Except for that small region, it is not immediately clear that the galaxy
catalog is incomplete in the Galactic plane in either plot. The clumps of
sources at glon ±90° in the Galactic plane look much like the
clumps away from the plane. Hence the underdensity for glat -10°
to 0° could simply reflect the global distribution of galaxies, coupled
with the incompleteness due to the small region around the Galactic center.
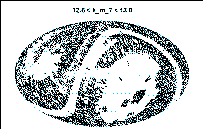
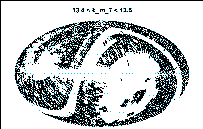
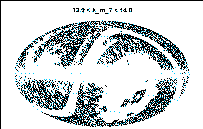
Figures 5-7 below show successively lower magnitude ranges are given,
demonstrating the growth of the Zone of Avoidance at fainter magnitudes:
|
|
|
| Figure 5 | Figure 6 | Figure 7 |
| 12.8<k_m_7<13.0 | 13.4<k_m_7<13.5
| 13.9<k_m_7<14.0 |
To view a "movie" of all these figures, click
here.
[Last Updated: 2000 January 20 by T. Chester.
Modified 2000 Aug 30 by S. Van Dyk.]
Previous page.
Return to Explanatory Supplement TOC Page.
 1.4 and binned them vs. magnitude and galactic
latitude. We use the k_m_7 magnitude. We normalized the counts by the
number of Atlas Images in the same bins of glat. We used an
"overlap-removed" area of 0.0332 square degrees per Atlas Image to convert to
galaxies per square degree.


