The 2MASS Second Incremental Data Release covers 47% of sky. This large area presents a challenge for assessing the quality of the XSC, in particular the reliability. The method we employ is to cross-identify the XSC sources with "catalogs" in which the source is identified as either extended (i.e., resolved) or otherwise. See below.
The "reliability" refers to the ratio of real "extended" sources to the total number of sources in the XSC. Objects which are not truly extended, but which mimic "extendedness" (e.g., double stars), are inevitably part of the Catalog. The purpose of this page is to present the level of contamination.
Key Conclusion: the XSC satisfies (or closely approaches) the Level 1 science requirement for reliability.
i. "Truth" Table
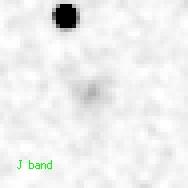
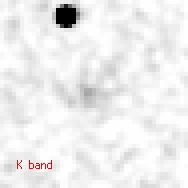
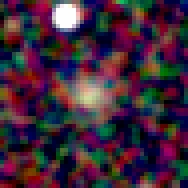
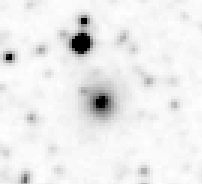
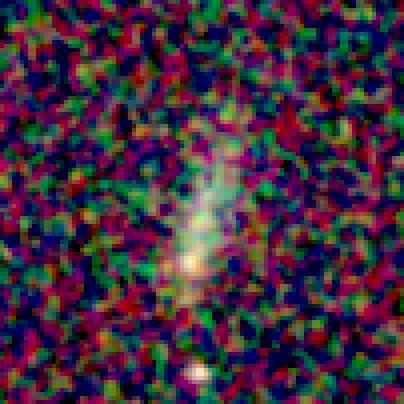
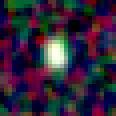
As part of the quality verification process, 2MASS has undertaken a program in which "extended" sources are visually examined, cross-compared with catalogs in SIMBAD, NED, & ZCAT, compared with DSS images, compared with deep optical and infrared imaging, and followed up with imaging and spectroscopy observations (in which systematic programs are in place). The visual examination entails an "expert" interaction in which the 2MASS J, H and Ks images (plus a composite three-color image) are displayed alongside the comparable DSS image. An example is shown in Figure 1:
|
|
|
|
|
| Figure 1: Galaxy near the Large Magellanic Cloud (J=14.77, J-Ks=0.99; no entries in SIMBAD or NED) | |||
The upshot is that we have a truth-table "catalog" of ~150,000 sources in which we have "classified" the source as either (1) extended (almost always a galaxy, except deep in the Zone of Avoidance [ZoA]), (2) stellar or pointlike, (3) double star (usually barely resolved), (4) triple stars (usually confined to the ZoA), (5) unknown (usually at the sensitivity and resolution limits). These sources are spread throughout the sky, with pockets concentrated about regions that were targeted for study (e.g., the Coma & Hercules cluster, LMC, ZoA, etc). Figure 2 is an equatorial skymap of the current "truth" table.
There are several cautionary notes. See the Caveats below.
 |
| Figure 2 |
ii. Method
We will use the truth-table to assess the reliability of the XSC. The Level 1 science requirements are relevant to the integrated flux intervals:
For |glat| > 20° (roughly corresponding to a "density" < 3.4; see below)
Our goal is >98% reliability (and >98% completeness) for |glat| > 30°, and >98% reliability (and >80% completeness) for |glat| > 20°. There are no requirements for |glat| < 20°, although we do present results below. These requirements apply to sources free of confusion or contamination. In the XSC there are confusion flags for each photometry aperture and an overall confusion flag. The reliability is computed for sources in which sources have "clean" confusion flags. This reliablity measurement should be considered an "upper limit" to the true reliability (see Caveats section).
The flux measurement used in this analysis corresponds to the radius = 7´´ circular aperture (j_m_7, h_m_7, k_m_7). This aperture is particularly suited to galaxies at the faintness levels relevant to the Level 1 requirements (see above). Hence, the radius = 7´´ circular aperture confusion flag (j_flg_7, h_flg_7, k_flg_7). is used to separate "confused" from "clean" sources. We also use the cc_flg confusion flag.
Finally, the Level 1 requirements are relevant to the "galaxy" catalog, which is a subset of the XSC. The "galaxy" catalog is constructed by selecting only sources with a g_score <= 1.4.
See also the Caveats section.
iii. Results
The total number of XSC sources that match the "truth" table is ~15,000. Figure 3 is a sky plot (shown with a flat projection) of the XSC sources that satisfy the g_score and magnitude thresholds. Overlaid are the "truth" matches, color-coded according to galactic coordinates.
 |
| Figure 3 |
(The legend to Figure 3 is
Black points:
Tables 1-5 summarize our results.
| Table 1: Reliability of the XSC for 30° < |glat| < 90° | |||||||||||||
| ib | mag- | mag+ | Den | Den- | Den+ | nT | nTf | ng | ns | nd | nt | nu | R |
|---|---|---|---|---|---|---|---|---|---|---|---|---|---|
| 1 | 14.50 | 15.00 | 2.72 | 1.88 | 3.20 | 5230 | 3711 | 3467 | 41 | 25 | 0 | 178 | 0.981 |
| 2 | 13.80 | 14.30 | 2.72 | 1.88 | 3.20 | 4499 | 3452 | 3262 | 26 | 22 | 2 | 139 | 0.985 |
| 3 | 13.00 | 13.50 | 2.73 | 2.10 | 3.20 | 3806 | 2966 | 2906 | 8 | 5 | 1 | 46 | 0.995 |
| Table 2: Reliability of the XSC for 20° < |glat| < 30° (and with "sh" >= 0.5, see second set of numbers) | |||||||||||||
| ib | mag- | mag+ | Den | Den- | Den+ | nT | nTf | ng | ns | nd | nt | nu | R |
|---|---|---|---|---|---|---|---|---|---|---|---|---|---|
| 1 | 14.50 | 15.00 | 3.05 | 2.64 | 3.40 | 2894 | 2091 | 1840 | 39 | 24 | 1 | 187 | 0.966 |
| 2 | 13.80 | 14.30 | 3.05 | 2.64 | 3.40 | 2467 | 1897 | 1701 | 28 | 10 | 1 | 157 | 0.978 |
| 3 | 13.00 | 13.50 | 3.06 | 2.52 | 3.40 | 1915 | 1518 | 1453 | 6 | 6 | 1 | 52 | 0.991 |
| - | - | - | - | - | - | - | - | - | - | - | - | - | - |
| ib | mag- | mag+ | Den | Den- | Den+ | nT | nTf | ng | ns | nd | nt | nu | R |
| 1 | 14.50 | 15.00 | 3.05 | 2.64 | 3.40 | 2894 | 1871 | 1707 | 8 | 12 | 1 | 143 | 0.988 |
| 2 | 13.80 | 14.30 | 3.05 | 2.64 | 3.40 | 2467 | 1579 | 1469 | 4 | 6 | 1 | 99 | 0.993 |
| 3 | 13.00 | 13.50 | 3.06 | 2.52 | 3.40 | 1915 | 1156 | 1128 | 2 | 1 | 1 | 24 | 0.996 |
| Table 3: Reliability of the XSC for 10° < |glat| < 20° (and with confusion flags ignored; see second set of numbers) | |||||||||||||
| ib | mag- | mag+ | Den | Den- | Den+ | nT | nTf | ng | ns | nd | nt | nu | R |
|---|---|---|---|---|---|---|---|---|---|---|---|---|---|
| 1 | 14.50 | 15.00 | 3.36 | 2.87 | 3.81 | 2934 | 1700 | 1555 | 29 | 24 | 4 | 88 | 0.965 |
| 2 | 13.80 | 14.30 | 3.35 | 2.87 | 3.81 | 2561 | 1611 | 1510 | 12 | 16 | 2 | 71 | 0.981 |
| 3 | 13.00 | 13.50 | 3.39 | 2.83 | 3.83 | 2638 | 1579 | 1513 | 11 | 11 | 3 | 41 | 0.984 |
| - | - | - | - | - | - | - | - | - | - | - | - | - | - |
| ib | mag- | mag+ | Den | Den- | Den+ | nT | nTf | ng | ns | nd | nt | nu | R |
| 1 | 14.50 | 15.00 | 3.39 | 2.87 | 3.85 | 2934 | 2934 | 2506 | 58 | 166 | 12 | 174 | 0.908 |
| 2 | 13.80 | 14.30 | 3.38 | 2.87 | 3.83 | 2561 | 2561 | 2315 | 28 | 72 | 8 | 135 | 0.954 |
| 3 | 13.00 | 13.50 | 3.42 | 2.83 | 3.85 | 2638 | 2638 | 2500 | 18 | 30 | 12 | 76 | 0.976 |
| Table 4: Reliability of the XSC for 5° < |glat| < 10° (and with confusion flags ignores; see second set of numbers) | |||||||||||||
| ib | mag- | mag+ | Den | Den- | Den+ | nT | nTf | ng | ns | nd | nt | nu | R |
|---|---|---|---|---|---|---|---|---|---|---|---|---|---|
| 1 | 12.00 | 15.00 | 3.67 | 3.26 | 4.48 | 2321 | 984 | 888 | 5 | 19 | 9 | 63 | 0.964 |
| 2 | 11.30 | 14.30 | 3.67 | 3.26 | 4.48 | 2335 | 1038 | 942 | 3 | 17 | 10 | 66 | 0.969 |
| 3 | 10.50 | 13.50 | 3.69 | 3.26 | 4.48 | 2088 | 910 | 830 | 3 | 18 | 8 | 51 | 0.966 |
| - | - | - | - | - | - | - | - | - | - | - | - | - | - |
| ib | mag- | mag+ | Den | Den- | Den+ | nT | nTf | ng | ns | nd | nt | nu | R |
| 1 | 12.00 | 15.00 | 3.73 | 3.26 | 4.50 | 2321 | 2293 | 1918 | 32 | 98 | 52 | 184 | 0.909 |
| 2 | 11.30 | 14.30 | 3.73 | 3.26 | 4.50 | 2335 | 2307 | 1968 | 25 | 71 | 48 | 190 | 0.930 |
| 3 | 10.50 | 13.50 | 3.75 | 3.26 | 4.50 | 2088 | 2057 | 1787 | 25 | 56 | 39 | 145 | 0.935 |
| Table 5: Reliability of the XSC for 0° < |glat| < 5° (and with confusion flags ignores; see second set of numbers) | |||||||||||||
| ib | mag- | mag+ | Den | Den- | Den+ | nT | nTf | ng | ns | nd | nt | nu | R |
|---|---|---|---|---|---|---|---|---|---|---|---|---|---|
| 1 | 12.00 | 15.00 | 3.77 | 3.44 | 4.50 | 1445 | 432 | 358 | 10 | 15 | 12 | 37 | 0.906 |
| 2 | 11.30 | 14.30 | 3.74 | 3.43 | 4.50 | 1639 | 562 | 485 | 10 | 16 | 9 | 42 | 0.933 |
| 3 | 10.50 | 13.50 | 3.75 | 3.43 | 4.50 | 1601 | 538 | 467 | 9 | 17 | 12 | 33 | 0.925 |
| - | - | - | - | - | - | - | - | - | - | - | - | - | - |
| ib | mag- | mag+ | Den | Den- | Den+ | nT | nTf | ng | ns | nd | nt | nu | R |
| 1 | 12.00 | 15.00 | 3.93 | 3.44 | 4.50 | 1445 | 1318 | 866 | 60 | 73 | 164 | 147 | 0.740 |
| 2 | 11.30 | 14.30 | 3.89 | 3.43 | 4.50 | 1639 | 1514 | 1061 | 61 | 72 | 163 | 148 | 0.777 |
| 3 | 10.50 | 13.50 | 3.90 | 3.43 | 4.50 | 1601 | 1479 | 1029 | 58 | 78 | 167 | 138 | 0.767 |
iv. Reliability for XSC Sources with (g_score > 1.4) and (e_score <= 1.4)
About 10% of the XSC is populated by sources that do not pass the g_score threshold, but do satisfy the e_score criteria. What are these objects? The e_score is designed to identify extended sources using star-galaxy discriminants independent of any color bias (unlike the g_score, which is biased against blue objects). As designed, the e_score detects blue (J-Ks < 0.8) extended sources, including blue compact and low surface brightness galaxies. Figure 4 shows an example of a nice blue (J=14.65, J-Ks = 0.42) low surface brightness galaxy.
 |
| Figure 4 |
Unfortunately, the e_score is also vulnerable to false "extended" sources, including artifacts from bright stars (because most stars are brightest at "J", hence the generate more artifacts in the "blue" band). It is not as robust at the g_score at separating (faint) single and double stars from real extended sources. Figure 5 shows an example of a false e_score source (it is a compact blue double star). The overall reliability is poor, hovering around 50% for most of the sky and less than 10% for the Galactic plane(see below). On the other hand, the e_score does identify blue galaxies. Hence, the e_score, in combination with the reliable g_score, comprises a more complete set of galaxies, spanning a larger dynamic range in color. For the Galactic plane, the e_score is not reliable indicator of extendedness.
 |
| Figure 5 |
| Table 6: Reliability of the XSC for e_score <= 1.4, g_score > 1.4 and 30° < |glat| < 90° | ||||||||||||||
| ib | mag- | mag+ | Den | Den- | Den+ | nT | nTf | ng | ns | nd | nt | nu | na | R |
|---|---|---|---|---|---|---|---|---|---|---|---|---|---|---|
| 1 | 14.50 | 15.00 | 2.70 | 2.10 | 3.20 | 847 | 401 | 127 | 139 | 73 | 3 | 53 | 6 | 0.365 |
| 2 | 13.80 | 14.30 | 2.71 | 2.27 | 3.20 | 583 | 258 | 79 | 85 | 50 | 4 | 33 | 7 | 0.351 |
| 3 | 13.00 | 13.50 | 2.69 | 2.24 | 3.09 | 137 | 32 | 15 | 5 | 4 | 1 | 7 | 0 | 0.600 |
| ib | mag- | mag+ | Den | Den- | Den+ | nT | nTf | ng | ns | nd | nt | nu | na | R |
|---|---|---|---|---|---|---|---|---|---|---|---|---|---|---|
| 1 | 14.50 | 15.00 | 3.13 | 2.78 | 3.40 | 455 | 213 | 60 | 44 | 64 | 2 | 43 | 0 | 0.353 |
| 2 | 13.80 | 14.30 | 3.16 | 2.82 | 3.40 | 279 | 138 | 52 | 12 | 38 | 0 | 35 | 1 | 0.505 |
| 3 | 13.00 | 13.50 | 3.16 | 2.95 | 3.37 | 30 | 15 | 7 | 1 | 2 | 1 | 4 | 0 | 0.636 |
| ib | mag- | mag+ | Den | Den- | Den+ | nT | nTf | ng | ns | nd | nt | nu | na | R |
|---|---|---|---|---|---|---|---|---|---|---|---|---|---|---|
| 1 | 14.50 | 15.00 | 3.43 | 2.87 | 3.73 | 1319 | 433 | 122 | 69 | 164 | 17 | 61 | 0 | 0.328 |
| 2 | 13.80 | 14.30 | 3.47 | 3.00 | 3.81 | 1098 | 400 | 120 | 29 | 173 | 29 | 48 | 1 | 0.341 |
| 3 | 13.00 | 13.50 | 3.50 | 3.00 | 3.81 | 161 | 72 | 34 | 2 | 17 | 6 | 12 | 1 | 0.567 |
| ib | mag- | mag+ | Den | Den- | Den+ | nT | nTf | ng | ns | nd | nt | nu | na | R |
|---|---|---|---|---|---|---|---|---|---|---|---|---|---|---|
| 1 | 12.00 | 15.00 | 3.69 | 3.33 | 4.12 | 1104 | 276 | 45 | 18 | 134 | 38 | 40 | 1 | 0.191 |
| 2 | 11.30 | 14.30 | 3.72 | 3.31 | 4.12 | 903 | 249 | 45 | 12 | 120 | 36 | 35 | 1 | 0.210 |
| 3 | 10.50 | 13.50 | 3.82 | 3.38 | 4.12 | 305 | 85 | 21 | 1 | 33 | 16 | 13 | 1 | 0.292 |
| ib | mag- | mag+ | Den | Den- | Den+ | nT | nTf | ng | ns | nd | nt | nu | na | R |
|---|---|---|---|---|---|---|---|---|---|---|---|---|---|---|
| 1 | 12.00 | 15.00 | 3.70 | 3.44 | 4.45 | 1850 | 436 | 25 | 55 | 244 | 71 | 37 | 3 | 0.063 |
| 2 | 11.30 | 14.30 | 3.72 | 3.44 | 4.45 | 1560 | 407 | 42 | 36 | 212 | 73 | 39 | 4 | 0.114 |
| 3 | 10.50 | 13.50 | 3.84 | 3.54 | 4.45 | 643 | 145 | 34 | 10 | 47 | 31 | 21 | 2 | 0.274 |
| - | - | - | - | - | - | - | - | - | - | - | - | - | - | |
| 1 | 12.00 | 15.00 | 3.74 | 3.44 | 4.50 | 1850 | 1825 | 63 | 132 | 1016 | 492 | 103 | 18 | 0.037 |
| 2 | 11.30 | 14.30 | 3.77 | 3.44 | 4.50 | 1560 | 1537 | 106 | 82 | 776 | 451 | 106 | 14 | 0.074 |
| 3 | 10.50 | 13.50 | 3.93 | 3.49 | 4.50 | 643 | 619 | 88 | 18 | 199 | 243 | 64 | 6 | 0.159 |
v. Caveats
The "truth" table is compiled using diverse methods, some more
reliable and objective than
others. It is inevitable that errors and biases are introduced into the table.
For example, galaxy clusters are often targeted for study, due to their
favorable properties (e.g., lots of galaxies in a small area). The reliability
is always higher near a cluster (due to how the reliability is
computed).
Hence, we are biased toward a higher reliability in the "truth" table compared
to a table compiled for only field sources: the reliability measurement
is an upper limit. In addition, errors creep in, due to
mis-classification (often it is in the sense that a real, but faint, galaxy
is classified as "non-extended" or stellar, when in fact it is extragalactic):
there is some uncertainty (if small) in the reliability measurement.
Although we have a large number of sources with "truth" matches (nearly
15,000), it is a tiny fraction of the total number of XSC sources
(over 500,000 total for all flux levels). We are thus making sweeping
conclusions (reliability) of the XSC based on a small number of sources
(which are in itself biased; see above paragraph). To reiterate: the true
reliability of the entire XSC is probably slightly lower
than what is measured here.
Classification is particularly difficult in the Galactic plane, where confusion
creates many kinds of multiple stars that can look identical to a galaxy.
We make no distinction between a resolved galaxy and a resolved Galactic
source (e.g., nebulosity). Hence, "extended" source means galaxy and Galactic
source. However, most extended sources are galaxies (by far this is true for
most of the sky). In the Galactic plane the frequency of extended Galactic
objects rises steeply (e.g., HII regions dominate for |glat| < 5°).
The Level 1 requirements apply to only the g_score (threshold = 1.4).
The XSC has many sources (about 9.8% of the total)
that do not satisfy this threhold. They are in the XSC due to the
e_score criteria (also threshold at 1.4). The e_score is a
simpler measure of "extendedness" that is designed to be less biased to blue
objects (but is also less reliable overall).
Figure 6 is a
skymap of the XSC sources that do not meet the g_score threshold (but
do meet the e_score threshold);
there are a total of ~59,000 sources (at all flux levels).
 |
| Figure 6 |
When the confusion noise is high (i.e., in the Galactic plane) the frequency of contamination from a nearby source is significant. Hence, "clean" or unconfused sources in the ZoA are somewhat rare (see tables above, comparing "clean" and total counts). This is clearly a biased "reliability" measurement for these areas.
Note the relatively large number of "unknown" sources (denoted as "nu" in the tables). If these turn out to non-extended, then the reliability drops significantly. Conversely, if they are truly extended, then the reliability is pristine. Only higher sensitivity and deeper resolution imaging (or spectroscopy) can definitely decode the nature of these sources. Past experience with follow-up observations suggests that most of the sources are extragalactic in nature. Finally, statistical analysis suggests that these "unknown" sources are indeed resolved galaxies (see The Nature of Galaxy Truth Table "Unknowns").
[Last Updated: 2000 Jan 27 by T. Jarrett. Modified 2000 Sep 12 by S. Van Dyk.]