Sec 2 Sec 3 Sec 4 Sec 5 Sec 6 Appendix
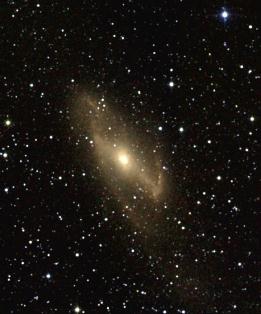
Cover Image— The barred spiral galaxy Maffei 2, as seen through the plane of the Milky Way. The 3-color image represents J-band (blue) at 1.2 mm, H-band (green) at 1.6 mm, and Ks-band (red) at 2.2 mm. (Credit: R. Cutri)
Fig. 1.— Stellar "sh" ridgeline for a scan passing through the Hercules galaxy cluster. The scan coordinate corresponds to the declination axis and, effectively, the time axis. The "sh" or (a ´ b), in the generalized exponential function; see text for details, per source is shown for the K (top), H (middle) and J (bottom) bands. Mean "sh" values and their associated uncertainties (rms of distribution) are denoted with filled circles and error bars. The stellar ridgeline is defined by the mean "sh" values. Resolved Hercules galaxies, which have intrinsically large "sh" values, are the points that scatter above the ridge.
Fig. 2.— Stellar "sh" ridgeline for a scan with poor atmospheric "seeing". The scan coordinate corresponds to the declination and time axis. The "sh" per source is shown for the K (top), H (middle) and J (bottom) bands. Mean "sh" values and their associated uncertainties (rms of distribution) are denoted with filled circles and error bars.
Fig. 3.— 2MASS Extended Source Processor I/O flowchart.
Fig. 4.—Detailed flowchart for the 2MASS Extended Source Processor.
Fig. 5.— Bright stars with associated nebulosity. The first five sources come from the Orion trapezium region and the last three from the large magellanic clouds. The upper row shows J-band postage stamp images, middle row the H-band and bottom row the K-band images. Each image is 50’´ 50’ in angular size. The integrated flux for the sources range from 5th to 7th mag.
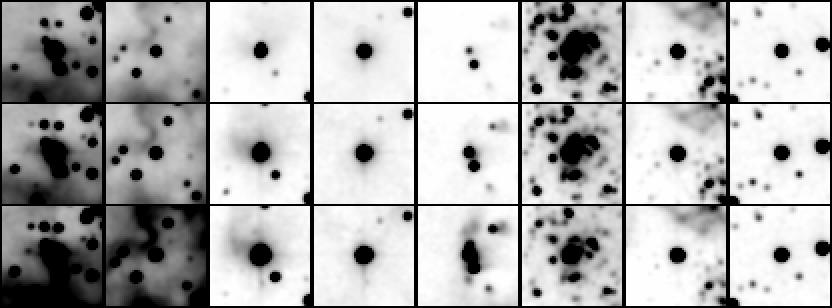
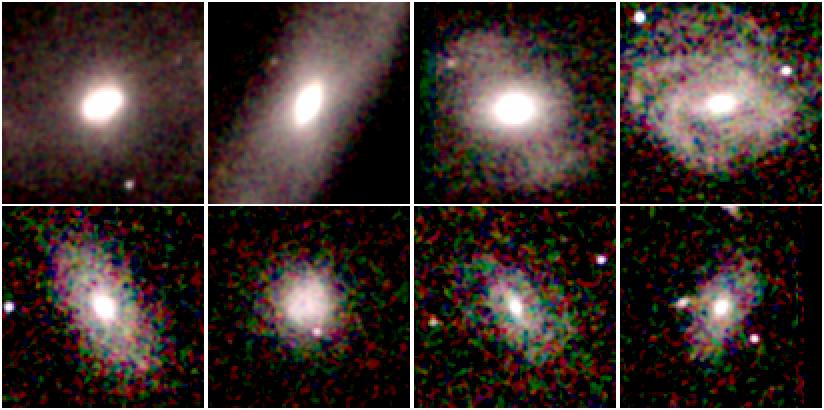
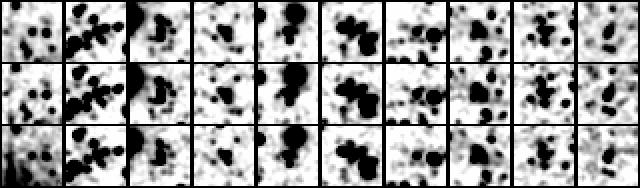
Fig. 6.— Low central surface brightness galaxies. Typical set of galaxies detected and extracted with the LCSB processor. The upper row shows J-band postage stamp images, middle row the H-band and bottom row the K-band images. Each image is 25’´ 25’ in angular size. The integrated flux for each source is (reading left to right): (J=15.0, H=14.3, K=13.8), (15.1, 14.5, 14.0), (15.2, 14.5, 13.9), (15.6, 14.7, 13.9), (15.4, 14.5, 14.1), (15.1, 14.5, 14.3), 15.7, 14.8, 14.0), & (15.3, 15.1, 15.2).
Fig. 7.— 2MASS Atlas Image (coadd) decomposition schematic for background fitting. The J,H, Ks raw images have 512´ 1024 pixels (~8.5´ 16’) each. The first step is to resample the image with an 8´ 8 median filter. A cubic polynomial is then fit to the surface defined by dividing the filtered image into three chunks: upper, middle and lower, with 50% overlap between the middle and upper segments, and middle and lower segments. The final background solution results from a weighted-average (overlap dependent) stitching between the three segments.
Fig. 8.— Example of a raw J-band image, the corresponding background solution and the residual (background subtracted) image. The gray-scale stretch ranges from –2s to 5s of the median background level.
Fig. 9.— Example of a raw H-band image, the corresponding background solution and the residual (background subtracted) image. The gray-scale stretch ranges from –2s to 5s of the median background level. Notice the prominent "airglow" background gradients in the raw image (left-most panel) and low-level-high-frequency ridges in the residual image (right-most panel). This image is in fact rather typical for 2MASS data.
Fig. 10.— Example of a raw Ks-band image, the corresponding background solution and the residual (background subtracted) image. The gray-scale stretch ranges from –2s to 5s of the median background level. The background level is approximately 4´ larger than that of J-band (due to thermal emission of the atmosphere).
Fig. 11.— Distribution of stars, multiple stars and galaxies in the J-band "sh" versus magnitude parameter plane. The sources do not come from the same sample; e.g., the triple stars are derived from high stellar source density fields in the galactic plane. Stars generally outnumber galaxies by a ratio of 10:1 for J brighter than 15th mag.
Fig. 12.— The expected number of doubles stars and triple stars (dotted lines) with galactic latitude. For comparison, the total number of stars (solid line) and the expected number of field galaxies (dashed line) are given. The longitude is fixed at 90 deg. The calculations are based on the starcount models of Jarrett (1992). Double stars, dominated by sky-projected associations, represent ‘primary-secondary’ separations of less than 6² (the 2MASS PSF for comparison has a FWHM > 2²). The galaxy counts are based on 2MASS data.
Fig. 13a.— Examples of large 2MASS Virgo galaxies as seen in J,H, Ks composite. Each image is 101² in angular size, the maximum size for 2MASS extended source "postage-stamp" images. Reading left to right: (top panel) Messier 100, Messier 98, NGC 4340, NGC 4189; (bottom panel) NGC 4305, NGC 4344, IC 769, NGC 4165.
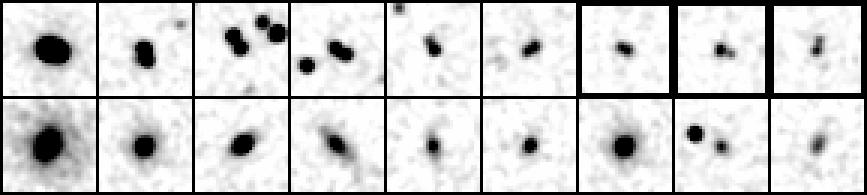
Fig. 13b.— Examples of 2MASS double stars and galaxies. The upper panels demonstrate various kinds of doubles encountered. The lower panels show galaxies with approximately the same flux as their double star counterparts (left most panel: J = 11th mag; right-most panel, J = 15th mag).
Fig. 14.—Cartoon representation of measuring the radial extent of a ‘double star’ using adaptive masking. A wedge-shaped mask, vertex anchored to the primary star and rotated through all angles, is used to selectively block light. At each rotation angle, the radial profile is reconstructed (excluding pixels from masked area) and is fit with the generalized exponential function (Eq. 1). The "wsh" score corresponds to the minimum "sh" (a b) of the set defined by the rotation angle, which generally corresponds to the optimum masking of the secondary star. Hence, the "wsh" values approaches that of an isolated star (or the idealized PSF), although it is never as small as that of an isolated star since the secondary contaminates the true centroid position of the primary star (depending on the pair relative brightness and separation).
Fig. 15.— Distribution of multiple stars and galaxies in the J-band "wsh" score versus magnitude parameter plane. The sources do not come from the same sample; e.g., the triple stars are derived from high stellar source density fields in the galactic plane
Fig. 16.— Distribution of multiple stars and galaxies in the J-band "r23" score versus magnitude parameter plane. The sources do not come from the same sample; e.g., the triple stars are derived from high stellar source density fields in the galactic plane.
Fig. 17.— Histogram of the J-K color distribution for galaxies and double stars. The upper panel is restricted to sources with K < 13.5. The middle panel represents sources at the sensitivity limit of the survey (K < 13.75) and the last panel shows sources generally fainter than the K–band sensitivity limits (K > 13.75) but detected and extracted due in part to the superior sensitivity limit at J band. The data come from a diverse set of low stellar number density fields, comprising some 250 square degrees.
Fig. 18.— Histogram of the J-K color distribution for galaxies and double stars in moderate stellar number density fields (103.1 – 10.3.6 stars/deg2). The upper panel is restricted to sources with K < 13.5, and the bottom panel K > 13.75. The data come from a diverse set of moderate stellar number density fields, comprising some 150 square degrees.
Fig. 19.— Histogram of the J-K color distribution for galaxies and double stars in high stellar number density fields (>10.3.6 stars/deg2). The upper panel is restricted to sources with K < 13.0, and the bottom panel K > 13.0. The data come from a diverse set fields, comprising some 60 square degrees.
Fig. 20.— J-H vs. H-K color plane distribution for sources, K < 13.5, located in low stellar number density fields. Triangles denote double stars, crosses triple stars, and small points galaxies. The solid line demarks the main sequence tracks (dwarfs lower track, giants upper track). The K-correction track for spirals is shown with the dashed line. The large diamond symbols denote intervals of 0.1 in redshift (z).
Fig. 21.— J-H vs. H-K color plane distribution for sources, K < 13.5, located in moderate stellar number density fields. Triangles denote double stars, crosses triple stars, and small points galaxies. The solid line demarks the main sequence tracks (dwarfs lower track, giants upper track). The K-correction track for spirals is shown with the dashed line. The large diamond symbols denote intervals of 0.1 in redshift (z).
Fig. 22.— J-H vs. H-K color plane distribution for sources, K < 13.0, located in high stellar number density fields. Triangles denote double stars, crosses triple stars, and small points galaxies. The solid line demarks the main sequence tracks (dwarfs lower track, giants upper track). The K-correction track for spirals is shown with the dashed line. The large diamond symbols denote intervals of 0.1 in redshift (z).
Fig. 23.— Distribution of stars and galaxies in the "color score + wsh" space. The upper panel corresponds to low stellar number density; middle panel to moderate stellar number density; lower panel to high stellar number density.
Fig. 24.— An example of a two-featured data hyperplane set that comprises a decision tree node. A subsection of the "wsh" score – J magnitude plane for galaxies (denoted with filled circles) and non-galaxies (denoted with cross symbols) is shown (derived from sample shown in Fig. 12). Axis-parallel planes are represented with dashed lines and the best-fit oblique plane in represented with a solid line.
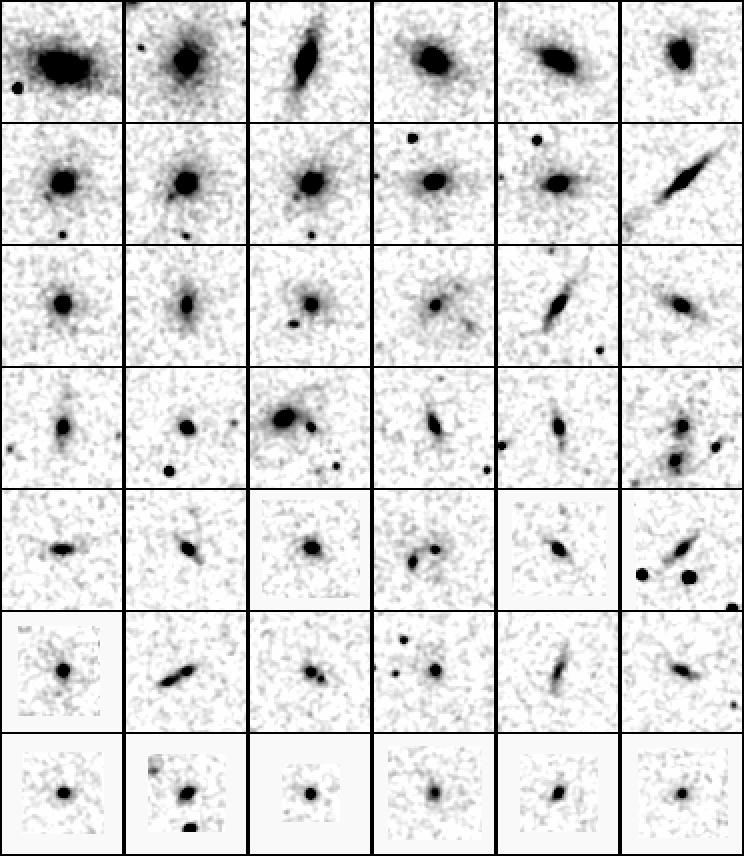
Fig. 25.— Bright 2MASS galaxies as seen in the K-band. The sequence is arranged in order of integrated K-band flux, reading left to right. 1st panel: K mags range from 9th to 10.5; 2nd panel: 10.5 – 11.0; 3rd panel: 11.0 – 11.6; 4th panel: 11.6 to 12.1; 5th panel: 12.1 – 12.3; 6th panel: 12.3 – 12.6; last panel: 12.6 – 12.9. Each image is 60" in angular width.
Fig. 26.— 2MASS galaxies at the K-band sensitivity requirement limit, K~13.5 mag. The sequence is arranged in order of integrated K-band flux, reading left to right. 1st panel: K mags range from 13th to 13.1; 2nd panel:13.1 – 13.3; 3rd panel:13.3 – 13.4; last panel:13.4 – 13.5. Each image is 30" in angular width.
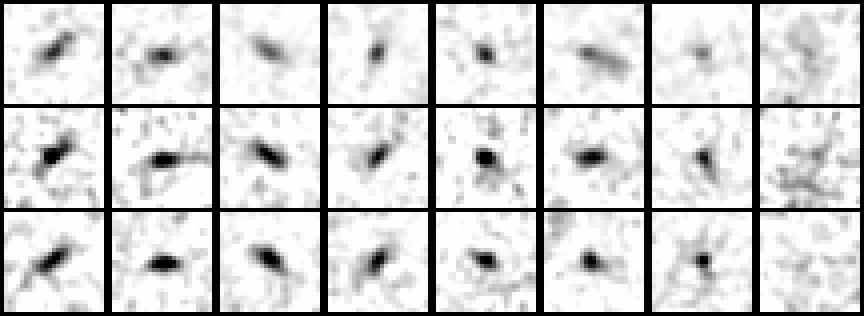
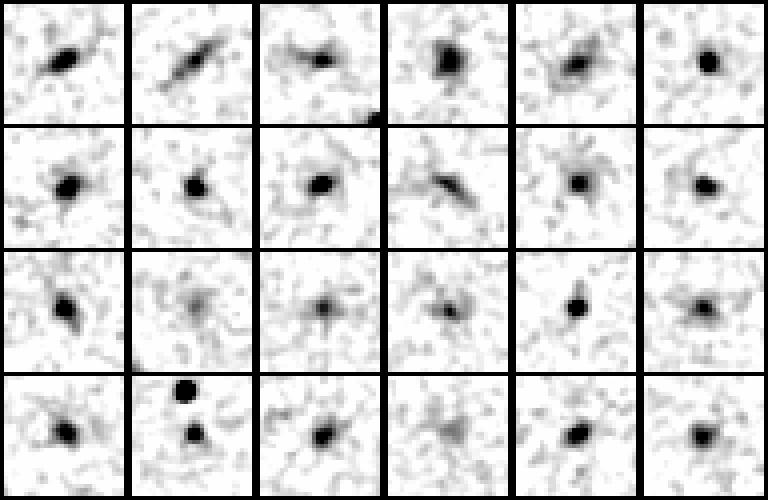
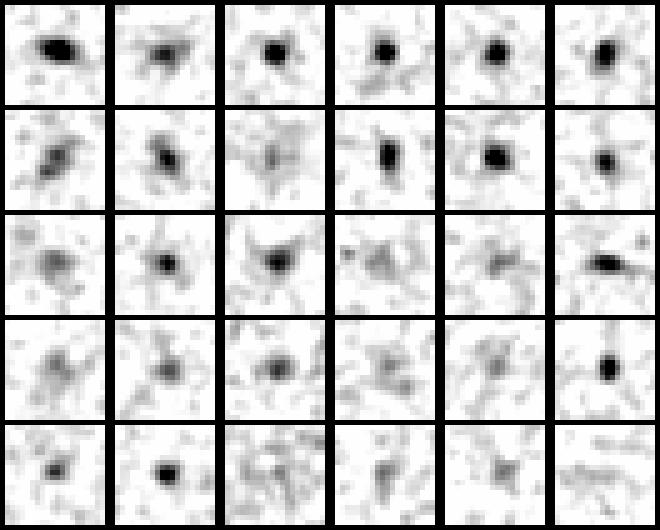
Fig. 27.— Faint 2MASS galaxies as seen in the K-band. The sequence is arranged in order of integrated K-band flux, reading left to right. 1st panel: K mags range from 13.5 to 13.7; 2nd panel:13.7 – 13.9; 3rd panel:13.9 – 14.1; 4th panel:14.1 14.2; last panel:14.3–15th. Each image is 20" in angular width.
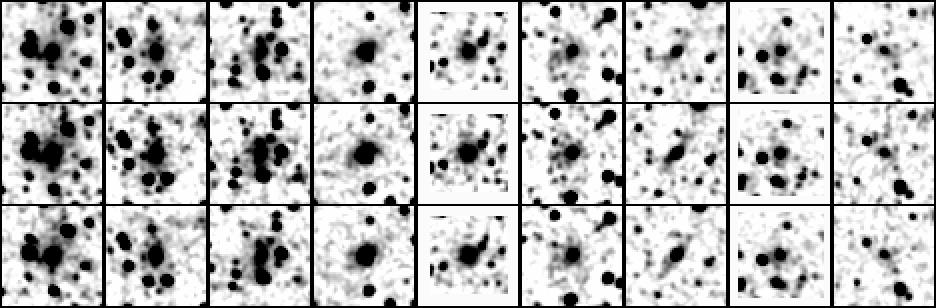
Fig. 28.— Galaxies found in the galactic plane (approx coords: 240° , +4.5° ), corresponding to a density of 4500 stars per deg2 brighter than 14th mag. The sequence is arranged in order of integrated K-band flux, ranging 11.8 to 13.8 mag (reading left to right). The upper row corresponds to the J-band postage stamp image, middle row the H-band and bottom row the K-band images. Each image is 50" in angular width.
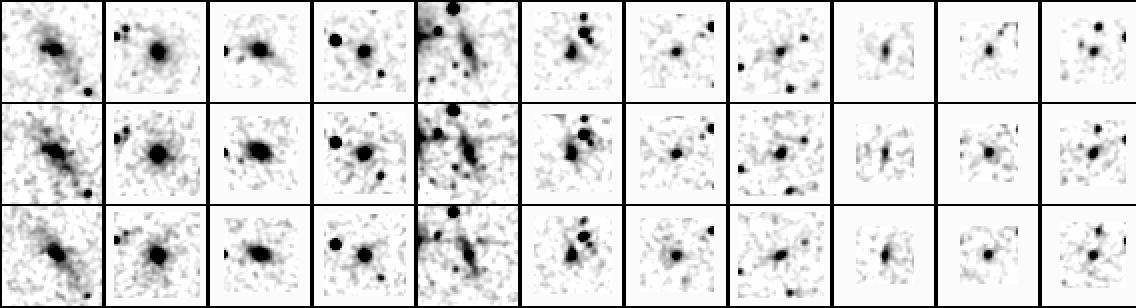
Fig. 29a.— Galaxies found near the galactic center bulge (approx coords: 12° , +5.0° ), corresponding to a density of 30,000 stars per deg2 brighter than 14th mag. The sequence is arranged in order of integrated K-band flux, ranging 11.0 to 12.7 mag (reading left to right). The upper row corresponds to the J-band postage stamp image, middle row the H-band and bottom row the K-band images. Each image is 50" in angular width.
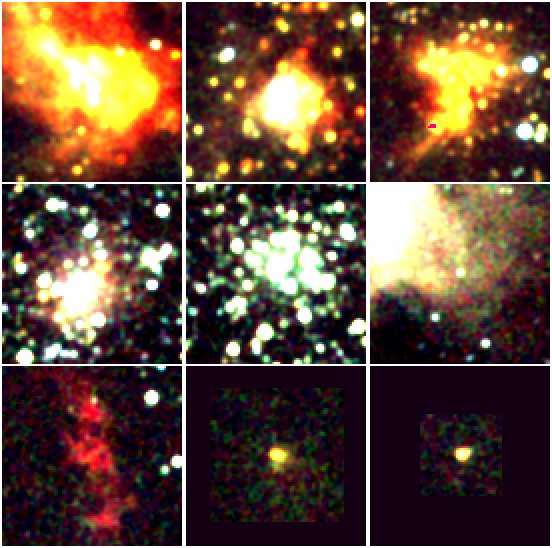
Fig. 29b.— Galactic extended sources. J,H,Ks three-color images of H II regions (upper panel), clusters and nebulosity (middle panel; far right image corresponds to a piece of the Crab Nebula), reflection nebulae and YSOs (bottom panel).
Fig. 30.— Triple (& multiple) stars found near the galactic center bulge (approx coords: 12° , +5.0° ), corresponding to a density of 30,000 stars per deg2 brighter than 14th mag. The upper row corresponds to the J-band postage stamp image, middle row the H-band and bottom row the K-band images. Each image is 25" in angular width.
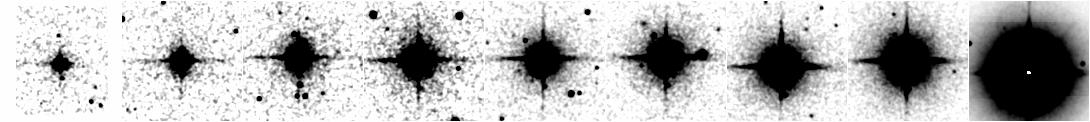
Fig. 31.— Bright star sequence as seen in the J-band. The sequence is arranged in order of integrated J-band flux (mag units), reading left to right: 9.8, 8.7, 7.9, 7.4, 6.8, 6.4, 5.9, 5.5 & 4.1. Each image is 120" in width.
Fig. 32.— J-band (coadd) image of a 4th magnitude star. The image size is 8.5 ´ 16’. Features associated with the bright star: halo emission, N-S-E-W diffraction spikes, three horizontal stripes, glints/ghosts, and persistence ghosts (trailing to the south of the star).
Fig. 33.— J-band (coadd) images of b Pegasus, a –1 mag star. The star lands on the in-scan boundary of two coadd images. The total area is approximately 8.5’ ´ 25’. Note the prominent halo emission, N-S-E-W diffraction spikes, three horizontal stripes, glints/ghosts (particularly to the northeast), and persistence ghosts trailing to the south of the star.
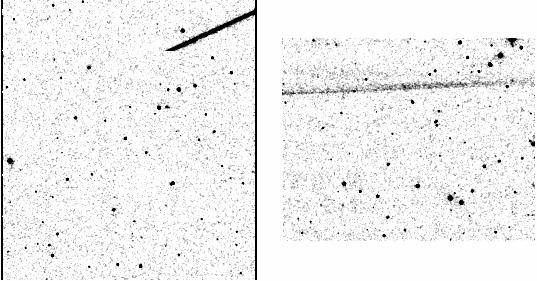
Fig. 34.— Meteor and bright star streaks as seen in the J-band. The images are 8.5’ across. The meteor streak is the left image and the streak associated with b Pegasus, a –1 mag star located nearly a degree away, the right image.
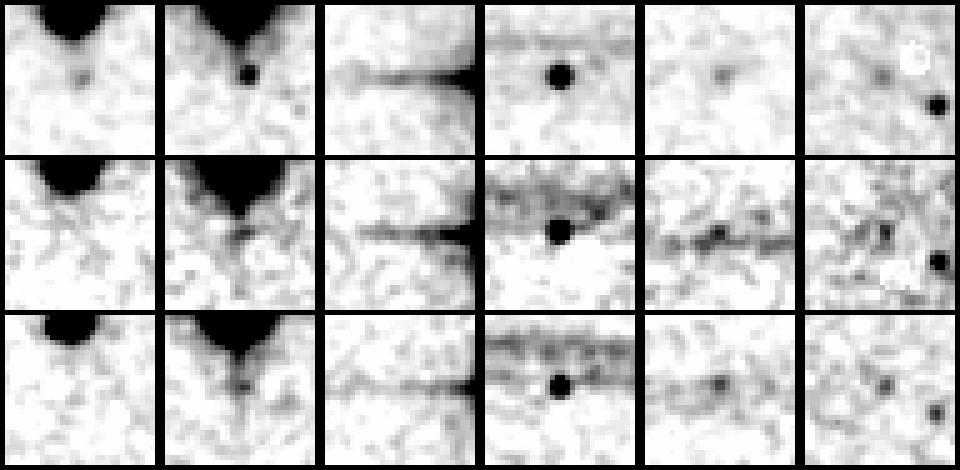
Fig. 35.— Example of "artifact" or false extended source detections. The upper panels show J-band, middle panels H-band and the bottom panels K-band. Each image is 30" in width. The first two columns are the result of a "ghost" or "glint" to the southwest of the progenitor star; 3rd column shows a false detection due to a flared diffraction spike from a star on the edge of coadd; 4th and 5th columns are examples of located on or within the boundary of a horizontal stripe or meteor streak; last column shows s a faint star boosted up by background airglow emission.
Fig. 6-0.— Classification Scores vs. Flux. (upper panel) ~2000 candidate extended source "E" scores vs. J mag; (lower panel) Candidate extended source "G" scores vs. K mag . Real galaxies are denoted by small filled circles, isolated and double stars by triangles, triple stars by "x" symbols and artifacts by "+" symbols. Most of the galaxies have scores <1.4, while most non-galaxies have scores > 1.4. The classifications derive from visual inspection of 2MASS image data and the digital sky survey (DSS), as well as cross-indexing with catalogs from the Nasa Extragalactic Database (NED).
Fig. 6-1. — The internal completeness and reliability as a function of the (a) "E" score and the (b) "G" score for a sample of candidate extended sources with integrated fluxes between 14.0 - 14.5 at J, 13.5 - 14.0 at H, and 13.0 to 13.5 at K. The mag bins were chosen to approximately match the faintest flux bins relevant to the 2MASS level-1 requirements (at which the reliability is the most challenging to achieve). The optimum scores, maximizing the reliability while constraining the internal completeness to >90%, appear to be between 1.3 and 1.4 (denoted by dot-dash vertical lines).
Fig. 6-2. — Completeness and reliability for low confusion fields, <1200 stars deg-2 brighter than 14th mag at K, using a "G" score threshold of 1.4. The sample is restricted to extended source candidates with (Eq. 1.) "sh" values (a) > 0.1² , and (b) > 0.5² . The latter threshold is relevant to the 2MASS level-1 completeness and reliability requirements. Also denoted (vertical dot-dashed lines) are faintest flux limits relevant to the requirements at J (15.0 mag), H (14.2 mag) and Ks (13.5 mag).
Fig. 6-3. — Completeness and reliability for moderate confusion fields, 1200 - 4000 stars deg-2 brighter than 14th mag at K, using a "G" score threshold of 1.4. The sample is restricted to extended source candidates with (Eq. 1.) "sh" values (a) > 0.1² , and (b) > 0.5² .
Fig. 6-4. — Completeness and reliability for high confusion fields, 4000 - 10000 stars deg-2 brighter than 14th mag at K, using a "G" score threshold of 1.4. The sample is restricted to extended source candidates with (Eq. 1.) "sh" values (a) > 0.1² , and (b) > 0.5² .
Fig. 6-5. — Differential extended source counts corresponding to low stellar confusion fields, <1200 stars deg-2 brighter than 14th mag at K, using a "G" score threshold of 1.4. The error bars represent sqrt(n) uncertainty measures. The sources comprise a total areal coverage of ~200 square degrees. Most of the area is free of known nearby clusters (z < 0.1), but a small percentage does include the Abell 262 cluster in Perseus and the outer fringes of the Virgo cluster. For comparison, deep but narrow-field counts from Glazebrook et al (1994), denoted with a dotted line, and Gardner et al (1997), denoted with "+" symbols, are shown.
Fig. 6-6. — Differential extended source counts corresponding to moderate stellar confusion fields, 1200 - 4000 stars deg-2 brighter than 14th mag at K, using a "G" score threshold of 1.4. The error bars represent sqrt(n) uncertainty measures. The sources comprise a total areal coverage of ~105 square degrees. For comparison, deep but narrow-field counts from Glazebrook et al (1994), denoted with a dotted line, and Gardner et al (1997), denoted with "+" symbols, are shown.
Fig. 6-7. — Differential extended source counts corresponding to high stellar confusion fields, 4000 - 10000 stars deg-2 brighter than 14th mag at K, using a "G" score threshold of 1.4. The error bars represent sqrt(n) uncertainty measures. The sources comprise a total areal coverage of ~25 square degrees. For comparison, deep but narrow-field counts from Glazebrook et al (1994), denoted with a dotted line, and Gardner et al (1997), denoted with "+" symbols, are shown.
Fig. 6-8. — Angular size of extended sources as a function of the K mag. The (top panel) shows the size distribution (in arc seconds) of the semi-major axis radius corresponding to the best fit ellipse of the 20 mag arcsec-2 K-band isophote. The minimum radius corresponds to 7² (horizontal dashed line). The (middle panel) shows the size distribution of the semi-major axis radius corresponding to the best fit ellipse of the 21 mag arcsec-2 J-band isophote. The bottom panel shows the semi-major axis radius corresponding to the 3-sigma K-band isophote, corresponding to roughly 18.8 mag arcsec-2 surface brightness. The minimum 3-sigma radius is ~5² .
Fig. 6-9. — (a) Peak and (b) central £ 5² mean surface brightness as a function of the integrated K mag.
Fig. 6-10. — Color-color distribution for extended sources located within low stellar confusion fields, <1200 stars deg-2 brighter than 14th mag at K. The galaxy color-color is demarked by symbols coded according to the J-K signal to noise ratio. The solid lines denote the main-sequence locus (giants diverge at large J-H). The dashed line and triangle points denote the K-correction curve for a spiral galaxy (no evolution), where each triangle represents 0.1 in redshift (z).
Fig. 6-11. — Color-color distribution for extended sources located within moderate stellar confusion fields, 1200 - 4000 stars deg-2 brighter than 14th mag at K. Extinction from obscuring dust in the Milky Way is a significant reddening component.
Fig. 6-12. — Color-color distribution for extended sources located within high stellar confusion fields, 4000 - 10000 stars deg-2 brighter than 14th mag at K. Extinction from obscuring dust in the Milky Way is a significant reddening component.
Fig. 6-13. — (top panel) Axis ratio distribution for bright extended sources: J < 13.5, H < 12.7 and K < 12.4. (middle panel) Distribution of goodness of fit metric, "%echi", for the ellipse fit (radius, axis ratio and position angle) to the J-band 3-sigma isophote; see Eq. ?? (section 3.4). The dotted line demarks sections of "good" fits (<14), moderate fit (<20) and a poor fit (>20). (bottom panel) J vs. K axis ratio. The symbols denote the quality or goodness of fit: filled circles == best fit, triangles == moderate fit and "x" poor fits.
Fig 6-14. — (top panel) Axis ratio distribution for faint extended sources: 13.0 < J < 14.5, 12.3 < H < 13.7 and 12.0 < K < 13.4; (middle panel) Distribution of goodness of fit; (bottom panel) J vs. K axis ratio.
Fig. 6-15. — (top panel) Position angle distribution for bright extended sources: J < 13.5, H < 12.7 and K < 12.4, and axis ratios between 0.0 and 0.5. The standard orientation is used: east of north; (bottom panel) J vs. K position angle. The symbols denote the quality or goodness of fit: filled circles == best fit, triangles == moderate fit and "x" poor fits.
Fig. 6-16. — (top panel) Position angle distribution for faint extended sources: 13.0 < J < 14.5, 12.3 < H < 13.7 and 12.0 < K < 13.4, and axis ratios between 0.0 and 0.5; (bottom panel) J vs. K position angle.
Fig. 6-17. — (top panel) Position angle distribution for bright extended sources: J < 13.5, H < 12.7 and K < 12.4, and axis ratios between 0.5 and 0.75. The standard orientation is used: east of north; (bottom panel) J vs. K position angle. The symbols denote the quality or goodness of fit: filled circles == best fit, triangles == moderate fit and "x" poor fits.
Fig. 6-18. — (top panel) Position angle distribution for faint extended sources: 13.0 < J < 14.5, 12.3 < H < 13.7 and 12.0 < K < 13.4, and axis ratios between 0.5 and 0.75; (bottom panel) J vs. K position angle.
Fig. 6-19. — 2MASS sources with NED identifications. The 2MASS sample comes from the first 2MASS extended source catalog, of which ~10,000 NED matches were found (including matches with sources from the 2MASS Public Sampler Release Catalog, found in NED). (upper panel) J-band source counts; (middle panel) coordinate position difference (NED - 2MASS); (bottom panel) redshift distribution.
Fig. 6-20. — Sky plot of the 2MASS Extended Source Catalog in the first incremental public data release. Green points correspond to NED matches (see Fig 6-19), which include the 2MASS Sampler Data catalog. The galactic plane is represented by the red dashed line and the Glat = ± 5° contours by the red dotted lines.
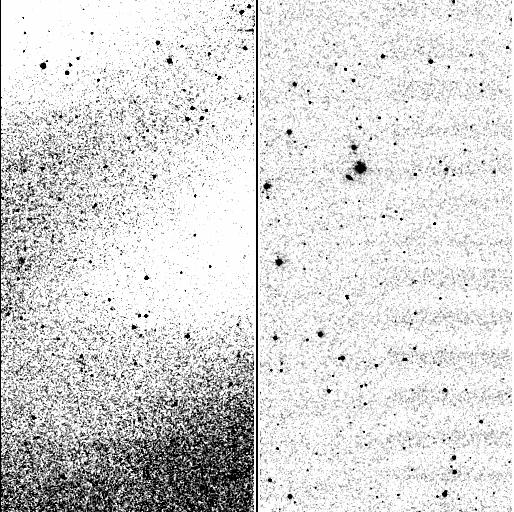
Fig. A.1.— Example of severe background ‘contamination’. The left image shows a case of severe airglow emission as seen in the H-band coadd. The airglow fluctuates on scales of ~1’. The right image shows a case of correlated ‘electronic’ (non-astronomically related) noise ridges along the right side of a J-band image. The ridges are the result of one array frame quadrant (NICMOS arrays have four quadrants) having elevated pixel values, which induce sinusoidal waves with drift scanning and co-addition of individual frames (i.e., the drift step size and quadrant size are constructively synchronized).
Fig. C.1.— The predicted stellar number density, log [stars per deg2] brighter than 14th mag at K, as a function of the galactic latitude. Two sets of solutions are shown, that of 50° galactic longitude (solid line) and 130° galactic longitude (dashed line). The dashed lines define regions of low (< 3.1), moderate (3.1 to 3.6) and high (>3.6) stellar number density. The estimated confusion noise (Dmag) as a function of the stellar number density is denoted by the dot-dashed line, assuming index a = 1, outlier cutoff q = 5s, and the beam size is 5".