i. Sky Coverage and Observation Parameters
| Target | Chameleon II | Type | star formation | Central Position1 | RA (J2000 deg) | Dec (J2000 deg) |
|---|---|---|---|
| 196.1528 | -77.1925 | ||
| Scan Length (deg) | No. of Tiles2 | No. of Scans3 | Approximate Area (deg2)4 |
| 1 | 22 | 49 | 2.8 |
| Tile Numbers5 | 340228-340238, 340328-340338 | ||
| Approximate Boundaries (J2000 deg)6 | |||
| RAmin | RAmax | Decmin | Decmax |
| 192.822 | 199.339 | -83.032 | -75.849 |
Notes to Table 1
1 - Geometric center of area covered by 6x
scans. Because of gaps in the scan
coverage of some fields, there may not
be a scan covering this location. See Figure 1.
2 - Number of unique pre-defined observation
areas (tiles) that cover this field.
3 - Number of 6x scans that cover the
tiles in this field. The number of scans may exceed the number of
tiles because some tiles were observed more than once.
4 - Approximate area is computed from
the number of tiles covering this field, accounting for RA and Dec
overlap between tiles. It is not the area defined by the approximate
field boundaries.
5 - 6° long
6x tiles have the same
number and cover the same region as the corresponding tile from the
main survey.
1° long 6x tiles are assigned
numbers in the range 30000-39999 for
northern observatory scans and 333000-349999 for southern observatory scans.
1° long 6x tile numbers
do not match tile numbers from the main survey.
6 - Approximate field boundaries define the
smallest rectangular region on the sky that encloses all scans
of this field. This region may not be completely covered by
6x observations because of gaps in the 6x coverage. See Figure 1.
|
|
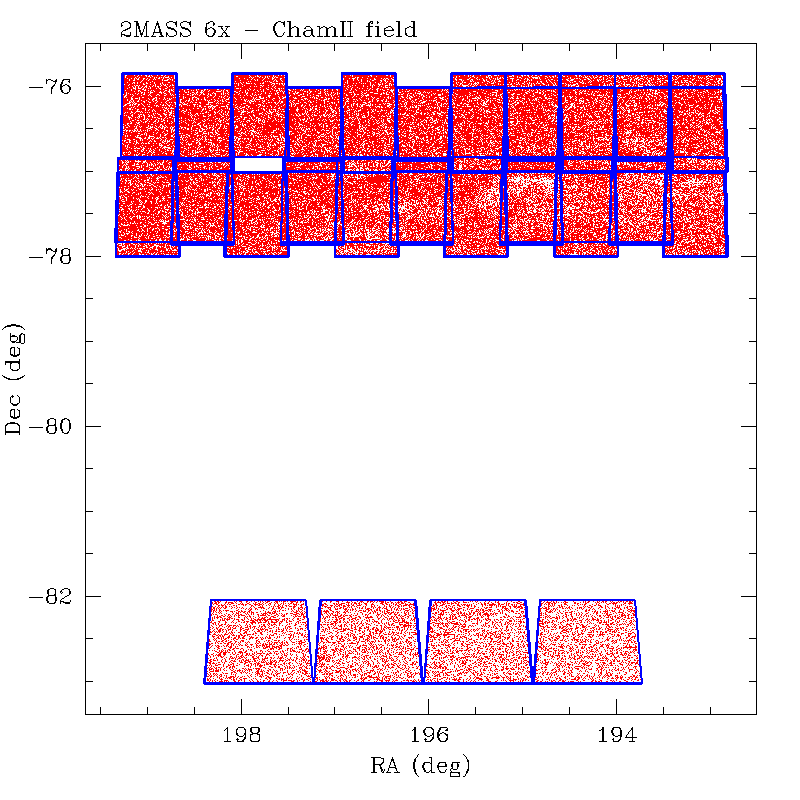
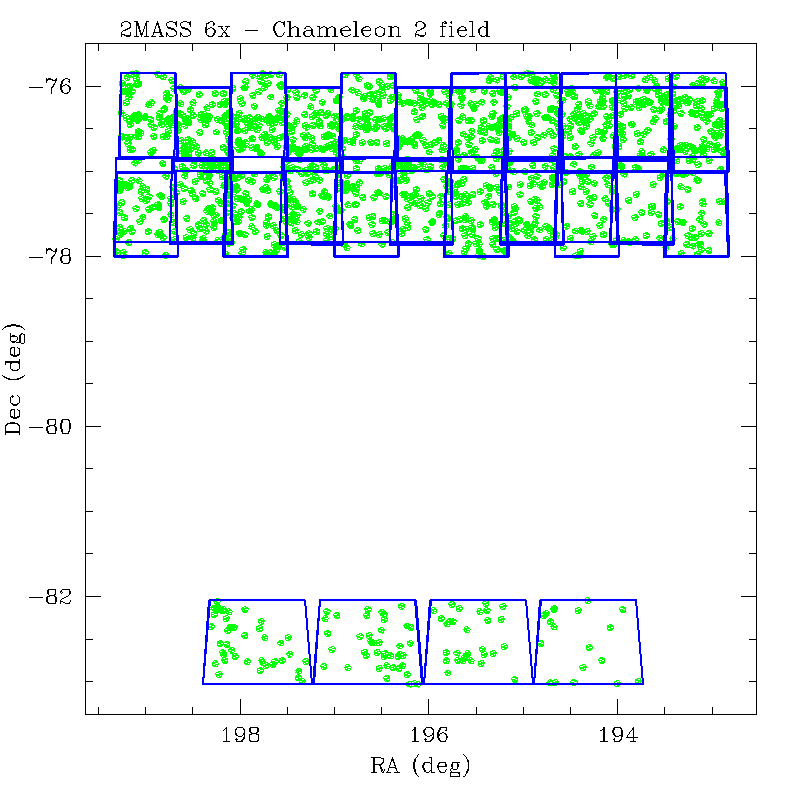
| Figure 1 - Sky map showing outlines of 6x Chameleon II scans in blue and distribution of 6x point source WDB extractions (red dots). Some tiles may have been observed more than once and have a corresponding higher density of extractions in the WDB. | Figure 2 - Sky map showing outlines of 6x Chameleon II scans in blue and distribution of 6x extended source WDB extractions (green dots). |
ii. Field-Specific Notes
The Chameleon II 6x field was targeted on the Chameleon II dark cloud complex as part of a program to probe lower masses in young stellar clusters.
The scan coverage of this field is fragmented into two bands of tiles separated by 4° as a result of the telescope commanding error that affected the 1° long 6x scans. Most of the observed area is concentrated in a northern region that covers an area approximately 1.4° (RA) by 2° (Dec). The cloud core is located just below the center of this region. The tiles in the northern area were each scanned twice in the 6x mode. There are four scans in the southern region that cover an area approximately 0.5° by 1°, but with RA gaps separating each scan. The southern region was observed only once.
The four scans in the southern part of the Chameleon II field
were incorrectly assigned tile numbers
that duplicate those of four tiles in the northern section:
340330, 340332, 340334 and 340336.
Therefore, caution should be used when selecting or
searching for observations in this region according to tile number.
iii. Working Database and Catalog Source Properties
| Full 6x Working DB1 | 6x "Catalog" subset2 | |
|---|---|---|
| Scans | 49 | 22 |
| Atlas Images | 588 | 264 |
| Point Sources | 252978 | 78840 |
| Extended Sources | 1971 | 256 |
Notes to Table 2
1 - "Full 6x Working DB" refers to
the total number of Scans and Atlas Images available from all 6x observations
of this field. The "Point Source" and "Extended Source" entries refer
to the total number of sources extracted from all observations of
this field in the respective 6x Point and Extended Source
Working Databases.
2 - "6x Catalog Subset" refers to
the subset of all scans covering this field
that were selected to constitute a single, unique coverage of the field
(A3.6.b), the images from those scans,
and the subset of all source extractions from the selected
scans that satisfy the "6x-PSC" and "6x-XSC" quality selection
criteria described in A3.6.c.
The "6x Catalog subset" can be identified in the 6x Scan and Image
Metadata tables, and Point and Extended Source WDB tables by selecting
entries with "cat=1".
| Extracted Source Counts and Statistics | |
 |
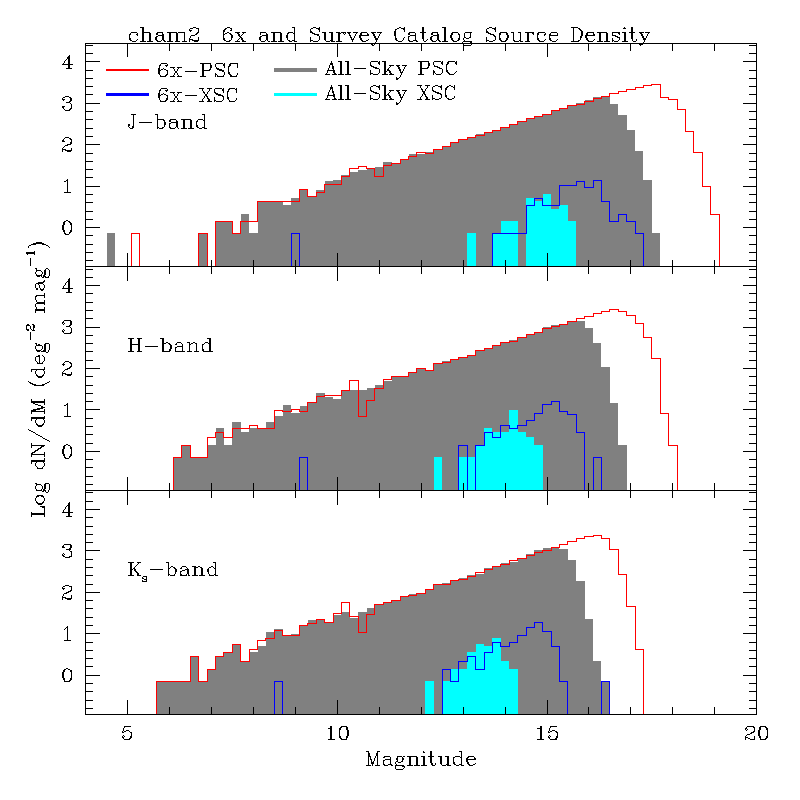 |
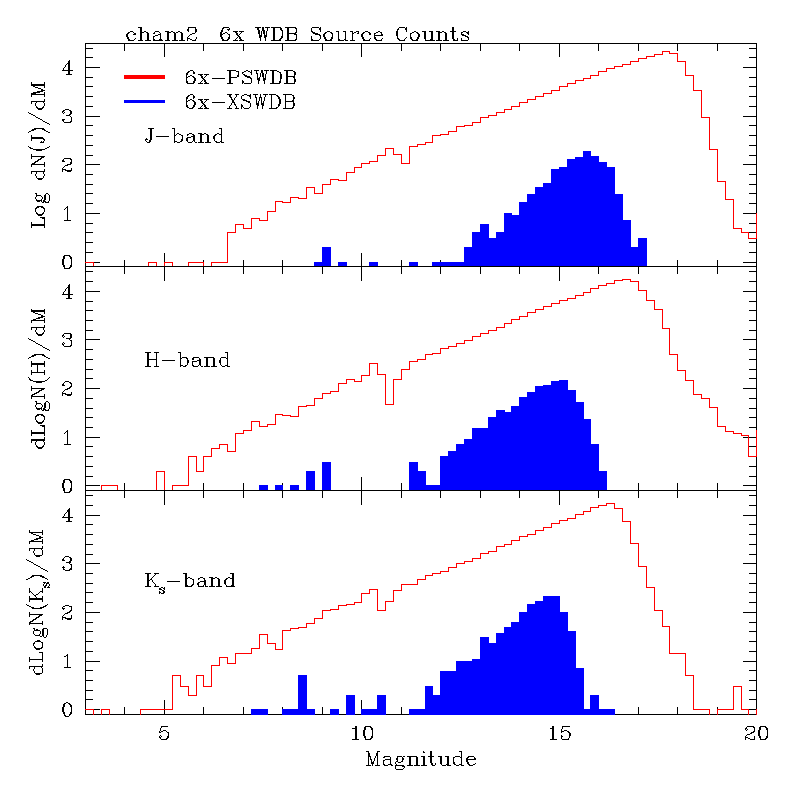
| Figure 3 - Full 6x point and extended source Working Database source counts as a function of magnitude. Point source counts are shown by the red line and extended source counts are the blue shaded region. The default magnitudes are used for point sources, and the Ks=20 mag arcsec-2 elliptical isophotal magnitudes are used for extended sources. | Figure 4 - Differential source densities as a function of magnitude for the 6x Point and Extended Catalogs compared with those for the All-Sky PSC and XSC. 6x PSC and XSC counts are shown by the red and blue lines, respectively. All-Sky PSC and XSC counts are shown in the grey and cyan shaded regions. |
| Photometric Properties | |
 |
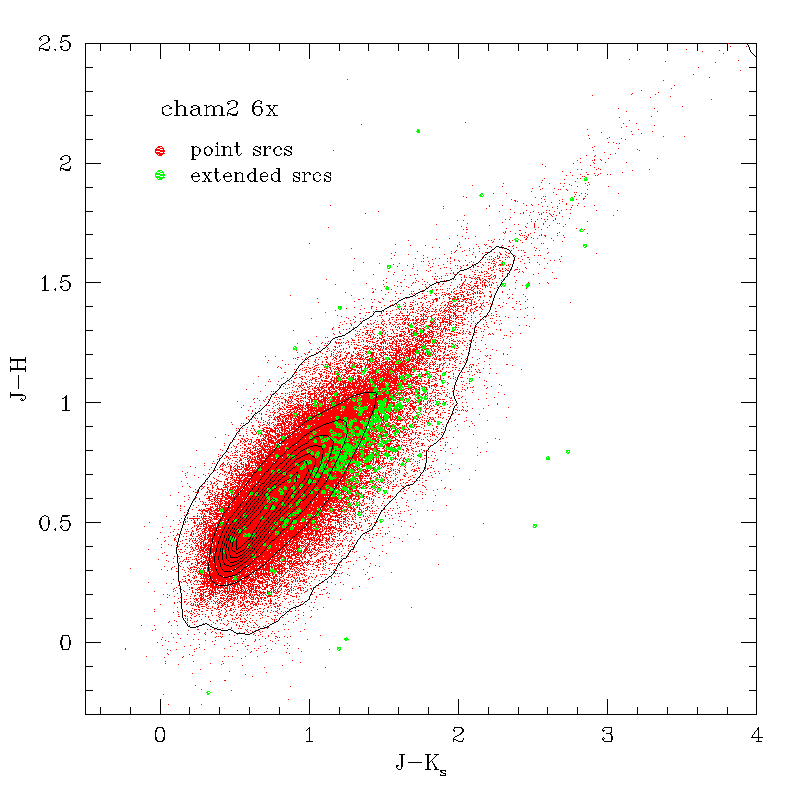 |
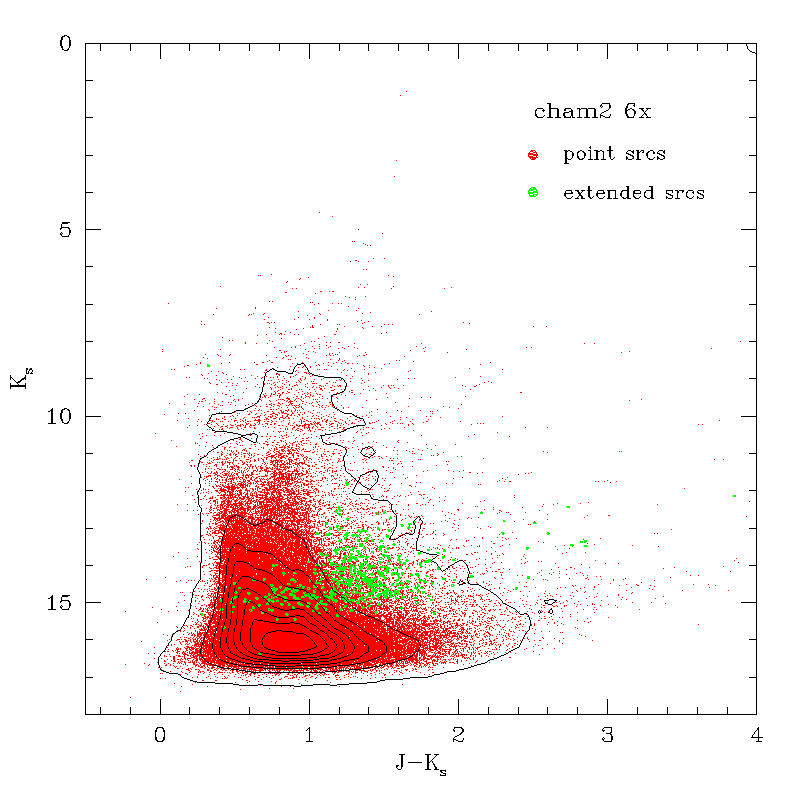
| Figure 5 - Color-magnitude diagram for extractions in the point and extended source 6x WDBs in the Chameleon II field. Point sources are shown as small red dots and extended sources as larger green dots. The black contours trace the density of point sources. The horizontal discontinuity in the point source distribution near Ks~10.5 mag in the color-magnitude diagram is caused by the sensitivity gap between the 51 ms R1 and 7.8 s R2-R1 exposures in the 6x data. | Figure 6 - Color-color diagram for extractions in the point and extended source 6x WDBs in the Chameleon II field. Point sources are shown as small red dots and extended sources as larger green dots. The black contours trace the density of point sources. |
 |
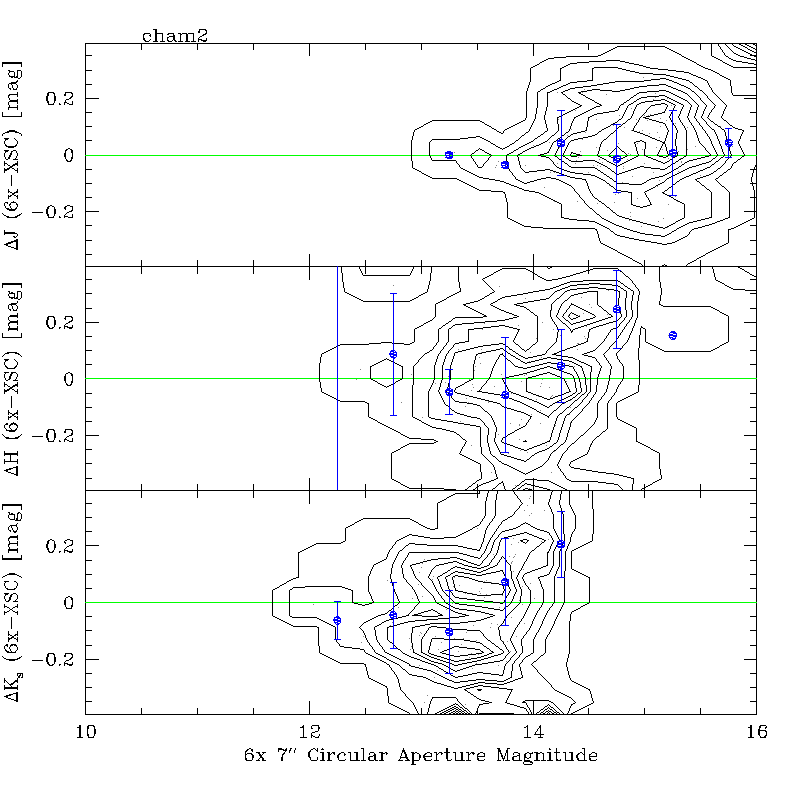 |
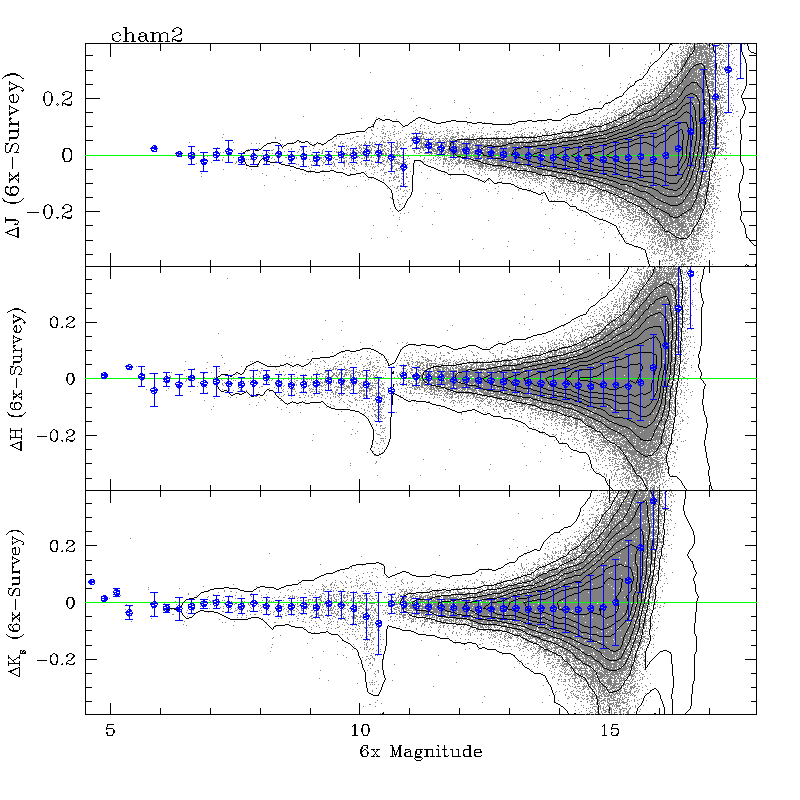
| Figure 7 - Differences between 6x and main survey point source photometry plotted as a function of 6x source default magnitude. Black contours trace the density of individual sources that are shown as light grey points. The large blue points and error bars show the trimmed average and RMS of the 6x-survey magnitude differences for all sources in 0.25 magnitude wide bins. | Figure 8 - Differences between 6x and main survey extended source photometry in 7" circular apertures ([jhk]_m_7) plotted as a function of 6x extended source magnitude. Black contours trace the density of individual sources that are shown as light grey points. The large blue points and error bars show the trimmed average and RMS of the 6x-survey magnitude differences for all sources in 0.25 magnitude wide bins. |
[Last updated: 2006 June 20; by R. Cutri]