 at J, H, and
Ks, respectively) to define the faint end of the lowest bin in each
waveband.
at J, H, and
Ks, respectively) to define the faint end of the lowest bin in each
waveband.
i. Completeness
The Level 1 Specifications call for 90% completeness at galactic latitudes
more than 30° from the Galactic plane. The specification indicates that
completeness and reliability be calculated "per magnitude in the faintest
magnitude bin." 2MASS has used the Level 1 sensitivity specification (15.0,
14.3, and 13.5 mag for 10- at J, H, and
Ks, respectively) to define the faint end of the lowest bin in each
waveband.
Two different analyses show that the XSC significantly exceeds the completeness specification, with a completeness of ~95-99%, significantly above the requirement of 90%.
Two analyses have measured the completeness of the XSC:
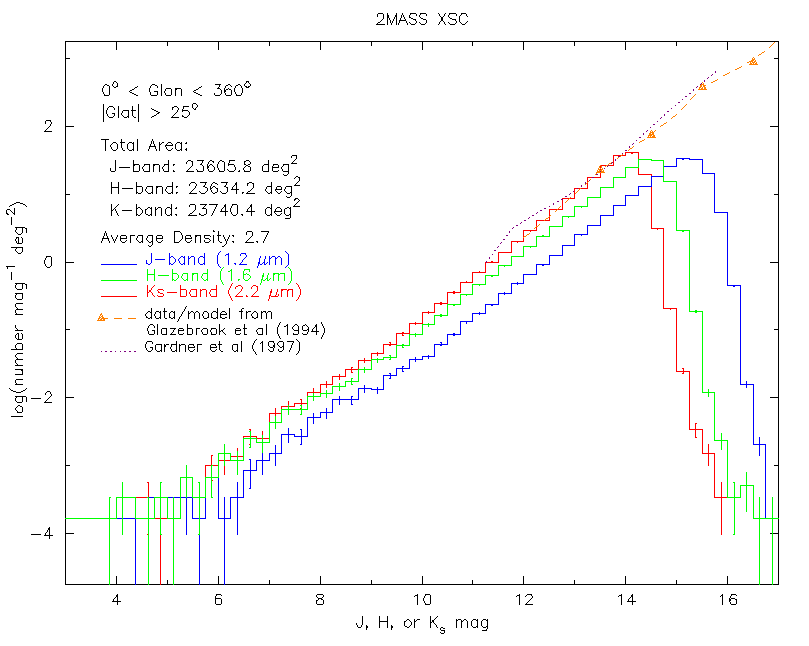
T. Jarrett (IPAC) has carefully plotted the logN/logS curve for the XSC at galactic latitudes > 25° from the Galactic plane, taking into account unsurveyed areas, due to the several sources of coverage holes (see II.6f). Figure 1 presents the curves for each band, along with previous K-band data from Glazebrook et al. (1994, MNRAS, 266, 65) and Gardner et al. (1997, ApJ, 480, L99).
|
The 2MASS isophote used was the fiducial elliptical isophotal (20 mag arcsec-2 in the Ks band) integrated fluxes. Glazebrook et al. used fixed apertures of 8´´. In the magnitude range compared here, these apertures are roughly comparable, so that any shifts in the curves, due to photometric differences between the two datasets, are small. Furthermore, the photometric system correction between the UKIRT system and the 2MASS system is only ~0.007 mag for typical galaxies with J-K~1 mag, and so can be ignored.
The 2MASS logN/logS for Ks is in virtually complete agreement with the previous infrared data from Glazebrook et al. at K of 12.5 to 13.5 mag, the faintest magnitude bin at K used for the Level 1 specification comparison. (The brightest Glazebrook et al. data point was at Ks = 13.5 mag, with a model fit to brighter magnitudes.) The total number of galaxies per square degree in this magnitude bin predicted by the Glazebrook et al. values is 10.0 ± ~1.0. The total number of galaxies per square degree in the XSC in this magnitude bin is 11.0617 ± 0.0005. From these numbers, the nominal completeness of the XSC is 100%, with a 95% confidence lower limit of 92%. (See Notes.)
No comparison was made to the Gardner et al. data, since they are very uncertain at bright magnitudes, as can be seen in Figure 1.
For more information, see 2MASS XSC Source Counts.
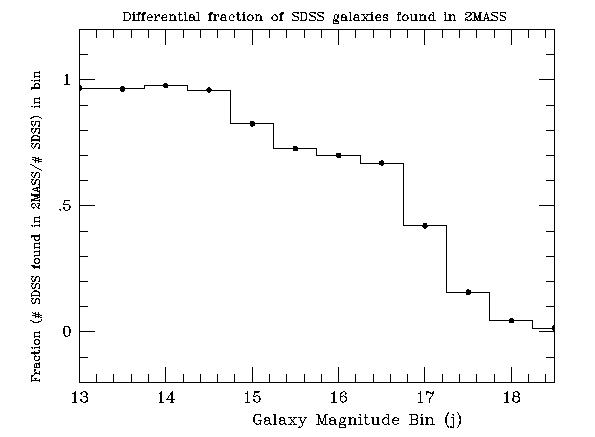
J. Huchra et al. have done an extensive comparison of optical catalogs to the XSC globally. While this analysis cannot give direct estimates of the infrared completeness, due to the variable infrared/optical colors for individual galaxies, it is an excellent check for problems in completeness that might escape the previous comparisons. In particular, it checks for problems over a broad range of infrared brightness.
The comparison overall looks quite good. The match rate between these catalogs is uniformly high at nearly all optical magnitudes at which one expects a source to appear in the XSC. The match rate is 90-94% for the Updated Zwicky Catalog, 95-97% for the SDSS, and 99-100% for the APM/2dF Survey. Almost all of the missing objects from the Updated Zwicky Catalog are of low surface brightness that were expected to be missing from the XSC.
For example, Figure 2 shows the match rate with SDSS vs. the SDSS blue mag j (not the 2MASS J band).
|
| Figure 2 |
For typical galaxy colors, SDSS j = 13 mag corresponds with 2MASS J = 15 mag.
The other feature of the comparisons was that very bright galaxies have a somewhat lower match rate, as expected due to problems with the size of these galaxies compared to the 2MASS arrays. The Large Galaxy Atlas is progressively "fixing" the brighter galaxies.
For more information, see 2MASS Checks VS External Galaxy Catalogs.
[Last Updated: 2003 Jan 31; by T. Jarrett and T. Chester]
Notes on the Glazebrook et al. Comparison
Return to VI.5.