The Level 1 Specifications call for a 10- detection (0.109 mag) at the
following magnitude levels: J = 15.8, H = 15.1, and Ks = 14.3 mag for
unconfused sources outside of the Galactic Plane (|b| > 10°).
detection (0.109 mag) at the
following magnitude levels: J = 15.8, H = 15.1, and Ks = 14.3 mag for
unconfused sources outside of the Galactic Plane (|b| > 10°).
The 2MASS observing strategy required the observation of a 1°-long
calibration Tile several times during a night of observation.
The calibration session involved six repeated observations of the
calibration Tile and thus, six observations of each star within
the Tile. These repeated observations give a direct measure
of the instantaneous sensitivity of the system.
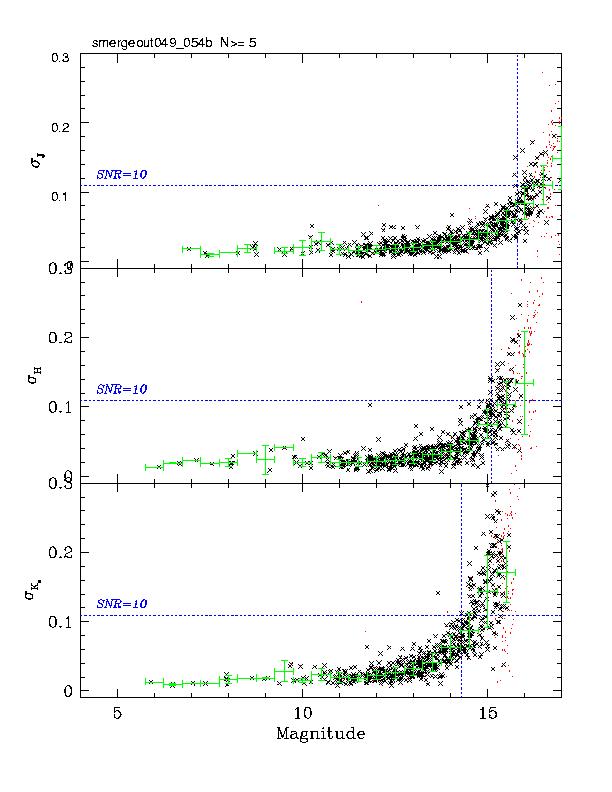
Figure 1
shows the results of one of these calibration sessions.
Each point in the figure is the rms of one
of the stars in the calibration field as a function of the
star's magnitude. The green bars are the ensemble statistics
for each half-magnitude bin. The point at which the ensemble statistics
cross the 10- line marks the sensitivity of that
particular calibration set.
Since each of these calibration sessions
sample the survey sensitivity as a function of other
survey variables -- particularly background and seeing --
the ensemble of calibration observations permits 2MASS to
map its real-time sensitivity to the instantaneous background
and seeing. (This link points to a document
which describes this process in excruciating detail).
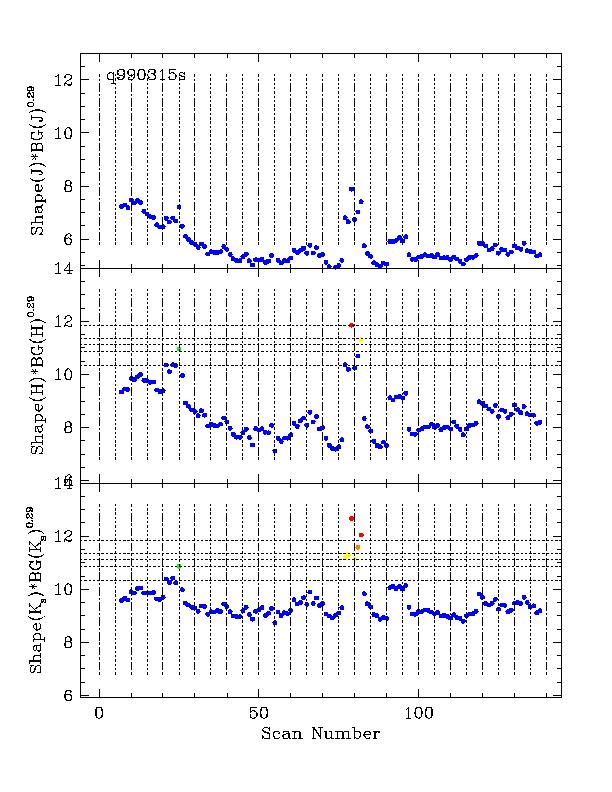
Background and seeing values are extracted for each of the 2MASS science Tiles, directly measuring their limiting sensitivity on a tile-by-tile basis. Figure 2 shows a nightly summary of the sensitivity of both the science and calibration data for the same random night of 2MASS data. The horizontal lines in the figure are thresholds for scoring data, based on the knowledge of sensitivity variation from the calibration history of the project as described in the paragraph above. Points falling below the middle horizontal dashed line exceed the Survey's sensitivity targets (several lines appear, because the data can receive a range of sensitivity scores to aid in assigning priority for re-observation. The lines are off of the top of the J-band figure -- J-band consistently exceeds the Survey's sensitivity requirement). The 2MASS Quality Assurance review process (see IV.10) permitted the rescheduling of Tiles with sub-threshold sensitivity in any one of the bands. The histogram of achieved sensitivity for the Tiles selected for final release, shown in Figure 3, indicates that the sensitivity requirement was met for virtually all tiles in all bands, with a small number of exceptions lacking 0.1-0.2 mag in sensitivity. Applying the estimation of instantaneous sensitivity to each tile yields a complete 2MASS sky map of the variation of sensitivity in each waveband.
The 2MASS All-Sky Release dataset meets the Survey sensitivity requirements, because the sensitivity of each Tile was determined shortly after the time of observation, as part of routine Quality Assurance, and poor-sensitivity tiles were reobserved until they could be replaced with data that met the specifications.
The above statement would be rigorously true were it not for the fact that a small number of Tiles either could not be re-observed, or had poor sensitivity in every re-observation (as reflected in the small extensions of the histograms in Figure 3 to sensitivity levels just below the Level 1 threshold).
 |
 |
 |
| Figure 1 | Figure 2 | Figure 3 |
[Last Updated: 2003 March 21; by M. Skrutskie]
Return to VI.3.