
The 2MASS XSC includes sources that belong or are in close proximity to the Milky Way (e.g., globular clusters, LMC/SMC, ... etc). This includes a diverse variety of objects and ISM phenomena such as:
Examples of Galactic extended sources can be found throughout Section IV of the Explanatory Supplement, and are compiled in the XSC Gallery, the 2MASS Gallery, and even a few can be found in the 2MASS Large Galaxy Atlas.
Nearly all extended Milky Way objects fall within approximately 5 degrees of the plane of the Galaxy. The exceptions are the giant molecular clouds that extend above the Plane (e.g., Orion, Taurus, Rho Ophiuchus), globular clusters hovering in the spheroid of Milky Way, and comets in the Solar System. Resolved nebulosity in the Large and Small Magellanic Clouds also fall into this category, although they are not strictly part of the Milky Way. Extended Galactic objects can be seen easily in the 2MASS XSC 3-color integrated flux sky plot shown in Figure 1 as the band of redder objects following the Galactic Plane. These objects are both intrinsically red (e.g., HII regions are dominated by emission bands in the 2 μm window) and dust-reddened. Since most are confined to the Plane, a Galactic sky projection of the XSC number counts gives the best view of their extent and distribution, as shown in Figure 2.
 |
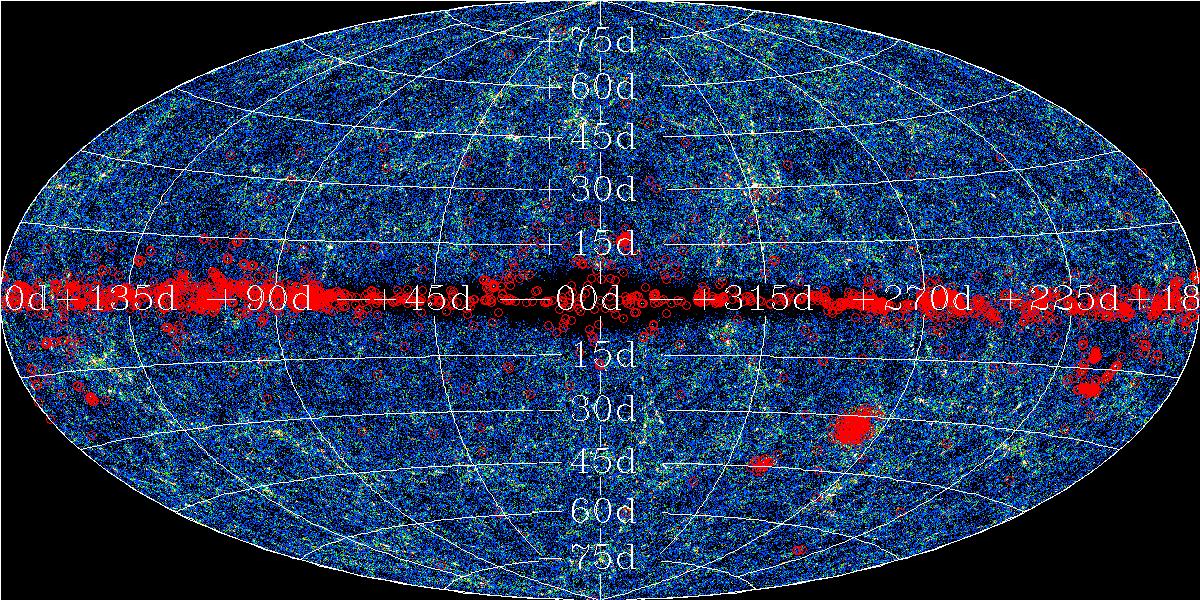 |
| Figure 1 -Three-color integrated flux map of 2MASS XSC sources in an Equatorial aitoff projection. The integrated flux in the J, H and Ks bands is computed in 18' pixels. XSC sources in the range 8<Ks14 mag are included in the computation. | Figure 2 -The distribution of XSC sources seen in a Galactic aitoff projection. The limiting magnitude is 13.5 in Ks, where the number counts are shown with a false-color scale to enhance the contrast. Sources identified as Milky Way in origin are circled in red. Note the prominent molecular clouds: rho Oph, Orion and Taurus, and the clustering of extended sources in the LMC/SMC galaxies. |
It is not possible to identify Milky Way extended sources in the XSC with 100% reliability based solely on catalog properties. However, Milky Way extended sources are characterized by the following properties:
We have identified some 8,000 sources in the XSC that are probably Milky Way in origin, with a smaller subset of 3,712 sources highly probably Galactic in nature. The smaller table of Milky Way sources is given here and are denoted in the above projection and the color plots to follow.
The density of the 1.65 million XSC objects in the J-H vs. H-Ks color-color plane is shown in the Hess diagram in Figure 3. XSC sources that have been identified as non-galaxies are circled in red in this diagram; their color distribution is much broader than the majority of XSC objects (galaxies), with most being redder than the galaxies.
See also section II.3.d.iv that describes general color distributions of the XSC.
 |
| Figure 3 - J-H vs. H-Ks color-color diagram for the 2MASS XSC, made using the fiducial elliptical isophotal (20 mag arcsec-2 in the Ks band) magnitudes. The Hess diagram shows the density of points for the full XSC. Objects identified as Galactic sources are circled in red. The red arrow indicates the color shift expected for 1 magnitude of visual extinction. |
Figures 4-7 show the J-H vs. H-Ks color-color diagrams for XSC sources, sub-divided according to the stellar number density, which measures the surface density of stars against which the extended object is projected. As in Figure 3, all XSC sources in each density range is shown by the Hess diagram, and those sources identified as Galactic are circled in red.
 |
 |
 |
 |
| Figure 4 - density < 3.2 | Figure 5 - 3.2 < density < 3.6 | Figure 6 - 3.6 < density < 4.0 | Figure 7 - density > 4.0 |
| J-H vs. H-Ks color-color diagrams for 2MASS XSC sources in four different ranges of stellar density. All XSC sources in each respective density range are shown by the Hess diagrams in each plot, and those sources identified as Galactic are identified by the red circles. The red arrows are the reddening vectors for AV=1 mag. | |||
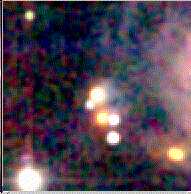
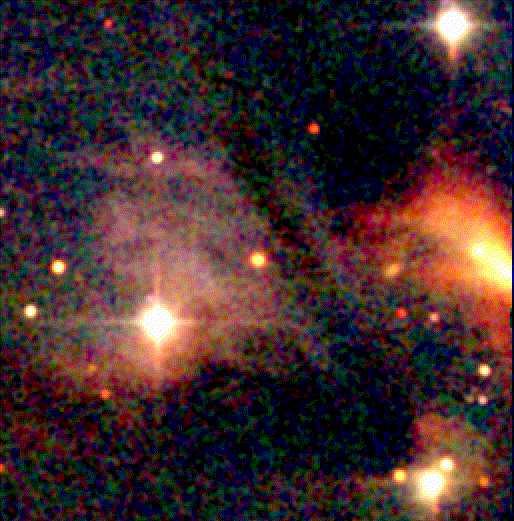
Figure 8-11 show 3-color images of a selection of "red" Milky Way objects in the XSC.
 |
 |
 |
 |
| Figure 8 - Nebulosity | Figure 9 - Young Stellar Objects | Figure 10 - HII Regions | Figure 11 - Anonymous source at (α,δ=0.101620, -12.763147) |
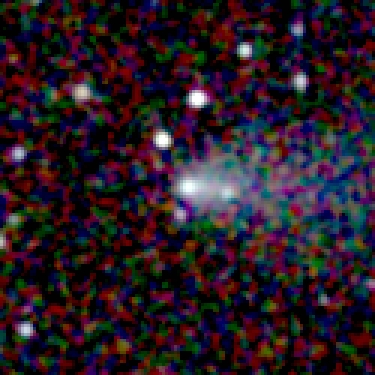
Figures 12 and 13 show 3-color images of two "blue" Milky Way objects; both are comets in the Solar System.
 |
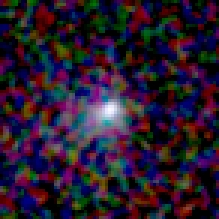 |
| Figure 12 - Comet 52P/Harrington-Abell (α,δ=92.836586,+36.640507) | Figure 13 - Comet Comet 88P/Howell (α,δ=213.217377, -15.222510) |