A comparison of the current aperture (DAOPHOT) and PSF-fitting (KAMPHOT) photometry algorithms in the provisional 2MAPPS has been carried out using the 10 repeated scans of the M92 region in the 1 June 1994 data set. We gauge the relative merit of each algorithm by how well measurements of the same objects agree in the multiple scans. Repeated observations such as these should provide one of the best estimates of both statistical and total systematic photometry error since the sources will have been measured at slightly different times at slightly different positions on the Protocam array.
All point sources detected in either 9 or 10 out of the 10 M92 scans were
identified, and the average aperture and psf-fit K magnitudes and
standard deviations of those magnitudes were compiled.
Plots were generated that show the standard deviation for each set of
star measurements as a function of its average magnitude. Figure 1
shows this relationship for the KAMPHOT measurements. The scatter
in standard deviations for a given average magnitude is generally small,
<0.02
magnitudes and
standard deviations of those magnitudes were compiled.
Plots were generated that show the standard deviation for each set of
star measurements as a function of its average magnitude. Figure 1
shows this relationship for the KAMPHOT measurements. The scatter
in standard deviations for a given average magnitude is generally small,
<0.02 for K
for K 12
12 , increasing to about 0.05
 at K
at K =14
=14 .
To characterize
the repeatability of the photometry versus brightness, the mean
standard deviation for all sources in 0.5
.
To characterize
the repeatability of the photometry versus brightness, the mean
standard deviation for all sources in 0.5 wide bins were then generated.
Plots of the resulting relationships for the psf-fit and aperture measurements
are shown in Figures 2 and 3, respectively.
wide bins were then generated.
Plots of the resulting relationships for the psf-fit and aperture measurements
are shown in Figures 2 and 3, respectively.
These figures indicate the following:
 in 10
repetitions for 8<<12
in 10
repetitions for 8<<12 . The dispersion increases as
 SNR
SNR for >12
 , and is 8% at K
 =14
=14 and 15% at K
 =15
=15 .
.
 12
12 . For >12
 , dispersion in the photometry
increases more rapidly than for the psf-fitting photometry.
, dispersion in the photometry
increases more rapidly than for the psf-fitting photometry.
 =13.5
=13.5 .
.
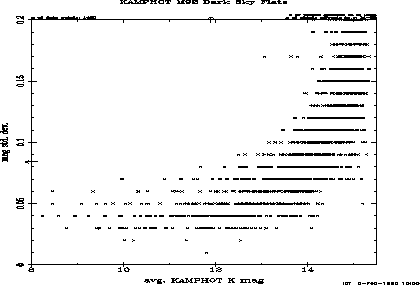
Figure 1: Repeatibility of KAMPHOT psf-fit photometry for point sources
detected in 9 or 10 out of 10 scans of the M92 region in June 1994.
The standard deviation in observed K magnitude
is plotted against the average K
magnitude
is plotted against the average K magnitude for each object.
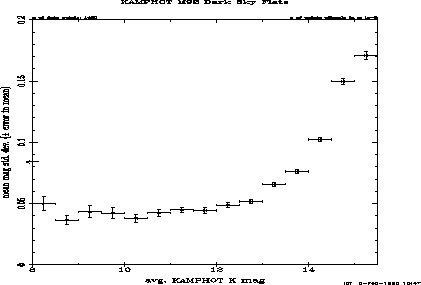
Figure 2: Average repeatibility of KAMPHOT psf-fit photometry for point sources
detected in 9 or 10 out of 10 scans of the M92 region in June 1994.
The mean standard deviation in observed K magnitude for all sources within
0.5
magnitude for all sources within
0.5 wide magnitude bins is plotted against the average K
 magnitude
for that bin.
magnitude
for that bin.
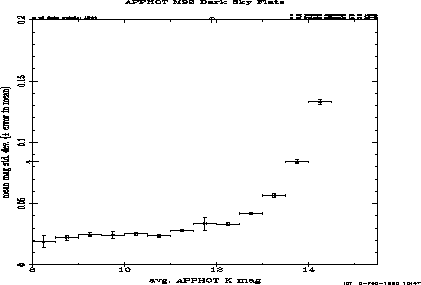
Figure 3: Average repeatibility of DAOPHOT aperture photometry for point
sources detected in 9 or 10 out of 10 scans of the M92 region in June 1994.
The mean standard deviation in observed K magnitude for all sources within
0.5
magnitude for all sources within
0.5 wide magnitude bins is plotted against the average K
 magnitude
for that bin.
magnitude
for that bin.