It has been nearly 30 years since the last large-area near-infrared survey of
the sky was carried out. The Two Micron Sky Survey (TMSS; Neugebauer &
Leighton 1969) scanned 70% of the sky and detected ~5,700 celestial sources of
infrared radiation. Since that time there has been a revolution in the
development of infrared detector technology. New, large format, sensitive
array detectors can now detect astronomical objects over 100
million times fainter than those detected in the TMSS.
The Two Micron All Sky Survey (2MASS) project is designed to close the gap
between our current technical capability and our knowledge of the
near-infrared sky. In addition to providing a context for the
interpretation of results obtained at infrared and other wavelengths, 2MASS
will provide direct answers to immediate questions on the large-scale
structure of the Milky Way and the Local Universe. The optimal use of the
next generation of infrared space missions, such as HST/NICMOS, the
Space Infrared Telescope Facility (SIRTF), and the Next Generation Space
Telescope (NGST), as well as powerful ground-based facilities, such as Keck I,
Keck II, and Gemini, require a new census with vastly improved sensitivity
and astrometric accuracy than that previously available.
To achieve these goals, 2MASS is uniformly scanning the entire sky in three
near-infrared bands to detect and characterize point sources brighter than
about 1 mJy in each band, with signal-to-noise ratio (SNR) greater than 10,
using a pixel size of 2.0". This will achieve an 80,000-fold improvement in
sensitivity relative to earlier surveys.
2MASS uses two new, highly-automated 1.3-m telescopes, one at Mt. Hopkins, AZ,
and one at CTIO, Chile. Each telescope is equipped with a three-channel
camera, each channel consisting of a 256×256 array of HgCdTe detectors,
capable of observing the sky simultaneously at J (1.25 microns), H (1.65
microns), and Ks (2.17 microns).
The immediate scientific benefits from the 2MASS survey include:
The northern 2MASS facility began routine operations in 1997 June, and the
southern facility in 1998 March. As of 1998 December, the time of the 2MASS
Sampler Data release, nearly 50% of the sky has been observed
(perhaps 10% of that area will be reobserved because of non-optimal
survey conditions). Analyses of the data from the ~20% of the sky that
has been processed show that they meet and often exceed the
Level 1 Science Requirements for the Survey.
The first large incremental 2MASS data release, covering over
3,000 deg2 of sky, is planned for
the spring of 1999. The objective of the 2MASS Sampler is
to introduce the astronomical community to the content and format of the
2MASS datasets, and to the web-based Access Tools, and to
provide an opportunity
for the 2MASS project to receive community feedback in preparation for
Spring release. Finally, the Sampler is intended to enable
the community to carry out scientific investigations with the
2MASS dataset for the first time.
The 2MASS Sampler accomplishes this introduction with a small representative
set of data drawn from observations obtained
at the Northern 2MASS facility on the night of 1997 November 16 UT
("971116n", hereafter). Approximately 63 deg2 of northern sky
were covered by these observations. The Sampler release datasets
include 5,658 compressed 512×1024 pixel (1"/pixel) Atlas Images
in the three survey bands (the Atlas Images are compressed with the task
hcompress), and Catalogs containing positional and
brightness information for 227,197 Point and 2,133
Extended sources
selected using safe, but not overly conservative, thresholds, to provide
a realistic example of the data the community can expect to find in the
larger data releases to come. Also provided on the 2MASS Sampler CD-Rom
are a selection of JPEG renditions of composite three-color Atlas Images and
Image Mosaics drawn from the
2MASS Image Gallery.
It should be emphasized that the products included in the 2MASS Sampler,
as well as the upcoming large incremental data releases, are
the results of the best-effort processing of data from the Survey.
These data do not yet benefit from all experience that will be gained
over the full Survey, nor have they undergone all the rigorous analyses that
traditionally accompany data releases at the end of missions. However,
the benefits of releasing data to the community now exceed the potential
risks, and it is hoped that the feedback on the data products and
documentation from the community will
ultimately contribute to a better final product. The knowledge gained
as the Survey continues, and from the feedback received from users
will be incorporated when the entire 2MASS dataset is reprocessed
at the completion of the Survey observations. Users are recommended to
review the various caveats below.
The characteristics of the Sampler Point Source catalog are
The selection criteria for the Extended Source catalog are
The sky coverage of the Sampler in equatorial coordinates is shown in
Figure 1; in galactic coordinates, in
Figure 2.
Up to 10% of Point and Extended Source Catalog
objects may be duplicates because of scan overlaps. Differential point
source counts for the 2MASS Sampler, from which extended sources have
not been removed, are shown in
Figure 3, where the blue line denotes J-band; green line, H-band; and,
red line, Ks-band.
Photometric repeatability for point sources in the P161-D calibration field
are shown in
Figure 4. The black crosses represent the RMS dispersion about the
mean magnitude plotted versus the mean magnitude of all sources detected at
least 16 out of the 18 times the field was observed during the night.
Red points denote sources detected fewer than 16 out of 18 times.
The green bars indicate the mean RMS averaged in 0.5-mag bins. The top panel
shows data for the J-band; H-band is in the center panel; and,
Ks is in the bottom panel. The horizontal blue lines indicate
signal-to-noise SNR=10 levels, and the vertical blue lines indicate the Level
1 Requirement magnitudes for SNR>10. These data satisfy the
requirements for photometric sensitivity and precision in all three bands.
The differential completeness (left) and reliability (right) are plotted as a
function of magnitude derived from the observations of the FS4 calibration
field in
Figure 5. J, H, and Ks values are shown in the top,
middle and bottom panels, respectively. The dashed vertical lines indicate
the magnitudes specified in the Level 1 Science Requirements for 99%
completeness and 99.95% reliability. Note that the vertical scale on these
plots ranges from 0.8 to 1.1.
Figure 6 shows the JHKs color-color diagram for the
209,396 3-band-detected point sources (yellow=SNR(Ks)>40;
blue=SNR(Ks)>20; black=SNR(Ks)<20); red and green
lines indicate dwarf and giant tracks, respectively, from Bessell & Brett
[1988, PASP, 100, 1134]; the diagonal black line indicates the reddening
vector for AV=5 mags).
Figure 7 shows the JHKs color-color diagram for the
2MASS Sampler Extended Source Catalog. The black points show extended sources
that are found in the Sampler. For informational purposes only,
red triangles indicate double stars, and red crosses indicate triple stars.
The multiple stars are not included in the Extended Source Catalog. The
green lines show the Bessell & Brett (1988) dwarf and giant star tracks.
Also overlaid on the plot are the K-correction curves for SAB (magenta)
and elliptical (grey) galaxies. The tickmarks on those curves indicate
increments of 0.1 in redshift, starting at z=0 on the left. The dashed
diagonal blue line indicates how a color criterion can be applied to
discriminate between galaxies and multiple stars.
The differential extended source counts for 2MASS Sampler are shown in
Figure 8
(blue line=J; green line=H; and, red line=Ks).
The internal RA (top) and DEC (bottom) positional
repeatability of all sources in the P161-D calibration field are shown in
Figure 9
versus Ks magnitude. As in Figure 4, the black crosses denote
sources detected at least 16 out of the 18 times the field was scanned,
red points indicate sources detected less than 16 times, and the green bars
show the average positional RMS in 0.5-mag bins. The full scale in each panel
is 0.5". The internal positional consistency is outstanding.
Finally, the distribution of position residuals for 1204
ACT stars observed on
971116n are shown in Figure 10.
Red lines show the distribution of the difference between catalog and
positionally-reconstructed RA, and blue lines show the DEC differences
(see the section on 2MASS positional reconstruction
below). The 1-sigma values for each distribution are ~0.1".
The Sampler is being released to the community via a CD-ROM
and also on-line via the IRSA CatScan and
Survey Visualizer Web interfaces.
The Two Micron All Sky Survey is a joint project of the University
of Massachusetts and the Infrared Analysis Processing and Analysis
Center (JPL/Caltech). The University of Massachussetts is responsible for
the overall management of the project, the observing facilities
and the data acquisition. The Infrared Processing and Analysis Center is
responsible for data processing, data distribution and data archiving.
Observing facilities at Mt. Hopkins and Cerro Tolo are operated by the
Smithsonian Astrophysical Observatory (SAO) and the National Optical
Atrononomy Observatories (NOAO) respectively.
2MASS is funded by the National Aeronautics and Space Administration (NASA)
and the National Science Foundation (NSF).
The 2MASS Point Source Catalog is dedicated to the memory of Dr. Robert M.
Light (1959-1998).
Source designations for objects in 2MASS Catalogs should be given as:
2MASxx Jhhmmss[.]s � ddmmss.
The brackets and period are not explicitly in the name, and are shown
above only to illustrate that the last digit before the declination
sign is tenths of RA
seconds. The xx in the prefix corresponds to one or two characters that
will vary depending upon the catalog from which the object was taken.
For the 2MASS Sampler Catalogs, the prefixes are as follows:
The 2MASS designation is not tabulated explicitly for entries
in the 2MASS Sampler Catalog, but it can be constructed from the
source RA and DEC. Sources will be tagged with their unique identifiers
beginning with the large Spring 2MASS data release. Please note that
the "cntr" field listed for each entry in the Sampler Point and
Extended Source Catalogs is not a valid or unique 2MASS source
identifier! Users should not use it as a means of identifying
or reference 2MASS objects.
Researchers are asked to include the following acknowledgment in any
published material that makes use of data products from the Two Micron
All Sky Survey (2MASS):
The contents of the 2MASS Sampler are Point Source and Extended Source
Catalogs, and compressed Atlas Images. On the CD-ROM version of the
Sampler release the contents also include the hcompress software, to
uncompress the Atlas Images, and an Image Gallery, culled from the
image gallery on the IPAC 2MASS
webpage.
The 2MASS Sampler Point Source Catalog contains position and brightness
information for 227,197 objects. Note that up to 10% of Point Source Catalog
objects may be duplicates because of scan overlaps. The format of the catalog
records is given here.
The 2MASS Sampler Extended Source Catalog contains position, brightness, and
basic shape information for 2133 objects. Note that up to 10% of Extended
Source Catalog objects may be duplicates because of scan overlaps.
The format of the catalog
records is given here.
The Sampler includes 5,658 compressed 512×1024 pixel (1"/pixel)
Atlas Images in the three survey bands. These Atlas FITS Images have been
compressed with the task
hcompress.
This is a lossy compression routine, so the uncompressed images are not
recommended for photometric uses.
The Atlas Images included in the Sampler have been compressed with the
task hcompress.
Hcompress is the image compression package written by Richard L. White
for use at the Space Telescope Science Institute.
The task is a very good and fast compression algorithm for astronomical
images. More information, including full documentation, about the task can be
found on the STScI webpage. The CD-ROM Sampler release provides both the
decompression binary for Unix machines and the compression source code.
The gallery images on the CD-ROM version of the Sampler
are three-band composites constructed from 2MASS Atlas Images throughout the
sky, and are in JPG format. These images provide an indication of the types
of objects that will
be available in future large incremental data releases of both northern and
southern data. They are infrared images and therefore must be mapped into
false colors: J light (1.2 µm) into blue, H light (1.6 µm) in green,
and Ks light (2.2 µm) into red. The Atlas Images are produced
in the 2MASS Production Processing System. For all images, north is up and east
is to the left. They are of various solar system, Galactic, and extragalactic
objects, including asteroids, star-forming regions, and nearby galaxies and
galaxy groups. Each gallery image carries the title of the object which it
depicts. The gallery images typically cover areas with dimension 8'×11',
although larger image mosaics can cover areas of more than 1°
on a side. The gallery images are typically about 200 kB to 1 MB in size, in
JPG format. Image mosaics were constructed by E. Kopan (IPAC).
The 2MASS project is being carried out with two identical 1.3-meter aperture,
open-tube, equatorial fork-mount telescopes. These telescopes have been
provided with a Cassegrain focus mount for the infrared cameras and a
secondary mirror which is articulated in the declination direction. During
survey data-taking the telescope moves continuously in declination at
approximately 57"/second, while tracking in hour angle at the sidereal rate.
The articulated secondary executes a sawtooth pattern of motion which freezes
the image of the sky on the focal plane during the frame exposures.
The northern telescope is located at 2306 meters elevation on a ridge below
the summit of Mt. Hopkins, Arizona. (N 31° 40' 50.8",
W 110° 52' 41.3"). The northern telescope is operated by the Whipple
Observatory under contract to the University of Massachusetts.
The southern telescope is located at 2171 meters elevation on a ridge below
the summit of Cerro Tololo, Chile. (S 30° 10' 3.7",
W 70° 48' 18.3"). The southern telescope is operated by the Cerro Tololo
Inter-American Observatory under contract to the University of Massachusetts.
The telescopes were designed, manufactured, and installed by M3 Engineering
and Technology Corp., Tucson, AZ. The optics were figured by Rayleigh Optical
Corp., Tucson, AZ. The telescope control system software was provided by
Comsoft, Tucson, AZ.
Images of the telescopes and observatories can be found
here.
Optics:
The primary mirror is supported by flex rods on an 18-point Hindle mount. The
primary is positioned radially by temperature-compensated plugs that press
against the outer edge of the mirror. Both the primary and secondary mirrors
have been fabricated from Corning ULE glass.
Position Encoding:
Focus stability:
Control system and telescope drives:
Pointing accuracy without correction:
Pointing accuracy with software correction:
A detailed description of the 2MASS camera optical design
appears in Milligan et al. (1996, SPIE Proceedings Volume
2863, p2).
Cryostat and Optical Configuration
Each 2MASS camera consists of a liquid nitrogen cryostat which
contains three NICMOS3
arrays. A raytrace
of the system shows that each array views the same region of the sky
via beamsplitting dichroics. The light passes through both dichroics
to the Ks-band array. The first dichroic
reflection feeds the light to
the J-band array. All three optical paths share the same first element
which lies behind a cryogenic field stop. Each optical path has six
other lenses. This set of six lenses is identical for each band. The
lenses are composed of water-free fused silica (Infrasil) or calcium
fluoride. All lens surfaces are spherical. All optical elements are
anti-reflection coated and the integrated optical assembly transmits
~80% of the incident light. A band-limiting interference filter
located near a pupil image establishes the system bandpass.
The 2MASS bandpasses are:
I. Introduction
1. Objectives and Scope of 2MASS Sampler Data Release
2. Acknowledgments
3. Referencing 2MASS
a. 2MASS Source Naming Convention
The suffix conforms to IAU nomenclature convention and is the sexigesimal
J2000-equinox RA and declination, hence the "J" designator.
b. Acknowledging 2MASS in Publications
"This publication makes use of data products from the Two Micron All Sky
Survey, which is a joint project of the University of Massachusetts
and the Infrared Processing and Analysis Center, funded by the
National Aeronautics and Space Administration and the National Science
Foundation."
II. Contents of the 2MASS Sampler Data Release
Catalogs
Point Source Catalog
Extended Source Catalog
Atlas Images
Software
hcompress
Gallery Images
Ancillary Files
The individual ancillary files are linked to this main document.
III. 2MASS Overview
1. Facilities
a. Telescopes
Primary Mirror:
1300 mm diameter, radius 5200 mm, conic constant -1.000
Secondary Mirror:
232 mm diameter, radius 965.7 mm, conic constant -1.847
Heidenhain tapes with 40-µm bar spacing are attached to the declination
and right ascension drive surfaces. Software provided by Heidenhain in the
encoder interface interpolates between the bars. The least significant bit of
the encoder interface is 0.039 µm on the tape. 1" on the sky corresponds
to 5.9 µm on the right ascension drive surface and 3.0 µm on the
declination drive surface.
The primary-secondary mirror spacing is fixed by
invar rods. The residual
thermal expansion coefficient is 6 µm per °Celsius. The focus
setting is encoded by a 40-µm bar spacing Heidenhain tape (interpolated
to 0.039 µm). The focus setting repeatability is approximately 5 µm.
On command the focus mechanism searches for an index mark on the Heidenhain
tape and then moves to a software determined set point. The focus is
automatically adjusted for changes in telescope temperature (northern and
southern telescopes) and elevation angle (northern telescope only).
The control system is a DOS-based program called PCTCS. This software has
been provided by COMSOFT. The telescope is positioned by friction contact
capstans driven by DC servo motors.
The pointing accuracy without corrections is approximately 30" on the sky.
The polar axis of the telescopes is within 30" of the true poles.
Pointing corrections are made within the PCTCS control system software. The
correction coefficients are determined by analysis using the TPOINT program
provided by Patrick Wallace. After correction the RMS pointing error is less
than 7" over the range -4.25h to +4.25h and -30° to +80° with the IR
camera installed.
b. Camera and Detectors
| J-band | 1.11 - 1.36* microns |
| H-band | 1.50 - 1.80 microns |
| Ks-band | 2.00 - 2.32 microns |
The detector quantum efficiency, the anti-reflection coatings, and transmission of the dichroics, window, and optical elements are relatively flat across the bandpasses, so the band response functions are believed to be square to a good approximation. These values are all based on manufacturer's specifications. The completed camera optical assembly forms a modular unit which attaches to the cryostat cold plate adjacent to the three detector arrays.
The optics relay approximately 90% of the energy of a laboratory point source onto one 40 micron NICMOS3 pixel. When mounted on the 2MASS telescopes each pixel subtends approximately 2.0" on the sky. Platescale varies by <1% between the three bands.
Electronics
The 2MASS readout electronics sample each pixel with 16-bit precision with a pixel dwell time of 3.0 microseconds. A complete readout of the array requires approximately 51 milliseconds. In order to preserve a constant integration time spatially across the array, the reset cycle clocks with precisely the same timing as a readout cycle. A 2MASS frame results from the following sequence of events:
The gain of the 2MASS electronics is approximately 8 electrons per analog-to-digital count. The array bias voltage has been set to 1.00 V to produce a dynamic range of 50,000 counts or 400,000 electrons. The system read noise in a doubly correlated difference is 5 counts or 40 electrons. In the standard 1.3 sec integration, sky photon noise dominates the read noise in all three band, although under extremely low-airglow conditions the read noise and photon noise in the J-band become nearly equal.
The 2MASS arrays image the sky while the telescope scans smoothly in
declination at a rate of 57" per second. The telescope scans are designed to
cover "tiles" 6° long in the declination direction and one camera frame
(8.5') wide in right ascension.
While the entire telescope scans in the declination direction at a constant
right ascension, the telescope's secondary mirror tilts opposite the
scan direction to momentarily freeze the focal plane image. At the end of
each Reset-Read-Read cycle described in Section III.1.b,
the secondary flies back to its start position and freezes a new piece of sky
displaced by about 1/6 frame from the previous frame.
The dead-time between frames is less than 0.1 sec, and is used for
for secondary flyback and array reset. When accounting
for this dead-time and the time to point the telescope and initiate a scan,
the 2MASS observing system integrates on sky approximately 84% of each night.
This
movie
shows several consecutive frames from a scan through the globular
cluster M92.
The camera field-of-view shifts by approximately one-sixth of a frame in
declination from frame-to-frame. This
figure
illustrates the relationship between individual camera frames and survey tiles.
The camera images each point on the sky six times for a total integration time
of 7.8 sec. The scan rate (and, thus, the frame-to-frame declination offset)
and array orientation are set, so that each of the six apparitions of a given
star occur at a different location relative to a pixel center. This sub-pixel
"dithering" improves the ultimate spatial resolution of the final coadded
Atlas Images relative to a single undersampled image
taken with 2.0" pixels. This
image
compares a single survey frame with the final Atlas Image product.
At the end of a 6°-long scan the telescope shifts position by 90% of a
frame width in right ascension and begins another scan. Thus, all 2MASS tiles
overlap by 10% in right ascension (approximately 50") and data from this
overlap region is used to monitor the photometric consistency of the survey
from scan to scan. 2MASS tiles are slightly longer than 6°, to provide
for a full 8.5' frame overlap in the equatorward direction between declination
bands.
2. Data Acquisition
a. Scanning Strategy
| North | South | |||
| Band | Plate Scale | Rotation | Plate Scale | Rotation |
| ("/Pixel) | (°) | ("/Pixel) | (°) | |
| J | 1.9966 | 0.31 | 1.9894 | +0.22 |
| H | 2.0060 | 0.38 | 1.9919 | +0.25 |
| Ks | 1.9839 | 0.27 | 1.9799 | -0.18 |
Tile Numbering
Tiles are described by their declination band (as defined by the equatorward edge of the tile ignoring tile overlaps, e.g. +0, +6, +12,... and -0, -6, -12, ...) and then by the RA of their western equatorward corner. Tiles observed by the northern observatory are numbered in the following fashion: starting with tile 0 which is located at 0h00m00s RA, +0 DEC, tiles are numbered with increasing RA and then with increasing DEC up to tile 29824 at 23h52m55".9 RA, +84 DEC. Tiles in the negative declination bands are numbered similarly starting with tile 100000 at 0h00m00s, -0 and ending with tile 129824 at 23h52m55.9s RA, -84 DEC.
Tiles observed from the southern observatory are numbered in the same way as those observed from the north, but have a value of 200000 added to the tile number. This numbering scheme is designed to allow the same region of sky to be observed by both the northern and southern observatories as needed without conflict.
To determine in which tile a given coordinate falls, use the on-line utility CoordSearch.
Sky Coverage Boundaries
The northern survey has begun observations of the +12 declination band and north. The southern survey has begun observations of the -0 declination band and south. The declination boundary between observations from the two observatories will be determined closer to the end of the survey.
Time Requirements
The integration time for a frame includes: two 50 ms resets (one occurs during the secondary flyback period, the second starts as the secondary starts scanning), one 51 ms R1 integration, one 1.3 sec R2 integration. An additional 5 ms of padding is added to allow for the trigger pulse and to center the integration period on the scanning ramp. The total dwell time on the sky for a frame is thus 1.455 sec.
A 273 frame survey scan takes 6.97 min (including overhead). Allowing for telescope slew time, an average survey tile takes 7.05 min. A full calibration observation consisting of six calibration tiles takes 10 min (including overhead and telescope slew time).
First-order photometric calibration for 2MASS
is evaluated nightly using observations of calibration fields
made at regular intervals. Photometry of standard stars in these fields
is used to derive the photometric zero points in each of the three
survey bandpasses as a function of time during each night.
Atmospheric extinction coefficients are derived from 2MASS observations
made over long periods.
Calibration Tiles and Observations 2MASS calibration tiles are 1° long in declination (plus overhead),
and are covered by scans containing 48 frames. Each
calibration observation consists of six independent scans of a
calibration tile, made in the same freeze-frame scanning mode and scan rate
as the normal survey tiles. Each scan is made in alternating directions and is
cross-stepped 5" in RA from the previous one to minimize systematic
pixel effects.
Calibration Strategy
At the beginning of the Survey, two calibration fields were observed every
two hours during a night. Beginning on 11 October 1997 UT, and therefore
including the night of 2MASS Sampler observations, the calibration strategy was
modified so that one calibration field was observed approximately every hour
during a night. Normal 2MASS operations are started with a calibration
observation, and the actual calibration interval is adjusted
so that the final calibration observation is coincident with morning
twilight.
The calibration strategy emphasizes the measurement of the photometric
zero point of the night, so a few calibration fields are
and measured multiple times during a night. The selected fields are
alternated so the same field is rarely observed on sequential hours.
Repeated measurements of calibration fields during
at night at a variety of elevation angles are used to develop long-term
atmospheric extinction statistics.
There were 12 separate calibration observations made on the 2MASS Sampler
night, covering 5 different calibration tiles.
Thus, there were actually 72 independent scans of calibration tiles made.
2MASS Calibration Fields
The 2MASS calibration fields, or tiles, were selected to be centered
on one or more primary calibration stars drawn from either the list of
faint near infrared standard stars developed by Persson et al.
(1998 AJ, 116, 2475)
or the UKIRT group of faint, equatorial near infrared standard stars
(Casali and Hawarden 1992, JCMT-UKIRT Newsletter, No. 4, 33)
Calibrators were selected so that there
would be a set of equatorial and ±30° declination fields
on approximately 2h RA centers around the sky, if possible.
The equatorial fields can be observed from both hemispheres to develop
short-term tie points between the observatories, and the high declination
fields will transit close to the zenith at Mt. Hopkins or Cerro Tololo,
providing low airmass calibration. Because the Persson et al. and
UKIRT lists have very few stars at +30° declination in the
20-22h range,
a field was defined in that area and the standards in it were
calibrated internally to 2MASS over the first few months of observations.
Incidentally, this field was selected to cover the Abell 2409 galaxy cluster
so that long-term monitoring of galaxy photometric performance in the
Survey could be made.
Secondary Calibration Stars
Although each 2MASS calibration tile is centered on one primary calibration
star, there are dozens if not hundreds of high signal-to-noise stars
measured during every scan of those tiles. It did not take long to
begin to accumulate a wealth of highly accurate relative photometry for the
secondary stars in each field, calibrated in the internal 2MASS system.
Within a few months of the start of survey observations, the secondary
standard star photometry was included into the calibration calculations,
greatly improving the accuracy of the zero point determinations for each
night. For example, the calibration fields observed on the
2MASS Sampler night contained 24 (92409), 7 (90004), 35 (90290), 21 (90161)
and 26 (90067) total standards stars, respectively. The 2MASS secondary
star network will continue to improve and grow as the survey progresses,
and these will be incorporated into the photometric solutions.
Raw data acquired at the 2MASS observatories is transported to the
Infrared Processing and Analysis Center (IPAC) via DLT tapes. At IPAC,
the raw data is reduced using the 2MASS Production
Processing System (2MAPPS). 2MAPPS is designed to exploit 2MASS's
innovative data acquisition techniques
to produce image, point and extended source data.
The 2MAPPS High Level Flowchart
illustrates the basic components of the 2MAPPS system.
Data from each 6o 2MASS scan are processed as a unit, with
the J, H and Ks frames processed in parallel.
In general, data processing within 2MAPPS is a linear process with the
output of each step being the input for each subsequent step.
Iterations are held to a minimum for efficiency.
The basic processing steps are as follows:
The sections below provide more detailed descriptions of each of these
processing phases within 2MAPPS.
Instrumental characterization data is acquired during nearly every night
of 2MASS operations. These data include series of dark measurements
(frames acquired with a cold shutter obscuring the detectors), and
relative pixel responsivity measurements (flat-fields) made of the rapidly
dimming or brightening twilight sky.
Nightly bias correction images in each band are generated in the
pipeline processing by combining all of the dark sequence frames.
Responsivity images (multiplicative
gain corrections) are derived from the measurements of the twilight
sky by charting the relative change in intensity seen in every pixel
in response to the changing illumination level of the twilight sky.
The resulting pixel-by-pixel responsivity images are normalized to have
a median of unity.
Each nightly responsivity image in each band is compared to a running mean of
the responsivity maps from the previous five nights. If the nightly
flat-field is in good agreement with the running "canonical" flats,
the new measurements are averaged in to generate new "canonicals". If
the nightly responsivity measurement deviates from the running average,
such as might occur if clouds contaminate the twilight measurements,
the nightly measurements are rejected and not added to the "canonical"
responsivity images.
The nightly dark and responsivity
measurements allow the 2MASS detector systems stability and
performance to be monitored with unprecedented accuracy. Deviations
as small as a few percent from long-term mean dark and response "canonical"
are easily detected.
For each R1 and R2-R1 data frame in a scan, the appropriate nightly dark frame
is subtracted, and the corresponding average "canonical" responsivity image is
divided into it. Within each scan, a series of additive sky illumination
corrections are derived by creating sigma-trimmed averages for blocks of
at least 42 dark-subtracted, flat-fielded sky frames. The trimmed averaging
rejects any sources within the frames and yields a measurement
of residual dark-sky illumination patterns on the detectors within each block.
This so-called "sky offset" frame is then subtracted from each input
frame, resulting in a data frame ready for source detection and
combination into the final survey Atlas Images. The background levels
of the final instrumentally calibrated frames correspond to the original
sky levels.
The reduced R2-R1 frames for each 6°-long scan are spatially
registered and combined into a series of 8.53' × 17.07'
(512 × 1024 pixel, 1" per pixel) Atlas Images. Each Atlas Image
represents the coaddition of six overlapping frames as described below. The
images are centered on the cross-scan coverage, and adjacent images within a
scan overlap in declination by 54". The J, H, and Ks band images
are produced separately, but are registered onto a common astrometric grid to
facilitate three-color investigations. Atlas Images are written in FITS
format, and contain both the astrometric solution for the image in
the J2000 coordinate system and the nightly calibrated photometric zeropoints
within the FITS header (keyword "MAGZP").
Due to space limitations, the Atlas Images provided in the Sampler have
been compressed using a lossy compression algorithm (cf II.3.a).
The Atlas Images are produced by first spatially registering the
dark-subtracted, flattened, and sky-offset
subtracted R2-R1 frames relative to each other, using the
estimated positions of point sources in the frames
(cf III.3.g). These frames
are placed on the output Atlas Image coordinate grid one at a time, using a
flux preserving interpolation kernel.
Camera pixels which have poor responsivities, are excessively noisy, or are
affected by transient effects such as cosmic rays (as identified by
unconfirmed single frame detections), are masked off during the interpolation
procedure. Prior to adding the frame to the output image, the frame background
is adjusted to match that of those frames already combined into the image, by
removing the median of the differences at each point in the sky in the
overlap region
between the incoming frame and the previously-combined frames. This process
produces seamless images, except in cases where the background levels vary
rapidly with time due to clouds, atmospheric OH emission, or severe optical
effects from extremely bright objects (such as beta Pegasi).
The final output Atlas Image
represents the average of six such interpolated, background-adjusted frames.
Because some pixels are masked, any one pixel in the Atlas Image may represent
the average of anywhere from zero to six frames. Output pixels consisting of
zero or one frame are set to zero in the compressed Atlas
Images.
Overview: As described in the introduction to section III.3,
the detection and measurement of point sources is done
several times during the processing of a 2MASS scan. Each detection
and measurement step serves a different purpose. Sources
are first detected and aperture-photometered from the individual
dark-subtracted, flattened and sky-offset corrected R1 and R2-R1 frames.
These detections provide positions to tie the frames together for Atlas Image
generation (cf. III.3.b), and photometry
for objects that
are saturated in the R2-R1 (1.3 sec) exposures. Source detection is
done on coadded Atlas Images for maximum sensitivity. Both profile-fit
and aperture photometry is carried out for these fainter detections, although
the measurements are actually carried out on the individual R2-R1 data frames
to avoid flux biases caused by masked or aberrant pixels.
The entries for each object in the 2MASS Point Source Catalog contain
a "default magnitude" field for each of the three survey bands
(j_m, h_m and k_m). These values represent what are believed to
be the best estimate of a source's brightness in each band. The
origin of those magnitudes is described in the "rd_flg" parameter, so
users are urged to consult that flag for all objects.
The subsections below describe each of the detection and photometry
algorithms in more detail.
Frame Source Detection and Aperture Photometry
Point sources are detected in each instrumentally-corrected R1 and R2-R1
frame by identifying local intensity maxima. Positions are
measured for these detections using a maximum-likelihood estimator and
brightnesses are measured using aperture photometry within a 4" (two
camera pixel) radius aperture. The aperture photometry
on a frame is performed by summing pixels entirely within the aperture and
interpolating pixels partially within the aperture. The sky background for
each object is computed in an annulus with an inner radius of 24.0" and an
outer radius of 30.0". Pixels in the sky annulus are entirely included or
excluded based on the distance of their centers from the source. The
sky value is estimated by first excluding saturated, masked, or unreasonably
low pixels. A sigma-trimmed median of the surviving sky pixels is then used
as the sky estimate. Aperture photometry is performed on a frame-by-frame
basis, and the photometry and positions from the maximum six possible
overlapping frames are combined using an unweighted average.
READ1 Aperture Photometry
The photometric dynamic range of 2MASS is extended by the use of the
51 ms R1 exposures. Sources saturate on the 1.3 sec R2-R1 exposures at
magnitude levels of approximately 8.0, 7.5 and 7.0 at J, H, and Ks,
respectively. For objects that are found to have one or more saturated pixels
within the measurement aperture on the R2-R1 frames, the "default magnitude"
quoted in the Point Source Catalog records is taken from the aperture photometry
from the R1 frames. This is indicated by a value of "1" in the "rd_flg"
parameter in the point source records, for the appropriate bands. Positions
measured from the R1
frames are used in the final source position estimation
only if R2-R1 profile fit results are not available.
The aperture photometry measured in this step for non-saturated R2-R1
sources from individual frames is not carried forward as part of
the final source characteristics.
Faint Source Detection
The fainter, and thus majority of sources found by 2MASS are detected
from the Atlas Images. Each Atlas Image is convolved with a zero-sum 4" FWHM
Gaussian over a 13 pixel sub-array. The resulting zero-sum filtered
image is thresholded, and for each maximum over threshold, a detection
is identified and a rough position estimate is computed from the
corrected centroid. This detections list is sent to the software module
that computes the running estimate of the seeing during a scan, and to
the photometry routines that compute the
refined estimates of flux and position. The detection threshold used is
3.0 times the estimated noise
level for the Atlas Image. The noise level is estimated as the difference
between the 50% and the 15.87% quantiles of the image histogram.
Profile-Fit Photometry
The primary photometry and position estimation algorithm for each
candidate detection from the Atlas Images is point source profile-fitting.
This provides the most robust estimation for faint sources and objects
in denser or more complex environments.
Although the detection is done on the coadded Atlas Images, the point
source fit is done by determining the optimal position and amplitude of
an appropriate profile by minimizing the combined chi-square of the fit to
the source on each of the six individual frames. The relative position
offsets for the six frames has already been determined during the Atlas Image
generation (cf III.3.b), so the only
parameters that are allowed to
vary during the fit are the amplitude and the x and y position of the profile
relative to the "stack" of six frames. The resulting covariance matrix
of the fit also returns measures of the brightness and position
uncertainties, as well as the reduced chi-square goodness of fit.
For the initial 2MASS data processing, no attempt is made to
deconvolve single candidates with poor profile fits (i.e. large
chi-square values). However, if
the point source detection algorithm reports multiple candidates
closer than approximately 5" (the precise number varies with the actual
seeing), then the profiles will be
fit to each detection simultaneously, iterating on the fit to properly
account for the contribution of
nearby sources to each component. Sources that are treated
in this way have the "bln_flg" (blend flag) in the Point Source Catalog
record set to values >1, where the value indicates the number of
candidates fit simultaneously. Blend flag values >1 are therefore useful
as indicators of possible confusion in regions of high source density.
Objects with valid profile-fit R2-R1 photometry (i.e. non-saturated
and converged profile fit) have "rd_flg" values of "2"
in the Sampler Point Source Catalog record. This
corresponds to the great majority of all point sources in the Catalog.
Point Spread Functions and Seeing Estimation
The source contribution to the profile fit model is proportional
to a point-spread-function (PSF) which is taken from a library of PSFs
indexed by seeing for each band. PSF's are not
derived "on-the-fly" during 2MASS pipeline processing because of the
difficulty in automated PSF construction in much of the sky due to
both very low and very high source density. PSF-derivation is also
a cpu-intensive task, so the use of a PSF library results in
much faster processing run times.
The library PSFs corresponding to specific seeing values were constructed
empirically using from single 2MASS calibration scans having that average
seeing value. Images of the 50 brightest stars in each scan are centroided
and aligning, summed, and finally interpolated into a 0.1" grid.
In addition to the PSFs themselves, an estimate of the uncertainty in the PSF
(the "variance map") is also produced on the same grid and used by the profile
fit analysis to estimate the total uncertainties in the resulting estimates.
Selection of the calibration scans for PSF generation, and of the PSFs
themselves, was based on criteria such as small variability of the seeing
parameter during the scan, x- and y- central moments of the stars being
equal (typically within 10%),
and consistency with other PSFs taken under similar conditions.
A single PSF is assumed to accurately characterize the point source
profile across the 2MASS focal plane for the purposes of the
data processing.
The appropriate PSF is chosen for the profile fitting photometry
during the processing of a 2MASS survey scan by estimating the mean
point source diameter (seeing) on spatial scales no finer than the length
of an Atlas Image, 17', corresponding to a time interval in the
scan of approximately 18 sec. The actual interval used to determine
the seeing is driven by source density, and in low star density regions
the interval can be up to 3 times longer. If the seeing
is variable on timescales shorter than the seeing estimation response
time, there can be a photometric error of up to several percent induced by
a mismatch between the true image profile in the PSF used in profile-fitting
photometry.
Aperture Photometry and Curve of Growth Correction
Aperture photometry is also performed for each candidate detection
from the Atlas Images to provide a reference to the absolute photometric
scale for the profile-fit photometry, statistics on the detectability
of an object, and as a back-up source of brightness information
when profile-fitting fails to converge to a valid measurement.
As with the profile fitting, the aperture photometry
is made at the position of the faint detections on the individual frames.
The brightness is measured in a series of apertures ranging in radius
from 3" to 14", in 1" steps, by summing pixels entirely within the aperture
and interpolating pixels partially
within the aperture. The sky background for each object is computed in
an annulus with an inner radius of 14.0" and an outer radius of 20.0".
Pixels in the sky
annulus are entirely included or excluded based on the distance of
their centers from the source. The sky value is estimated by first
excluding saturated, masked, or unreasonably low pixels. A sigma-trimmed
median of the surviving sky pixels is then used as the sky estimate.
The aperture measurements from each of the six input frames are
combined using an unweighted average.
Aperture measurements are usually possible on six frames for each detection.
However, if one of more of the frames contains a masked pixel within 4" of the
source location, that frame is excluded from the the measurement.
The aperture measurements from each of the remaining input frames are
combined using an unweighted average. The "ndet_flg" parameter included
in the Sampler Point Source Catalog record tabulates the number of
frames on which a >3-sigma aperture photometry detection was made
and the number of frames available for measurement, for each band of
each source. For brighter sources, this can be used as a reliability
indicator, and for fainter objects, it can be used as a sensitivity
indicator.
The multiple aperture photometry for all sources observed under the
same seeing conditions during a 2MASS survey scan is used to
to determine the curve-of-growth correction to the
aperture measurements. The curve-of-growth correction is defined to be the
correction factor that must be applied to the "standard aperture" magnitude
(measured in the 4" radius aperture) to an "infinite" size aperture.
This is a way to account for any light that falls
outside of this aperture without suffering from degraded signal-to-noise
that would result from simply using the measurement from a large aperture.
The curve-of-growth correction will be seeing
dependent: when the seeing is poorer, the correction is larger. The
curve-of-growth is evaluated by calculating the differences between successive
aperture magnitudes for each R2-R1 source and testing for when the
differences converge to zero, within measurement uncertainties.
The correction is the median difference between the
4" aperture magnitude and the magnitude in the aperture at which the
magnitude differentials become zero, for a large ensemble of stars.
For the 2MASS Sampler night, the radius at which the curves-of-growth
converged are typically 6-7", and the aperture corrections are typically
0.02-0.03 magnitudes.
The "default magnitude" given for most objects in the 2MASS Sampler
Point Source Catalog is the profile-fit magnitude. The
curve-of-growth-corrected "standard aperture" (4" radius) magnitudes
(j_m_stdap, h_m_stdap and k_m_stdap) and uncertainties
are also provided for most objects in the Point Source Catalog.
On occasion, the profile-fitting photometry for a source will
fail to converge, and no valid point-source photometry will be produced.
If there exists a curve-of-growth-corrected aperture magnitude for
such objects, this magnitude will be listed in the "default magnitude"
entry, and the "rd_flg" for the appropriate band will have a value
of "4." Extreme caution should be used in interpreting these magnitudes
because they are usually evaluated in confused regions where there
is often serious contamination in the sky annuli for the aperture
measurements.
Photometric Normalization
The point source profile-fit photometry is tied to the absolute photometric
scale of the system by normalizing to the
curve-of-growth-corrected aperture photometry. This is done separately
for all sources in a survey scan having the same seeing value, since the
normalization can change with seeing. The median offset between profile-fit
and curve-of-growth-corrected aperture photometry
is calculated iteratively with 3-sigma rejection for all stars. The resulting
offset correction is added to the profile-fit photometry, and this corrected
value is the "default magnitude" listed in the Point Source Catalog
record for most sources ("rd_flg" = "2").
The R1 aperture photometry
for all sources is then normalized to the corrected profile-fit photometry,
using objects that are both bright enough to have been detected in
the R1 frames but below the R2-R1 saturation limit, and therefore having
valid profile-fit photometry.
There is typically 2-3 magnitudes of overlap to provide an empirical
measure of any offset between the photometric scales.
As with the profile-fit/aperture photometry normalization, the median
offset between the R1 aperture and corrected profile-fit photometry
for all available sources is calculated iteratively using 3-sigma rejection.
This correction is then applied to the R1 photometry for all sources,
and the corrected magnitudes are listed in the "default magnitude" fields
for the Sampler Point Source Catalog for all objects saturated in
the R2-R1 exposures ("rd_flg" = "1").
Brightness Estimation for Very Bright Stars
R1 aperture photometry is not valid for stars which are saturated in the
R1 exposures. However, it has been determined from measurements of fainter
stars that the brightness of the first persistence artifact
is proportional to the brightness of the parent star. If a measurement
of the first persistence artifact can be made on the R1 frames, then
the brightness of the parent is estimated using that relationship.
Bright stars that have photometry estimated in this way are flagged
in the 2MASS Sampler Catalog with "rd_flg" values of "3".
The calibration of the parent/persistence relationship is not very
accurate, so the uncertainty of these brightness estimates is
large, perhaps of order 0.5 mags.
For stars that are 1-2 magnitudes brighter than the R1 exposure saturation
limits, the first-persistence artifact cannot be accurately measured because
it is quite extended. No estimate of the brightness of such objects
is made using 2MASS data. Placeholders for these bright stars are placed in
the 2MASS Point Source Catalog, and approximate positions and
brightnesses are provided from external catalogs. The positions
are generally taken from the Hipparcos, ACT, or PPM catalogs, when
available. Photometric estimates are taken from the Catalog of
Infrared Observations (Gezari, Schmitz & Meade 1987, NASA Publication 1196).
These "placeholder" Catalog entries have "rd_flag" values of "8".
The positions and brightnesses of these entries should be used
only with extreme caution, and are provided for informational
purposes only. There are four such objects in the 2MASS Sampler
Point Source Catalog.
As has been indicated, source magnitudes and positions are derived
independently in each color band. The detections in each band are
merged into a single source listing using the positions and uncertainties
in each band. The merging algorithm is based on positional proximity,
but contains hierarchical logic to rectify confused matches (i.e.
when there is more than one possible match between bands).
Updated positions are derived from signal-to-noise weighted averages
from the bands in which there are detections, and in which the information
in the contributing band is not considered to be confused.
Sources which have possible confusion in the bandmerge process are
indicated by the Confusion and Contamination flag in the
Point Source Catalog record ("cc_flg" = "B").
When a merged source does not have a measurement in a given band,
a band-fill is made by measuring the flux and noise
in a 10" radius aperture at the source position on the Atlas Images
of the undetected bands. The 2MASS Source Catalogs contain a
95% confidence upper limit for non-detected bands in the "default magnitude"
fields, that is based on the measurement and uncertainty in the
aperture, and the local noise in the image. The actual measured
magnitude and error are also quoted for non-detected bands
in the "standard aperture" magnitude fields so users may apply
their favorite algorithm for evaluating upper limits.
Note that negative flux aperture measurements
are specially encoded since the brightness fields are listed as magnitudes.
The 2MASS position reconstruction algorithms
require matching infrared detections with objects in the primary
astrometric reference catalog
(ACT)
and the higher density
USNOA-2.0 catalog.
For each 2MASS source matched to these optical catalogs,
the identifier, blue and red magnitudes, and 2MASS-to-optical positional
offset information from the ACT or USNOA catalogs is included in the
2MASS Sampler Point Source Catalog records. It is emphasized that
these are not identifications between the infrared and optical
sources, but only associations.
Possible optical associations for the 2MASS sources are found using a simple
closest positional-match algorithm. The closest optical source to each
2MASS source, within a maximum separation of approximately 6" is reported.
A match to an ACT source takes precedence over USNOA match.
No attempt is made to find the best pairings of 2MASS and optical sources
in the event an optical catalog object can be matched to more than one
2MASS source. The number of possible optical matches for each
2MASS point source within the 6" search radius is provided for each
association. Also listed is the number of 2MASS sources the associated
optical catalog object might have been associated with. These last two
parameters provide some measure of possible confusion in the associations.
Overview: The extended source processing in 2MAPPS (GALWORKS)
identifies sources that are resolved relative to the PSF and uses various
apertures to measure the flux of resolved sources. Extended source
processing operates
independently on each of the individual Atlas Images in a scan, and does not
have available the individual frame measurements for each source. Due to
the survey strategy, extended source identification is complete only
for galaxies smaller than the
scan overlap size of 50", since some larger galaxies will not be contained on
a single 2MASS scan or Atlas Image within a scan. GALWORKS operates on
larger galaxies, flags galaxies that run into a scan boundary, and saves
image "postage stamps" of all galaxies, including large ones (these
postage stamps are not available for the 2MASS Sampler Release, but
will be for the large Spring 1999 data release).
Two very important steps must occur for proper discrimination
between point and extended sources. First, the seeing must be
characterized throughout the scan to accurately
determine the PSF used to measure whether a source is resolved. Second,
the structure of the background across each Atlas Image must be fit
and subtracted from each Image.
Extended source processing occurs after all detected sources have
been characterized by the point source processor through artifact
identification and band-merging, and hence the point source
measurements for each source are available as a "seed list" for GALWORKS.
This seed list contains nearly every extended source because of the
robustness of the detection step (cf III.3.c).
Sources that pass an initial screening are
intensively examined for extent and their fluxes are measured. Sources
passing further thresholds for extent are placed in the Extended Source
Database. Catalog sources are eventually selected from that Database.
A publication is in preparation to accompany the Spring 1999 release
of 2MASS galaxy data. The
draft version
is written for the user of the Extended Source Catalog, and already contains
significant detail on the algorithms used for the extended source processor.
It may be consulted with the caveat that this is a work in progress. Also,
internal 2MASS working documents are referenced below to give further
information on various topics, but note that these documents were written
for the 2MASS team, and may refer in some parts of them to problems that
were later fixed. The reader must be more alert in reading those documents
than in reading this mini-Explanatory Supplement.
Seeing Characterization
An accurate characterization of the PSF is essential in reliably
determining whether a source is resolved. Detecting galaxies in a
ground-based mission like the 2MASS is thus exquisitely sensitive
to atmospheric seeing and variations in telescope focus.
Most of the time, the seeing and focus vary slowly enough so that even
in low source density areas the stars detected by 2MASS can be used to
determine the PSF as a function of time. Such an estimate of the seeing
is done previously in the pipeline to support profile-fitting photometry
for point sources, but that estimate does not have the
entire scan available at once. Thus the first step in GALWORKS is to more
accurately determine the variation of seeing with time in each scan.
The seeing is measured by determining a size for each source above
some magnitude thresholds, and then using a robust estimator to determine
the mean size as a function of time, rejecting extended sources and single
pixel events from being used by the estimator.
Infrequently, especially when the seeing FWHM is large, the variation in
seeing occurs too rapidly to be tracked by the number of sources available.
If the seeing FWHM is underestimated, true unresolved sources will be
falsely identified as extended. A diagnostic has been developed
that attempts to measure when this occurs, which seems to work well most of
the time. This diagnostic shows that the Sampler night appears not to
be troubled by untracked seeing.
Background Removal
Background removal is crucial to determining whether there is extended
flux surrounding a source. If the background-removed image contains
residual background near a source, the source will incorrectly appear to be
extended, degrading the reliability of the catalog. If the image has
removed too much background, flux around truly extended sources may disappear,
causing incompleteness in the catalog.
Most of the time, the background variation in the Atlas Images is smooth
enough to be fit with a cubic polynomial, after care is taken to mask out
regions affected by sources. The cubic polynomial removes most structure
at scales larger than 4-5'. Thus sources comparable to this size or larger
will have compromised photometry.
The background-removal algorithm appears to work quite well most of the
time. However, two sources of higher-frequency noise exist that are not
removed by the current algorithm: electronic noise pickup in all three bands
and rapid airglow variations at H.
Low-level electronic noise pickup can
occasionally survive to the Atlas Images. Normally, the electronic noise
pickup in the Images is negligible. However, the phase of the
noise pickup can sometimes match the frame frequency and is large enough
to cause photometric problems for extended sources. In the northern
2MASS camera, one side of the array exhibits variation with maximum
amplitudes of ~0.20 DN and periods of 50-75", that can cause extended
source flux errors of ~15%.
The background-removal algorithm is normally extremely successful in
removing airglow variation. However, infrequently the airglow varies too
rapidly and a small portion of airglow emission remains in the images.
This appears to be a problem only at H band because this is the band
in which the OH emission is strongest.
For more information, consult the working document (see
caveat below)
Data Artifacts.
Identification
About ~1600 galaxies brighter than K~13.5 are part of the 2MASS Sampler
data set. A description of the expected completeness and reliability
for the extended source catalog can be found
here.
A subset of previously cataloged galaxies are automatically measured and
extracted into the 2MASS database. This set of objects is selected based on
the optical diameter, in this case, galaxies with a diameter greater than 1',
as listed in the NASA Extragalactic Database (NED). For the larger Messier
objects (and some NGC objects, for example), >5', they are typically too large
to process with the 2MASS imaging data, and so are not processed or extracted
into the 2MASS database. That leaves the remaining (>99%) of the sky for
2MASS to find and characterize galaxies. Extended sources are
identified from point source detections. That is to say, we
characterize each point source and decide if it is extended with respect to
the point spread function (PSF). This is accomplished using a battery of
star-galaxy discrimination parameters, including intensity-weighted moments,
radial profile extent measures, asymmetry metrics and mean surface brightness
flux measures. This set of operations is designed to eliminate point-like
objects (re: stars) and minimize contamination from double stars (the primary
reliability obstacle) and other false galaxies (e.g., artifacts from bright
stars). An important step that precedes star-galaxy separation is careful
removal of the image background, particularly at H-band which is severely
affected by atmospheric "airglow" emission. Once a source has been deemed
"extended" or a candidate thereof, its flux is measured using a disparate set
of apertures, ranging from fixed circular to adaptive elliptical/circular
apertures. The extended source information is extracted to a table and a small
"postage-stamp" image (typically 30"×30" in size) is cut out from the J,H and
Ks Atlas Images. Additional star-galaxy separation is performed as
a post-processing step to further refine the reliability and aid in generation
of the extended source catalog. The final catalog is expected to meet
or exceed the
Level-1 Specifications, that include >90% completeness and 99% reliability
for most of the sky (free of stellar confusion). The point source sensitivity
limits (10-sigma) are 15.8 (0.8 mJy), 15.1 (1.0 mJy), and 14.3 (1.3 mJy) mag
at J,H, Ks, respectively. The extended source sensitivity limits
(10-sigma) are ~1 mag fainter than the point source limits, or 14.7 (2.1 mJy),
13.9 (3.0 mJy), and 13.1 (4.0 mJy) mag at J, H, and Ks,
respectively.
The extended source catalog contains over 340 fields of information
per source, most of which are related to photometry. Below we describe the
different measures of galaxy brightness, followed by a brief description
of each parameter in the extended source catalog.
Photometry
Given the diverse shape, size and surface brightness that galaxies exhibit in
the near-infrared, a corresponding diverse array of apertures are used to
compute the integrated fluxes. The simplest, and therefore most robust,
measures come from fixed circular apertures. A set of fixed circular aperture
include the following radii: 5, 7, 10, 15, 20, 25, 30, 40, 50, 60, and 70".
We report both the integrated flux within the aperture (with fractional pixel
boundaries) and the estimated uncertainty in the integrated flux. The
magnitude uncertainty is primarily based up the measured noise in the Atlas
image, which includes both the read-noise component and background Poisson
component, as well as the confusion noise component (only relevant when the
source density is high). The detailed formula is given
here. Further information with regard to photometry and expected
measurement uncertainty are given below (see URL links below).
A contamination or confusion flag is also attached to each flux measurement
with the following code:
For most galaxies in the 2MASS catalog, small fixed circular apertures give
adequate 'total' flux measurements. In particular, we recommend use of
the R=7" aperture for galaxies fainter than Ks ~ 13 mag (see
2MASS Galaxy Catalog: First Results), corresponding to field names:
c. Photometric Calibration Strategy
3. Data Processing
a. Instrumental Frame Calibration
b. Atlas Image Generation
c. Point Source Detection and Photometry
d. Band Merging and Bandfills
e. Optical Source Associations
f. Extended Source Identification and Photometry
0 if no contamination or confusion from nearby sources
1 if pixels masked within aperture
2 if pixels masked off due to neighboring sources within aperture
3 if pixels associated with previously processed source
6 if aperture near Atlas Image boundary
7 if pixels from bright galaxy mask within aperture
9 if integrated flux is negative
| j_m_7 | J 7" radius circular aperture magnitude |
| h_m_7 | H 7" radius circular aperture magnitude |
| k_m_7 | Ks 7" radius circular aperture magnitude |
| j_msig_7 | J 1-sigma uncertainty in 7" circular ap. mag |
| h_msig_7 | H 1-sigma uncertainty in 7" circular ap. mag |
| k_msig_7 | Ks 1-sigma uncertainty in 7" circular ap. mag |
| j_flg_7 | J confusion flag for 7" circular ap. mag |
| h_flg_7 | H confusion flag for 7" circular ap. mag |
| k_flg_7 | Ks confusion flag for 7" circular ap. mag |
| r_k20fe | 20 mag/sq." isophotal K fiducial elliptical aperture semi-major axis (arcsec) |
| j_m_k20fe | J 20 mag/sq." isophotal fiducial ell. ap. magnitude |
| h_m_k20fe | H 20 mag/sq." isophotal fiducial ell. ap. magnitude |
| k_m_k20fe | Ks 20 mag/sq." isophotal fiducial ell. ap. magnitude |
| j_msig_k20fe | J 1-sigma uncertainty in 20 mag/sq." iso.fid.ell.mag |
| h_msig_k20fe | H 1-sigma uncertainty in 20 mag/sq." iso.fid.ell.mag |
| k_msig_k20fe | Ks 1-sigma uncertainty in 20 mag/sq." iso.fid.ell.mag |
| j_flg_k20fe | J confusion flag for 20 mag/sq." iso. fid. ell. mag |
| h_flg_k20fe | H confusion flag for 20 mag/sq." iso. fid. ell. mag |
| k_flg_k20fe | Ks confusion flag for 20 mag/sq." iso. fid. ell. mag |
The central surface brightness (mag per arcsec2) is computed for
the peak pixel and for the central R <= 5" region:
| j_peak | J peak pixel brightness |
| h_peak | H peak pixel brightness |
| k_peak | Ks peak pixel brightness |
| j_5surf | J central surface brightness (r<=5) |
| h_5surf | H central surface brightness (r<=5) |
| k_5surf | Ks central surface brightness (r<=5) |
Additional information with regard to 2MASS galaxy photometry can be found here:
and more specific studies here:
Extended Source Catalog Field Parameters
The user has the option to download pre-selected fields (mini-set, short-set,
or standard-set). For user and database convenience, we have defined a set of
"default" magnitudes, corresponding to the Ks fiducial isophotal
circular metric (see above). The default mag field names are:
| j_m | J selected "default" magnitude |
| h_m | H selected "default" magnitude |
| k_m | Ks selected "default" magnitude |
Position Reconstruction Technique
Positions of the 2MASS frames are reconstructed by tying the frames together
using frame-level point source extractions of sources common to multiple
frames and tying those frames to the sky using sources which are also
ACT
Reference Catalog stars with accurately known positions. Doing these
two things simultaneously greatly reduces the random walk which would occur
if the frames were tied together only using offsets determined from
the apparent relative positions of stars in the overlap regions.
For each of the three bands, both R1 and
R2-R1 frame extractions are available, so the number of independent sources
that can be used to determine the frame overlaps is considerable.
Because the sky
coverage can go up to 7 frames deep in 2MASS survey scans (nominally 6
frames deep but 7 deep in
small areas in order to be assured of 6), a single source can be detected up
to 42 times in one scan.
For each scan, a set of simultaneous linear equations is set up to compute the
frame positions which minimize the sum of the differences squared between the
same sources detected in various frames, as well as between ACT star positions
and matching extractions. In order to keep the number of variables to solve
small with respect to the number of available measurements, certain simplifying
assumptions are made. Rotation angles of the frames with respect to the scan
direction (cf. III.2.b) are solved separately per band but
assumed constant within a band
over the length of the scan. The same is true of both in-scan and x-scan
scale factors. The relative band-to-band positions (in-scan and x-scan) are
also assumed constant over the length of the scan. The relative R1 to
R2-R1 positions (in-scan and cross-scan) for each band are assumed
to vary linearly with frame number. These assumptions result in 17
scan-related
variables to solve for, in addition to the two position coordinates per frame.
For a typical survey scan of 273 frames there are then 563 simultaneous
equations to solve.
Well after the aforementioned least-square equations were derived, coded
and tested, it was discovered that the relative band-to-band positions
can sometimes change by small amounts during the course of a single
scan. Modeling the band differences as linear functions of frame number,
rather than constant, appeared a better way to go. Therefore,
a separate linear fit is made for each band to minimize differences
with respect to the merged source positions obtained from the original
solution.
After the Atlas Images are generated using the frame positions as
determined above,
point sources are detected from the Atlas Images and extracted using all
available multi-frame, multi-band information. These bandmerged sources
which will go into the catalog reach fainter magnitudes that those previously
built up from the single frame extractions for reconstruction of frame
positions. Using points in common between the two sets of merged sources,
another linear fit is done to remove any biases which might result from the
two different extraction methods.
Position Reconstruction Results
As a whole, the position results for 971116n are quite good, exceeding the
0.5" 1-sigma requirement by a considerable margin.
Figure 1 presents a histogram of RA
differences (true angle) of 2MASS positions with respect to the corresponding
ACT positions for all
the survey scans.
Figure 2 shows a histogram of the Dec differences with respect
to the ACT. Note that the sigmas are approximately 0.08" in both directions
with mean differences that are essentially zero. This is good, but does not
in itself define the reconstruction accuracy. One would expect the errors to
grow between ACT stars, due to random walk.
Position differences within scan overlaps reveal how consistent the
reconstructions are from scan to scan.
Figure 3 shows a histogram of scan-to-scan overlap
differences in RA for all the survey scans. Only those sources with high
extraction accuracies were used since they give the best indication of the
pointing accuracy.
Figure 4 shows a histogram of the Dec differences.
Note that the sigma for RA differences is 0.125", which, when corrected by
the square-root of 2 to account for the fact that the differences are between
two reconstructed positions, reduces to 0.09". The sigma for Dec differences
is somewhat larger at 0.17", which reduces to 0.12".
It is important to note that there are a few scans with low ACT counts, and/or
poorly distributed
ACT's, which have position reconstructions far worse than one might think from
the statistics just presented. This can be seen in the abnormally long tails
in the distribution of overlap differences back in
Figure 4. By analyzing chi-squares for the overlap
differences, uncertainties have been adjusted in the Sampler Point Source
Catalog to
reflect these problem areas. This is described in detail here. It should
be possible in a future release to use the overlap differences to bring
ACT information across scan boundaries and thus greatly reduce random walk
errors of this type.
One of the primary sources of unreliability of 2MASS detections is
confusion with artifacts produced by bright stars. These artifacts include
familiar optical effects such as diffraction spikes, ghost images, and
filter and dichroic glints, as well as features unique to the NICMOS3
detectors used by 2MASS such as latent images and "stripes" (see below).
The following J-Band Atlas Image from the Sampler Night,
ji0640220.fits,
contains the bright star 2MASSs J0245092+285124 (= HD17054; J=5.8, H~5.1,
Ks=4.9 mag).
The following image
shows the same area with source detections that are associated with
artifacts from this star and others marked with squares.
The color coding of the squares is as follows:
During pipeline processing for each 2MASS scan, artifacts are
identified in the extracted source lists by searching for detections
that bear the correct positional and brightness relationship from
bright stars. Detections that are deemed to be highly probably
artifacts are not included in the final release Catalogs for 2MASS.
Sources which are believed to be real objects on the sky, but
may have positional or brightness measurements affected by nearby
artifacts are flagged in the appropriate bands with the "CC_FLG" (confusion
and contamination flag) in the Sampler Point Source Catalog.
Users are urged to pay attention to the values in this flag.
Diffraction Spikes
Diffraction spikes are linear features that extended in the north-south
and east-west directions from bright stars. They have approximately constant
widths, and lengths dependent on the parent
source's magnitude, although at large distances from very bright
stars the east-west diffraction spikes from the northern 2MASS camera
fan slightly. All sources found within the predicted boundaries of a
spike are at least contaminated by the spike. Those fainter than
a fixed magnitude threshold based on the parent star brightness are
considered spurious detections and are culled from the release
Catalog source lists. Source brighter than the threshold
are included in the release Catalogs, but are marked as contaminated
by the spike. Such contaminated point source have a value of "D"
in the appropriate band in the "CC_FLG" in the Sampler Point Source
Catalog Record.
Persistence Artifacts
When a very bright source illuminates pixels on NICMOS3 arrays,
a latent signal that decays with time will persist in subsequent
reads of those pixels. Because of the regular stepping in declination
of 2MASS scanning, bright stars will leave a "trail" of false stars
of diminishing brightness, spaced at regular intervals in the direction
opposite to the scanning. The brightness and duration of the
persistence "trail" is a repeatable function of the parent source brightness.
Note the prominent persistence trail extending north of HD17054 in
the image above, as well as the fainter persistence artifacts
just north of even much fainter stars.
Because these artifacts appear stellar, they are particularly
insidious especially when inspecting 2MASS images.
Because the scanning step size is known very accurately, and because
the decay in brightness of the latent images is well understood,
spurious detections of persistence artifacts can be found in the
source lists during pipeline processing for each scan using simple
geometric and brightness relationships. For each detection that is
in the proximity of an expected persistence artifact, the probability
that it is an artifact based on a positional and brightness chi-square
function is evaluated. The probability is normalized such that
values >0.5 are likely persistence artifacts, and are culled
from the final Catalog source lists. Objects with persistence
probabilities between 0.3-0.5 are included in the Catalog lists,
but are flagged as having measurements that are likely influenced
by nearby persistence artifacts. The "CC_FLAG" value corresponding to
persistence source contamination is "P."
Filter and Dichroic Glints
Glints are point-like images that result from internal reflections
of bright stars within the filter and dichroics of the 2MASS camera.
They are found at
well-defined positional offsets relative to the bright source, and have
magnitudes that are approximately constant offsets from the bright source's
magnitude. For both the northern and southern 2MASS camera, the
glints lie within 20" of the parent object. Like persistence artifacts,
the glints are stellar in appearance, so they can be easily
confused with real objects on the sky in the images. The filter and
dichroic glints have the added feature that they do not appear in all
bands, so they can have extreme apparent colors. For example,
because the Ks light passes through two dichroics, there
is a Ks-only dichroic that produces red "companions" to all
bright stars in 3-color composite images produced from the 2MASS
Atlas Images. An example of these can be seen just to the northeast
of the brighter stars in the
2MASS Image Gallery image of M67.
Glint artifacts are found in the detection lists
by searching for objects within a small radius of the expected position
relative to a bright star that have magnitudes within the uncertainty
bounds of the expected magnitude. Such objects are culled from
the detection lists and nor included in the released 2MASS Catalogs.
Stripes
Horizontal "stripe" artifacts extend in the east-west direction at
the declination of very bright stars, as well as at
256" north and south of the stars position. They extend the width of
a scan, and they are probably some form of electronic residual
of the bright star. These stripes are much fainter than diffraction spikes.
Any detections that fall within the area covered by a stripe may
have photometry affected by the artifact. Such objects are
flagged with an "S" in the "cc_flg".
Bright Star Confusion
Sources that are saturated in the R2-R1 exposures usually cause a flood
of false R2-R1 detections in and around their cores. The radius in which
these false detections is termed the "confusion" radius, and is
dependent on the brightness of the parent object. for very bright
objects, such as beta Pegasi (Ks~-1.9) in the Sampler
Release, the confusion radius can be many arcminutes.
R2-R1 sources found within the confusion radius around a very bright star
are identified as a spurious detections and not selected for inclusion
in the release Catalogs. R1 detections
found within the confusion radius of a bright star are, which are
not the primary detection of the star, can be passed to the release
catalogs but are flagged as confused ("cc_flg" = "C") in the Point Source
record since their photometry is contaminated by the nearby star.
i. Photometric Zeropoint Evaluation and Extinction Coefficients:
The basic transformation between instrumental and calibrated 2MASS
magnitudes applied to all point and extended sources is:
Mcal = Minst + c1 - c2(X-1.0)
where
Each of the coefficients is a function of wavelength. Note that no color
coefficients are included in the 2MASS photometric
transformations, so all photometry is reported in the "2MASS system."
A constant photometric zeropoint in each band, c1(J,H,Ks),
was evaluated for the 2MASS Sampler night by constructing the average
difference between the catalog and extinction-correction instrumental
magnitudes for all primary and secondary standards measured during the night:
c1 = < Mcat - Minst´ >
where
Minst´ = Minst - c2(X-1.0)
As mentioned earlier, the values of the atmospheric extinction coefficients
used for the photometric solution are based on longer term average values
and are not derived on a nightly basis. The extinction coefficients used
for the 2MASS Sampler night photometric calibration are:
c2(J) = 0.109 mag/airmass
The photometric zeropoints and their RMS uncertainties derived for the Sampler
night are:
c1(J) = 0.1192 ± 0.0193 mags The photometric uncertainties quoted in the Sampler Point and Extended
Source Catalogs do not have the contribution of the Photometric
Calibration RMS uncertainties incorporated.
Point and extended sources are detected well below the nominal
survey limits during 2MASS pipeline processing to insure the completeness
of the catalogs. Below the SNR=10:1 brightness levels, the reliability
of the detections
declines rapidly and the majority of very low SNR sources
are merely detections of modulations in the noise background.
The released 2MASS Catalogs, including the Sampler Point
and Extended Source Catalogs, are drawn from "Working Databases" containing
all detections. The Catalogs are generated by extracting
objects from the Working Databases that satisfy a number
of selection criteria that have been developed from empirical
analyses of the data. The selection criteria for the Sampler
Catalogs are conservative, but should provide source lists that
are representative of what users may expect from the upcoming
large 2MASS data releases.
Selection Criteria for Objects in the Sampler Point Source Catalog
Selection Criteria for Objects in the Sampler Extended Source Catalog
For the 2MASS Sampler only, all apparitions of objects detected
in the scan-to-scan overlap regions have been included in the
Release Catalogs. This has been done so that users can use the
redundant observations to assess photometric and positional
quality, keeping in mind the known caveats on
photometric
and astrometric biases.
All future 2MASS Catalog releases will rectify multiple detections
in the scan overlap regions, and will included only one apparition
of multiply-detected objects.
Up to 10% of the sources in the 2MASS Sampler Point and Extended
Source Catalogs may be redundant, because they fall in the overlap
regions.
Important Notes to Users of the Point Source Catalog:
The origin and quality of the photometry listed in the
"default" magnitude fields in the 2MASS Sampler Point Source Catalog
is summarized in the "rd_flg", "cc_flg" and "bl_flg". It is
essential that users
refer to these flags when interpreting photometry for any
source in the Catalog. Each one of these flags has three characters,
each corresponding to one band: the first character is the J-band value,
second is the H-band value, and third is the Ks value.
Stars that are bright enough to be heavily saturated in the R1 exposures
(J<4, H<3.5 and Ks<3 mag), can have confusion
radii, diffraction spikes and ghost reflections that span more
than one scan. An extreme example of this is shown in a montage of
several J-band images of beta Pegasi
from the 2MASS Sampler. The montage covers a region 5 scans
in width, clearly showing the large confusion "halo" and extensive
diffraction spikes of the Ks~-1.9 star.
Artifact identification within 2MAPPS requires a good estimate
of the parent source brightness, and is currently limited to knowledge of
stars that fall within the scan being processing. Heavily saturated
objects, such as beta Pegasi, do not have good photometry, and do
affect scans beyond the one in which is lies. Artifacts
produced by beta Pegasi, as well as 4 other bright stars in the
Sampler night 2MASSs J0850200+091617 (HD 75432), 2MASSs J0707213+224213
(SAO 79072), 2MASSs J2307067+252806 (HD 218356), 2MASSs J0704065+203413
(HD52973) have been culled from the Catalogs "by-hand", using
the geometric relationships from the standard artifact search routines,
and infrared brightness estimates from the Catalog of Infrared Observations
(Gezari, Schmitz & Meade 1987, NASA Publication 1196).
Users should use caution when examining Point and Extended sources
in the vicinity of such bright stars because the reliability
of artifact identification is not yet well tested.
The user is cautioned against assuming a constant value for position
uncertainties in the 2MASS Sampler, even for sources brighter than
a given magnitude or SNR. Uncertainties vary due to
factors associated with individual point source extractions, such as
signal-to-noise ratio and confusion. They also vary due to factors
associated with how accurately the frame positions can be determined.
The latter is primarily driven by the density and distribution within
each scan of astrometric reference stars, taken from the
ACT Reference Catalog.
It is also influenced by the density of 2MASS extractions available
to tie the frames together. Position uncertainties, which reflect a
number of contributors, including those mentioned above, are given for
each source in the Sampler.
In keeping with the quick-release
nature of the Sampler, there has been no attempt to improve the
reconstructed positions in low density ACT regions using scan overlaps
to bring ACT information across scan boundaries. Position
errors can therefore become much larger in these regions. The scan overlaps
have been used, however, to obtain
conservative estimates
of the position uncertainties during these periods which are reflected in
the values quoted for each source. The user should anticipate
that both the positions and uncertainties (especially in low ACT
density regions) quoted in the Sampler will change in the final catalog.
The photometric uncertainties listed in the 2MASS Sampler Point Source
Catalog entries are the measurement errors for each star only. They
do not include the contribution of the uncertainty in the photometric
calibration (cf.III.3.h) or any other
estimates of systematic errors. A minimum photometric uncertainty
of 0.015 mag is quoted in the Sampler Point Source Catalog entries
to provide a measure of net error associated with high
signal-to-noise sources that is determined from the
photometric dispersion observed in multiple measurements
of stars in the calibration fields during the night.
Cross-scan Photometric Bias
Profile-fitting photometry in 2MAPPS assume that
a single PSF adequately describes point sources across the focal
plane of the 2MASS cameras. Any mismatch between the actual
source profile and the PSF being fit can result in an increased dispersion
and small bias in the resulting photometry, relative to fits made
with perfectly-matched PSFs. As with most optical systems, there
is a small variation in the 2MASS system PSF across the focal plane.
This distortion results in a small photometric bias (1-2%)
between the east and west edges of the focal plane.
Although it is small, the bias can be measured by comparing
the systematic differences between photometry of sources
in the scan overlap regions. For the 2MASS Sampler night, the
cross-scan biases range from 1-2% in the J and H band, and ~1% in the
Ks band.
Photometry for extended sources is less accurate than for point sources
with the same magnitude due to the use of more pixels to obtain the flux
measurement and due to the error in determining the Atlas Image background
level for those pixels. Most of the time, for most extended sources, the
photometric uncertainties have been demonstrated to be close to theoretical
expectations calculated solely from the absolute background measured in the
frames, the operations used to construct the Atlas Images, and the number of
pixels in the aperture used to determine the flux measurement (see
Analysis of Photometric Noises for 2MASS Galaxies).
Thus, the flux uncertainties quoted for all sources in the sampler release
solely derive from the theoretical flux uncertainties based on those three
quantities.
However, there are three known sources of additional error beyond the
theoretical expectations for 2MASS extended sources:
i. Error in Determining the Aperture Size
The aperture size must be determined for each source for isophotal
magnitudes. As a result, there is an additional flux error of:
df = df/dr * dr
which depends on the variation of the source flux with radius. 2MASS
cannot independently determine df/dr, and hence the user must be aware that
the quoted flux uncertainties for isophotal apertures are somewhat larger
than the quoted errors. There is no additional flux error from this source
for fixed-aperture fluxes.
Error Analysis For Circular Isophotal Magnitudes
discusses this effect further. Because of the enforced minimum isophotal
radius of 7", many of the fainter 2MASS galaxies have in fact no additional
error, due to this cause since the radius is fixed at 7" for their "isophotal"
magnitudes. However, nearly all 2MASS galaxies brighter than 14.5, 13.8, 13.0
mag at J, H, and Ks have additional error due to this cause, which
can contribute an additional error as large as 0.1 mag.
ii. Small-Scale Airglow Variation
Even on perfectly photometric nights, H band frequently exhibits
significant small-scale airglow variation that cannot be removed with the
2MASS background-removal algorithm (see Analysis of Noise In The 2MASS Atlas Images).
The 2MASS background-removal algorithm works very well most of the time, and
removes nearly all background variation with spatial scales larger than 4-5',
including nearly all of the natural airglow variation. The spatial scale of
4-5' was chosen as the best compromise between fitting the background without
affecting extended sources of size 1-2'. In the dataset we worked with to
tune the algorithm, no cases of background variation at shorter spatial
scales were seen.
However, the much larger 2MASS data sets revealed that a significant
fraction of the data contain a small amount of power in the airglow
variation at spatial scales smaller than 4-5', causing significant
additional error in the photometry of extended sources. The additional
error is statistically correlated with the background-removed noise as
measured in each 2MASS Atlas Image, which is quoted for each extended
source. H Photometric Error Due To Airglow
gives quantitative measures of this effect for a galaxy with H = 13.8 mag.
The additional error ranges from a negligible error for a background-removed
noise of 1 DN or smaller, but can be as large as 0.15 mag for 10% of 2MASS
scans and 0.27 mag for 1% of scans. The additional error of course also
depends on the magnitude of the extended source and the aperture used for the
flux measurement.
Visual examination of the Atlas Images usually quickly reveals whether
airglow is a problem for that Image. If present, it is relatively easy by
hand to determine the level of the background noise at the position of an
individual source, and correct the reported 2MASS H flux. We will explore
automatic methods of removing the residual airglow, but are not optimistic
that we can do so without significantly affecting source fluxes in other
ways.
iii. Electronic Noise
The 2MASS camera electronics produces additional noise present in the
individual camera frames that maps into noise that varies on a spatial
scale of less than the 4-5' that cannot be removed by the extended source
background-removal algorithm. The noise varies in frequency and amplitude,
and hence the resulting noise in the Atlas Images varies dramatically due
to phasing between the frequency of the noise and the fixed 1.5-s
separation of the six frames that are combined to produce the Images.
We have only recently begun to study the additional noise caused by the
remaining electronic noise in the Atlas Images. We have found evidence of
J band electronic noise with dominant periods of around 50" spatial scale
in the northern data, and 80-100" in the southern data. For scan 116 of
971116n, the Sampler night, electronic noise is found only on the left-hand
side of the Atlas Images, with peak amplitudes of 0.16, 0.12 and 0.15 DN at
J, H and Ks (see
Pickup Noise In 971116n Scan 116.
These values are very much larger than the level of 0.05 DN at which errors in
the background do not contribute extra error to extended source photometric
uncertainties. Typical additional errors are 0.05 - 0.10 mag.
When further analysis is available, we will revise this documentation.
The 2MASS Sampler Point Source Catalog contains detections of 29 known
asteroids. Identification of the objects takes place as part of pipeline
processing.
Known Asteroid and Comet Identification
The strategy used to identify possible detections of known asteroids and
comets by 2MASS is to consider the actual area covered during each survey scan,
and the time each point on the sky within the scan was observed.
The asteroid and comet ephemerides are then searched to determine which
objects may have been within the scan boundaries at the specified epoch.
Ephemerides are computed using orbital elements published by the Minor
Planet Center for all numbered asteroids, and all multiple-opposition
unnumbered asteroids, as well as all periodic comets, and recent
nonperiodic comets. The orbits of the planets are included for
completeness and are taken from the JPL DE403. The heliocentric
position of the Earth is derived from DE403, and topocentric corrections
to the two observing sites are included. Although the ephemeris
computations are two-body in nature, the database of orbital elements is
updated every 100 days to incorporate newly numbered asteroids and
improved orbits, and the opportunity is taken to integrate
all the orbits to a current epoch of osculation. The ephemeris accuracy
is typically 1". In addition to the predicted position of the
object, the apparent magnitude is computed, which can be used to validate
proper identification, though a large acceptance window is needed
because of unknown lightcurve and color effects, and the line of variation
is used to represent the major axis of the error ellipsoid. Distances and
phase angle are also computed for purposes of reducing apparent magnitudes
to absolute magnitudes.
If an asteroid or comet is predicted to have a position within the observed
boundaries of a scan during the time of its observation, a search is made
of the extracted 2MASS point source lists for objects that positionally
correlate with the predicted position.
Candidate 2MASS asteroid detections are first screened by searching
for infrared sources within a coarse window of 30" in RA and DEC
around the predicted position. For each 2MASS point source within that
window, a two dimensional chi-square position parameter is computed using the
separation between the 2MASS and predicted positions and the combined
position error covariance matrix. If the value of the chi-square
is less than 16.0, the association is acceptable (a threshold of
16.0 corresponds to a completeness error of 0.000335; in other words,
one correct match out of every 3000 will be missed in the attempt to
avoid false matches). For example, for a predicted asteroid position
uncertainty major axis of 3.0" and a minor axis of 1.0",
this threshold just allows a match with a position discrepancy of 8.5"
along the major axis and 2.8" along the minor axis.
Because the astrometric precision of 2MASS point source positions is
typically <0.2"-0.3" with respect to the
ACT (Hipparcos/Tycho)
reference system, the dominant uncertainty in matching 2MASS candidate
sources to asteroids and comets is the uncertainty in orbital predictions.
Typical uncertainties are in the range 1"-5", and as expected,
The major axis of the asteroid position uncertainty
ellipse is generally parallel to the orbital plane. The astrometric precision
of 2MASS also means that every sighting of an asteroid or comet can be used
to update orbital data for that object.
This table contains a compilation of
all 2MASS Sampler Point Source Catalog entries that are probable detections
of known asteroids. The positions of 75 asteroids and one comet
(6P/d'Arrest) were scanned on the night of 971116 UT by the northern
2MASS facility, and there were 29 nominal detections (6P/d'Arrest was
not detected). Note that several asteroids, including 4650 Mori,
3300 McGlasson, 2983 Poltava, 1993 XO, 1995 GJ7, 1997 YR3 and 1987 YB,
were detected twice because they fall within the overlap region between
adjacent scans.
There is currently no attempt made during 2MASS data processing to
identify previously unknown minor planets or comets. Such a search
might be possible using the repeated observations of the small areas
in the overlapping regions in adjacent tiles.
Last modified 1998 Dec 23. For assistance, contact
2mass@ipac.caltech.edu
g. Position Reconstruction
h. Artifact Identification
The Sampler Point Source Catalog sources in the Image are marked
with circles. Green circles are "clean" detections, not influenced by
any artifacts. Yellow circles are sources believed to be real, but
which may have position and brightness measurements affected because
of proximity to artifacts. The yellow circles also have artifact
boxes within them to indicate the nature of the offending artifact.
i. Photometric Calibration
c2(H) = 0.031 mag/airmass
c2(Ks) = 0.061 mag/airmass
c1(H) = 0.0282 ± 0.0221 mags
c1(Ks) = 0.0222 ± 0.0136 mags
j. Catalog Generation
4. Caveats and Limitations of Sampler Products
a. Redundant sources in scan overlap regions
b. Point Source Catalog Quality Flags
Indicates whether the source was detected in each of the three
bands, and describes the source of the magnitude and uncertainties.
Indicates the number of components fit simultaneously in profile fit photometry.
A measure of source density and possible confusion
Describes if source measurement may be affected by bright star artifacts
such as diffraction spikes, persistence images, stripes or ghost images,
or if measurements source is
confused due to proximity to bright stars or other nearby objects.
c. Artifacts From Very Bright Stars
d. Position errors in regions of low astrometric reference star density
e. Point Source Photometric Uncertainties
f. Extended source photometric uncertainties
g. Asteroids
This document prepared by R. Cutri, S. Van Dyk, and the 2MASS team.
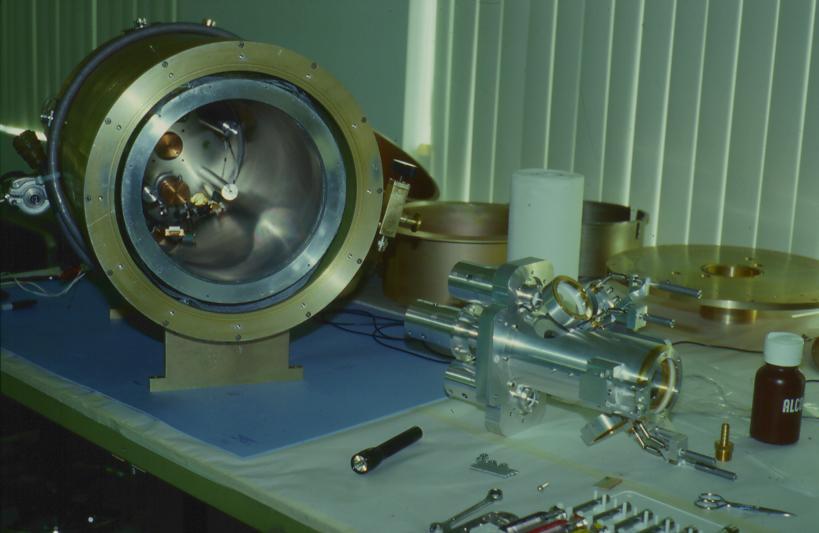
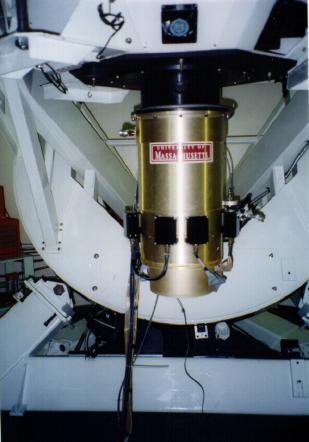
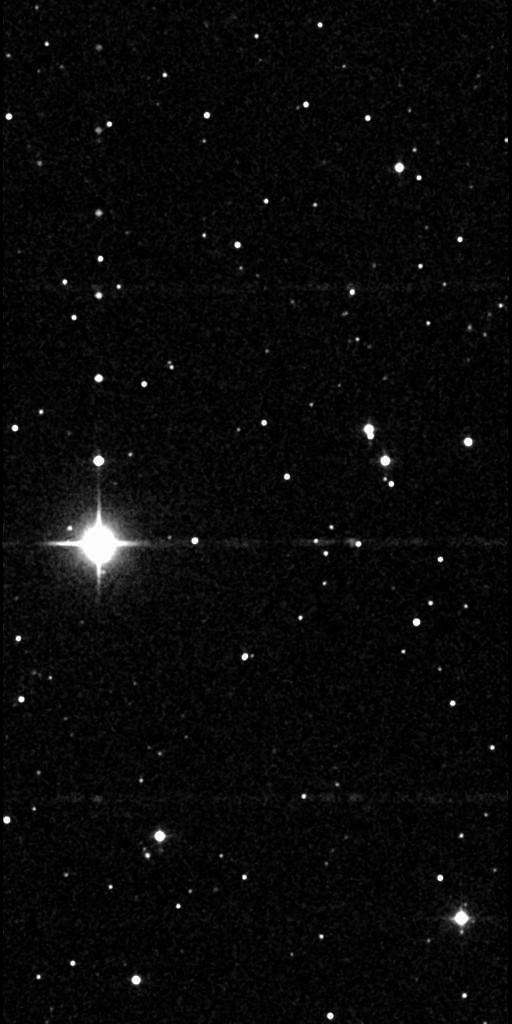
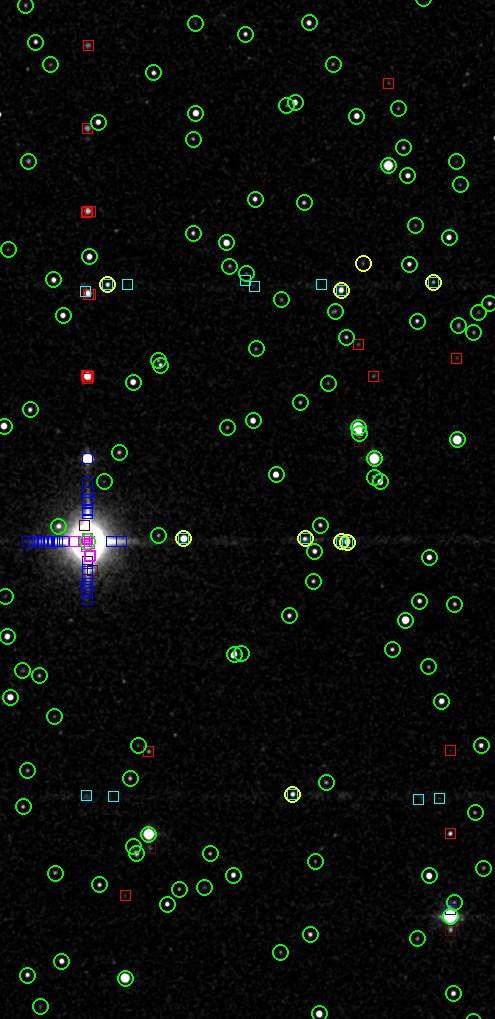
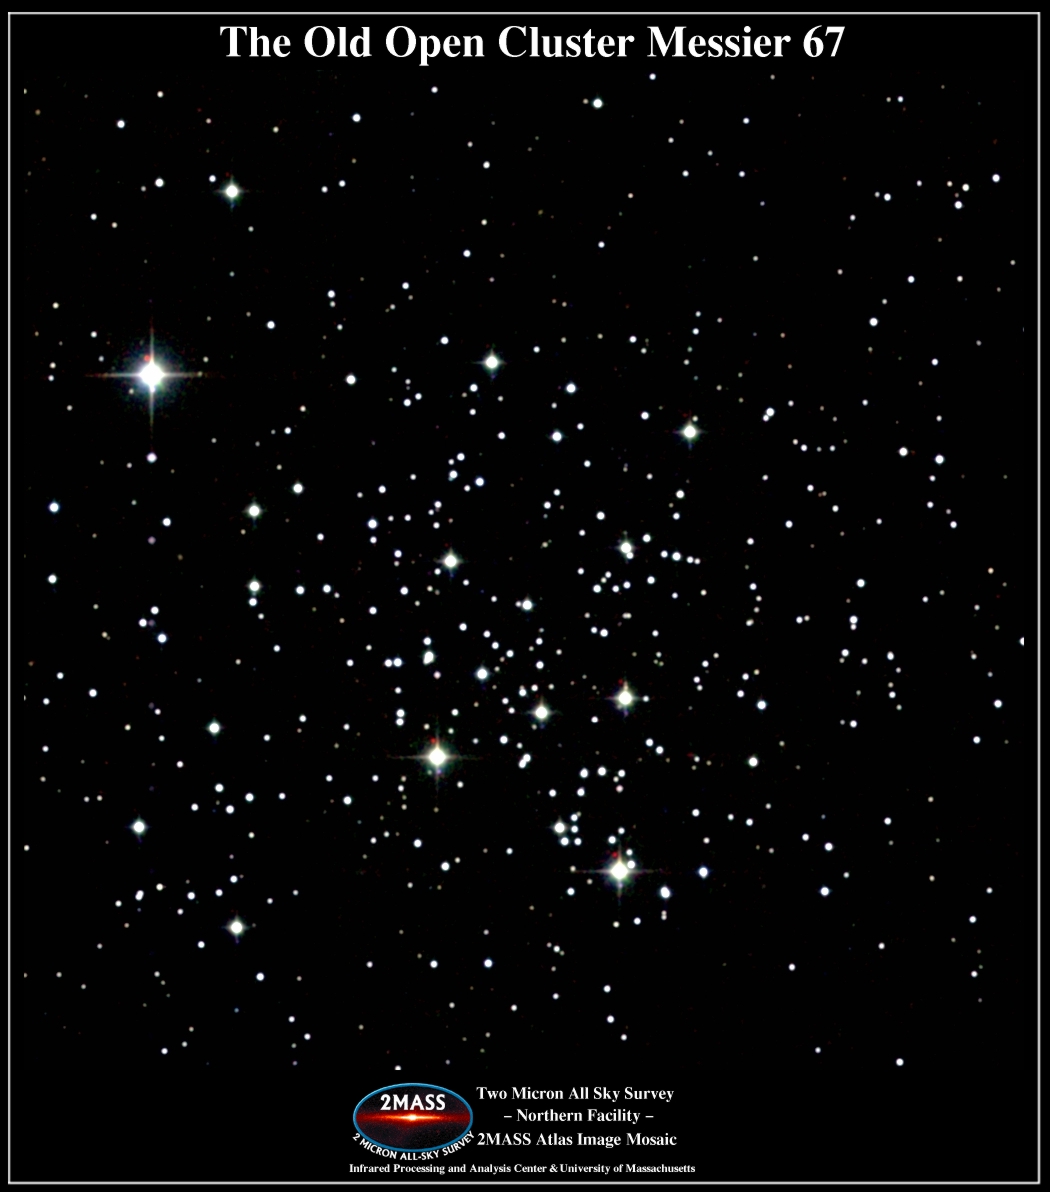
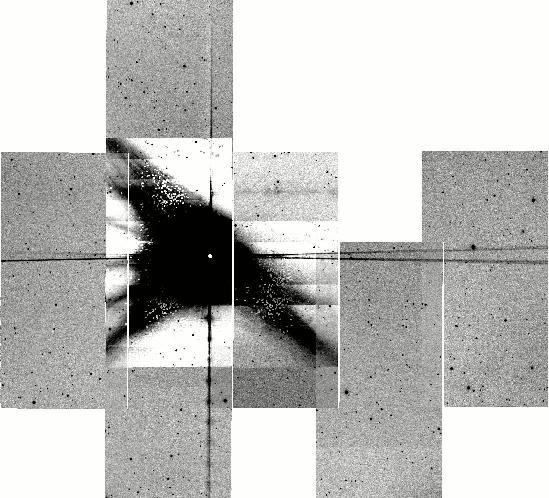